

 PDF
PDF ePub
ePub Citation
 Print
Print


Introduction
Abdominal adipose tissue is composed of subcutaneous and visceral adipose tissue. Visceral adipose tissue can be subdivided into omental, mesenteric, and retro- or extra-peritoneal depots. Obesity is a known risk factor for various diseases, and measurements of adipose tissue are commonly used in obesity research [1,8,11,13]. The amount and location of fat deposited are also indicators of optimal body composition for production traits [7].
Methods of measuring abdominal fat tissue are diverse and include (in order of accuracy and reproducibility) computed tomography (CT), magnetic resonance imaging (MRI), dual energy X-ray absorptiometry (DEXA), dual photon absorptiometry, ultrasonography, anthropometry and eye examination [15].
In humans, accumulation of visceral adipose tissue poses a greater risk for developing obesity-related disorders, metabolic syndrome, hypertension, cardiovascular disease and increased frequency of total mortality than subcutaneous adipose tissue [2,16,17]. Therefore, studies of CT examinations in humans have focused on identifying an optimal technique for the accurate assessment of abdominal fat [9]. Based on the volumetric quantification of subcutaneous and visceral abdominal fat, multi-slice CT is highly reproducible. This technique may improve the predictive value of obesity measurements for various diseases. However, in veterinary medicine, there are a few reports available regarding the use of CT to quantify obesity. Ishioka et al. [5] investigated the use of CT in beagles for evaluation of canine obesity, while Lambe et al. [7] reported the use of cross-sectional CT images to estimate total internal fat in Scottish blackface lambs, and McEvoy et al. [10] evaluated the range of the Hounsfield units (HU) as they relate to fat changes in growing pigs.
This study was conducted to determine the distribution of abdominal fat using CT images based on the CT number and to measure the volume of the abdominal visceral and subcutaneous adipose tissue in minipigs.
Materials and Methods
The procedures employed in this study were conducted according to guidelines of the Institute of Laboratory Animal Resources at the Seoul National University. Six 6-month-old male minipigs (PWG micro-pig; Medi Kinetics Korea, Korea) weighing 23~25 kg were used for the experiments. All minipigs were clinically healthy based on physical examination and the results of hematological analysis. CT was conducted using a helical CT scanner with a single-detector CT (GE Medical System, USA) beginning at the upper edge of the liver and continuing caudally to the L5 level. The pigs were placed under general anesthesia for the procedure. Image acquisition parameters included a matrix of 512 × 512, a large-scan field of view, a 3 mm slice thickness, 120 kVp, 60 mA, and a pitch of 1.3. For the anthropometric method, we measured sagittal abdominal diameter (SAD) and waist circumference (WC) in normal healthy minipigs and compared the CT-based fat volumes to anthropometric data following the CT examination.
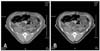
CT number ranges of visceral and subcutaneous abdominal adipose tissue were obtained by manually drawing the region of interests (ROIs) corresponding to each of the images obtained at the T11, T13, L1, L3, L5 levels by three radiologists. In this procedure, we defined the attenuation range of fat tissue as the mean HU values ± 2SD [17]. By adjusting the fat ranges, we easily obtained the volume of total abdominal fat using the built-in software for the helical CT scanner (Fig. 1). We then compared the overall abdominal fat volume with the fat volumes calculated at the T11, T13, L3, and L5 levels by defining them as landmarks to measure the total abdominal fat distribution and to verify the critical level. To assess the volume of visceral adipose tissue, ROIs were drawn manually surrounding the visceral cavity. After measuring the volume of total and visceral adipose tissue, the volume of subcutaneous adipose tissue could be obtained by subtracting the visceral adipose tissue from the total abdominal adipose tissue. This method was applied at the T11, T13, L3 and L5 levels. The visceral/subcutaneous fat volume ratio (V/S ratio) was also calculated.
To check the reliability and validity of the measurements, three radiologists analyzed all of the data separately and the intra-class and Spearman rank correlations were assessed. A p value of less than 0.05 was considered significant for all statistical analyses. Overall fat HU ranges represented the mean ± 2SD.
Results
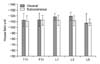
The mean HU values of visceral fat at the T11, T13, L1, L3 and L5 levels (mean ± SD) were -112.77 ± 11.61, -113.40 ± 11.59, -118.57 ± 6.10, -119.41 ± 6.90, and -115.27 ± 8.61, respectively (Fig. 2). The mean HU of subcutaneous fat at the T11, T13, L1, L3 and L5 levels were -110.98 ± 9.51, -112.67 ± 8.88, -112.26 ± 8.63, -111.77 ± 8.56 and -108.80 ± 5.77, respectively (Fig. 2). The HU value of visceral fat was significantly lower than that of subcutaneous fat at the L1 (p < 0.01), L3 (p < 0.01) and L5 (p < 0.05) levels. There was high agreement for the HU value among the three radiologists (intra-class coefficient = 0.9). The overall HU ranges (mean ± 2SD) of each visceral and subcutaneous fat were -147.47 to -83.46 and -131.62 to -90.97.
Although the six minipigs had a similar body weight, SAD and WC, the total fat volumes of the entire abdomen were different, with the highest value of 3,051 mL being measured in minipig No. 1 and the lowest value of 492 mL being observed in minipig No. 6 (Table 1). This trend was also observed when the volumes of each depot were considered separately. The visceral and subcutaneous fat volumes ranged from 131.49 mL to 1,127.32 mL and 360.17 mL to 1,923.71 mL, respectively. The V/S ratio ranged from 0.32 to 0.59.
With regard to the correlations between adipose tissue volume for the entire abdomen, the adipose tissue volume at the T11, T13, L3 and L5 levels and the body weight and anthropometric measurements (Table 2), we found that there was a poor correlation between the anthropometric method and CT based abdominal fat volume. The total abdominal fat volume correlated well with the fat volume at the T11, T13 and T3 levels for total abdominal fat, especially at the T13 level (r = 0.997, p < 0.0001).
Discussion
There are many techniques for the measurement of visceral adipose tissue, including cadaver analysis, CT, MRI, ultrasound, DEXA, anthropometry and eye examination of the subjects [15]. Body condition score based on subjective estimation is widely used to evaluate the nutritional condition of dogs and cats as obesity has become an increasing problem in pet animals [3,6]. This method is known to be very simple and easy for evaluation of the fatty condition based on the eye examination, but the accuracy is low. In the present study, anthropometric measurements such as SAD and WC were found to be poorly correlated with CT-based volume measurements for abdominal adipose tissue. Accordingly, a more accurate method such as CT or other advanced techniques is needed in the veterinary fields.
This study demonstrated the excellent intra-observer reproducibility of CT-based HU range determination of subcutaneous and visceral abdominal fat tissue. Volume measurement through CT also showed excellent intra- and inter-observer reproducibility [9]. Collectively, CT is known to be an accurate and reproducible technique for determination of body composition [15]. Evaluation of the HU value distribution for visceral and subcutaneous fat revealed that the overall HU ranges including visceral and subcutaneous fat were -147.47 to -83.46. The CT ranges in humans, beagle dogs, and growing pigs have been shown to be -190 to -30, -135 to -105, and -90 to -101, respectively [5,10,15]. In the present study, we only examined minipigs that were six months of age. According to a study conducted by McEvoy et al. [10], the range decreases with age for the mean HU values of adipose tissue. Therefore, further study is required to investigate the relatioship between fat distribution and factors such as age, gender, and obesity.
In this experiment, the mean HU of the visceral fat is lower than that of the subcutaneous fat on the lumbar levels. There could be two possible explanations for this difference. It is possible that subcutaneous fat contains a lot of adjacent fascia and connetive tissue when compared to visceral fat so that the subcutaneous fat HU is higher than the visceral fat. The other explanation is based on the location, which includes the air- or stool-filled colon and artifacts such as intestinal motility [10,12,14]. These stuctural limitations have a potential to lead to overestimation of the HU value range and the volume of visceral fat. The CT number inaccuracy could also cause the observed data due to various reasons such as beam hardening and misregistration.
In this study, we found that measurement of the fat volume at the T13 level was the best alternative to scanning the entire abdomen when evaluating total abdominal adipose tissue in minipigs. This result makes it possible to decrease the CT scan time and reduce the amount of radiation exposure.
In humans, viseral obesity is more closely related to metablic disorders, hypertension, cardiovascular disease, and an increased frequency of total mortality than is subcutaneous obseity [5,11,17]. The most widely used method used to diagnose visceral obesity in humans is the V/S ratio [17]. Patients with a V/S ratio of more than 0.4 are designated as having visceral fat obseity [17]. This index is highly related to the risk of metabolic or cardiovascular diseases [2,4]. The V/S ratio was 0.41 ± 0.10 in this study; however, further study using large numbers of normal and obsese minipigs is required to establish their values.
CT is a reliable and convenient method for the measurement of abdominal fat, and has the advantage of distinguishing visceral and subcutaneous adipose tissue. Therefore, CT examination is a beneficial method for determination of the volume of visceral and subcutaneous adipose tissue. These measurements can be of interest themselves or in the management of obesity related disease. We anticipate that measurement of body composition by CT may also be useful in the veterinary field for other purposes, such as meat evaluation and health prognosis. Importantly, this study demonstrated that the volume of abdominal adipose tissue at the T13 level is a strong and reliable predictor of total abdominal adipose volume.


 XML Download