

 PDF
PDF ePub
ePub Citation
 Print
Print


Introduction
Melamine, 1, 3, 5-triazine-2, 4, 6-triamine (C3H6N6), is a common ingredient in fertilizers and a raw material used in the production of plastic products and melamine resin [12]. Since it has a high nitrogen content by mass, it is also added to cattle foodstuffs as a non-protein nitrogen source. Although Newton and Utely [19] pointed out that the hydrolysis of melamine in cattle was incomplete and that it could not be absorbed by ruminants, melamine has been illegally added to foodstuffs to falsely elevate the protein contents determined in assays. Additionally, pet food ingredients contaminated with melamine resulted in a major outbreak of renal disease and associated deaths in cats and dogs in the United States in 2007 [10]. In another incident, infant formula milk powders tainted with melamine caused the death of at least six infants and the hospitalization of 290,000 infants receiving therapy for kidney calculi or renal failure in China in 2008 [9]. The increasing public anxiety regarding food contamination by this potentially toxic chemical substance has made its toxicity the focus of recent investigations by toxicologists and biologists.
After the United States Environmental Protection Agency proposed removal of the "tolerance" expression from the usage guide of melamine, a test method for analyzing melamine in animal tissues was established [2]. At that time, melamine was reported to have an oral LD50 of > 3,000 mg/kg based on rat data and a dermal LD50 of > 1,000 mg/kg for rabbits [3]. Several physiological functions were also found to be disturbed by melamine and/or its derivates, such as nephrolithiasis, chronic kidney inflammation and bladder carcinoma [6,13,21]. However, there is little information available regarding the use of changes in cellular proteins to assess the toxic effects of melamine on eukaryotic cells.
In the studies reported here, an attempt was made to investigate the side effects of melamine on cells and proteins. The toxicity of melamine has been evaluated using the widely-used single cell system of Tetrahymena (T.) pyriformis, which is a ciliated unicellular protozoan that has nutritional requirements, subcellular organelles and biochemical pathways similar to those of mammalian cells [14,16]. In addition, T. pyriformis cells have been reported to have sensitivities to toxicants, and this behavior is similar to human cell cultures [5]. T. pyriformis can be easily cultivated under ambient conditions, and is characterized by a short generation time (approximately 4 to 5 h, but variable under different culture conditions), which allows accumulated toxic impacts of test substances to be studied through several generations in a short period [24]. However, previous studies using T. pyriformis to create a bioassay model for investigation of the potential toxicity of many substances have only focused on changes in its physiological state such as locomotory capacity, population growth kinetics, and morphology [4,7,18]. While these analyses have yielded useful information regarding the toxicity of analytes, they have provided limited in-depth analysis of the mechanisms behind the toxicity. We propose that certain proteins could be potential candidates for use as bioindicators of T. pyriformis cells that have been exposed to toxicants and subject to melamine-induced stress. In this study, an important analytical technique in proteomics studies, matrix-assisted laser desorption/ionization time-of-flight mass spectrometry (MALDI-TOF-MS), was employed as a valid tool for the discovery of biomarkers in the analysis of proteins [25]. This method allows determination of femtomolar amounts of peptide mixtures in a short time [8,11,26]. Although MALDI-TOF-MS technology is limited in its low reproducibility when used to identify biomarkers in the intact entire pool of cellular proteins, it may be possible to use this method to screen a multitude of proteins in a single spectrum.
This study was conducted to determine if melamine has in vitro toxic effects on eukaryotic cells that can be observed based on cellular population growth dynamics and cytomorphology, and measured based on the cellular protein expression level. We discussed the results from the cellular level based on the half maximal inhibition concentration (IC50) and cytomorphology using inverted optical microscopy and transmission electron microscopy (TEM). We then proposed a method of identifying protein biomarkers using MALDI-TOF-MS that overcame the low reproducibility of the technique to some extent. Finally, an assessment of the toxicity of melamine toward eukaryotic cells was conducted in vitro.
Materials and Methods
Chemicals and reagents
Analytically pure melamine (C3H6N6), sucrose, D-glucose, NaCl, Na2HPO4·2H2O, KH2PO4 and KCl were obtained from the Beijing Chemical Reagent Co. (China). Tryptone and yeast extract were purchased from Oxoid (UK). Analytically pure formaldehyde solution was obtained from the Shantou Xilong Chemical Factory (China). Anhydrous ethanol and HPLC grade acetone was purchased from Sinopharm Chemical Reagent (China). α-cyano-4-hydroxycinnamic acid (CHCA), trifluoroacetic acid (TFA) and formic acid solution were obtained from Sigma-Aldrich (USA). HPLC grade Acetonitrile was obtained from SK Chemicals (Korea). Osmic acid, HPLC grade acetone, uranyl acetate dehydrate puriss. p.a., lead (II) citrate tridydrate, 25% (wt.) glutaraldehyde solution, and a ProteoMass Protein MALDI-MS calibration kit were obtained from Sigma-Aldrich (USA). Epoxy resin Spurr was purchased from Electron Microscopy Science (USA). Milli-Q Academic ultrapure water (Millipore, USA) was used throughout the experiment. In addition, 0.1 mol/L phosphate buffer solution (pH 7.4) was prepared by adding 80 g NaCl, 11.5 g Na2HPO4·2H2O, 2 g KH2PO4, and 2 g KCl to 1 L of double distilled water.
Cell culture
T. pyriformis was initially grown as a pure culture at 28℃ in basic liquid culture medium containing 1% (w/v) tryptone, 0.1% (w/v) yeast extract, and 0.2% (w/v) D-glucose without shaking for 24 h in darkness.
Population growth curve and the IC50 value of melamine
A series of test culture media were prepared by adding 0.001, 0.005, 0.01, 0.05, and 0.1 g of melamine to 20 mL of basic liquid culture medium to give melamine concentrations of 0.05, 0.25, 0.5, 2.5, and 5 mg/mL, respectively. Two replicas of each test culture medium were prepared. In addition, three negative control culture media containing no melamine were prepared. All flasks were autoclaved at 103 kPa and 121℃ for 20 min.
All procedures were conducted using the upper layer of the culture solution. Briefly, 200 µL of the original T. pyriformis 24 h culture solution was added to each flask (Time T0). All cell cultures were then incubated at 28℃ in the dark without shaking. Cell counts were conducted microscopically by using an Olympus CX21 microscope (Japan) and a hemocytometer. Each time, 192 µL of cell culture solution was mixed with 8 µL of formaldehyde solution to fix the cells. At time T0, the initial cell concentration (D0) of each cell culture was 1 × 10⁴ cells/mL. Cell counts were then conducted every 4 h successively for 52 h.
A plot of log (Dx/D0) against incubation time (h) yielded linear equations that were used to evaluate the generation times of the control cell culture (GTC) and of each test cell culture (GTT). When the cell concentration doubled, i.e. Dx/D0 = 2 and log (Dx/D0) = 0.301, the GTCs and GTTs were calculated from these equations. Consequently, the relative generation time (RGT) was calculated using the ratio RGT (%) = [(GTT - GTC)/GTC] × 100. Finally, a plot of RGT (%) versus the melamine concentrations was presented as a linear regression equation, from which the IC50 value was determined when the RGT (%) was 50 [7].
The growth dynamics of the populations were evaluated by plotting the incubation time versus the Dx/D0 ratios, where Dx and D0 were the cell concentration at time T0 + x h and time T0, respectively. The populations were characterized by their generation time, which is the time required for the Dx/D0 ratio to increase from one to two [7]. The relative toxicity of the melamine is generally quantified by determining the IC50, which is the concentration required to induce a 50% increase in RGT (i.e. GTT is prolonged to 1.5 GTC). If the toxicity of melamine is concentration-dependent, the RGT values could be calculated by monadic linear regression analysis. Data are fitted to the following model: RGT (%) = a X + b [7], where X represents the IC50 value of melamine when RGT (%) is 50.
The cellular morphology at different stages of growth was observed by using an inverted microscope (IX71; Olympus, Japan).
Transmission electron microscopic observation
After 48 h of incubation, the flask containing the cell culture was shaken slightly to give a cell suspension solution. After being allowed to stand for 10 min, 5 mL of the cell suspension were removed from near the surface layer of the culture medium using a pipette and placed into a centrifuge tube. The cells were then harvested by centrifugation at 7,000 rpm for 2 min at room temperature. The supernatant was discarded immediately after the centrifugation, after which 450 µL of ultrapure water was added to the tube to disperse the aggregated cells. Next, 50 µL of 25% (w/v) glutaraldehyde solution was added to the solution, to fix the samples, and the mixture was stored at 4℃ overnight. The mixture was then centrifuged at 7,000 rpm for 2 min at 4℃, after which the supernatant was immediately discarded. Next, 500 µL of 0.1 mol/L phosphate buffer solution (pH 7.4) was added to the centrifuge tube to rinse the cells three times. The sample was then centrifuged at 7,000 rpm for 2 min at 4℃, after which the supernatant was discarded and 500 µL of 1% osmic acid solution was added. The mixture was then centrifuged at 7,000 rpm for 2 min at 4℃, after which the supernatant was discarded and 500 µL of 0.1 mol/L phosphate buffer solution (pH 7.4) was added to rinse the precipitates three times. The specimen was then harvested by centrifugation at 7,000 rpm for 2 min at 4℃. The samples were then dehydrated by gradient elution using 30%, 50%, 70%, 80%, 90% and 100% (v/v) acetone in sequence. For each concentration of acetone, 500 µL of the acetone solution was added to the precipitates and then removed after 5 min. Next, the samples were subjected to the epoxy resin coating technique. Briefly, the specimen and the liquid resin with sclerosing agent were mixed thoroughly, allowing the specimen to become embedded in the liquid mixture. The liquid resin was then allowed to harden into a transparent solid. Finally, the naturally solidified resin containing the TEM specimen was divided into ultrathin sections using the ultramicrotome (Ultracut UC6i; Leica, Germany), and then placed on the sample stage of the TEM (JEM-1230; JEOL, Japan) for observation.
MALDI-TOF-MS analysis
A new series of culture media were prepared by adding 0.005, 0.01, 0.02, 0.03, 0.04, 0.05, 0.06, 0.07, 0.08, 0.09, and 0.1 g of melamine to 20 mL of refresh basic liquid culture medium to give final concentrations of 0.25, 0.5, 1, 1.5, 2, 2.5, 3, 3.5, 4, 4.5 and 5 mg/mL, respectively. All flasks were then autoclaved at 103 kPa and 121℃ for 20 min, after which they were allowed to cool. Next, 200 µL of original T. pyriformis culture solution was added to each flask and incubated at 28℃ in the dark without shaking.
After 48 h of incubation, 10 mL of the upper layer of the cell culture solution was withdrawn from each flask and centrifuged at 7,000 rpm for 10 min at 4℃. The supernatant was then discarded, after which 30 µL of water plus 90 µL of alcohol were added. The samples were then centrifuged again at 10,000 rpm for 2 min at 4℃, after which the supernatant was discarded and 50 µL of 70% formic acid solution plus 50 µL of acetonitrile were added to the precipitate. The samples were then immediately placed at -70℃ for 30 min, after which they were subject to 10 min of ultrasonication and then placed at -70℃ again for 30 min. This freezing and thawing procedure was conducted three times.
Following centrifugation at 10,000 rpm for 2 min at 4℃, 0.5 µL of the supernatant was spotted directly onto one well of the stainless MALDI plate and allowed to air dry. Next, 0.5 µL of the matrix saturated solution was immediately added to the dried sample spot. Fresh matrix solution containing 10 mg/mL CHCA in a 50% acetonitrile/0.1% TFA water solution was prepared daily.
All MS experiments were conducted using a 4,700 Proteomics Analyzer MALDI-TOF/TOF mass spectrometer (Applied Biosystems, USA) equipped with an Nd: YAG laser (355 nm). Mass spectra were obtained in the positive ion linear mode with a 740 ns delay time at an acceleration voltage of 20 kV. The bin size was 10 ns, and the input bandwidth was 25 MHz. Each mass spectrum was the sum of 60 sub-spectra and 25 shots were averaged automatically per sub-spectrum. The instrument was externally calibrated using a standard bovine insulin solution.
Results
Effects of melamine on the T. pyriformis population growth rate
Melamine was found to have a concentration-dependent inhibitory effect on T. pyriformis. Specifically, as the melamine concentration increased, the growth of T. pyriformis was inhibited and its generation time was prolonged accordingly.
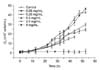
Time courses of the cell concentration (cells/mL) are shown in Fig. 1. The presence of 0.05 mg/mL of melamine in the culture medium did not have a visible effect on cell growth, whereas increasing amounts of melamine in the culture medium resulted in greater inhibition of cell growth. After 20 h of incubation, the concentrations of different test cultures began to show noticeable differences, which were used to correlate the cell concentration with melamine concentrations.
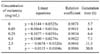
A logarithmic plot of (Dx/D0) against incubation time was used to evaluate the GTCs and GTTs by linear equations (Table 1). Based on the control culture (y = 0.1144 + 0.0325x), the GTC was determined to be 5.7 h in this study, while the test cultures had longer generation times. The presence of melamine caused a concentration-dependent decrease in population growth.
RGT (%) was then calculated from the GTC and GTTs data (Table 1). A plot of RGT (%) versus the concentrations provided the following equation, y = -13.91 + 79.184x, with a relation coefficient of 0.9645. When the RGT (%) was 50, the IC50 value of melamine was determined to be 0.82 mg/mL.
Effects of melamine on the T. pyriformis cell morphology
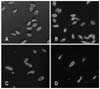
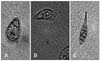
Optical microscopy revealed a normal pear-like shape of T. pyriformis (Figs. 2A and 3A). Under the experimental conditions, the T. pyriformis cell shape was not visibly influenced by the presence of 0.05 mg/mL melamine (Fig. 2B), whereas cells exposed to 0.25 mg/mL melamine showed characteristics of atrophy or deformation. An obvious decrease in cell number was also observed (Figs. 2C and 3B). T. pyriformis cells could not maintain a normal pear-like shape when the melamine concentration reached 2.5 mg/mL (Fig. 3C), and many of them were damaged (Fig. 2D).
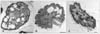
Electron microscopic imaging of T. pyriformis revealed alterations of the intracellular structure. When the cell was in a normal condition, its plasma membrane covered the entire organism and was smooth and integrated. In the cell, the cytoplasm was clear and homogeneous, and large mucocysts that were oblong in shape and contained mucoid material appeared to play a role in the endocytic uptake of nutrients (Fig. 4A). However, when T. pyriformis cells were grown in culture medium containing 0.5 mg/mL of melamine, the plasma membrane became folded, and the number of mucocysts decreased dramatically (Fig. 4B). In addition, T. pyriformis had only one spherical, polyploidy macronucleus, about 10 µm in diameter, which was covered by a nuclear membrane to form a closed region (Fig. 4A). Furthermore, the chromatin granules, which are composed of DNA and proteins, were visible as small dark particles in the macronucleus region (Fig. 4). In the presence of 0.5 mg/mL of melamine, the nucleoli of T. pyriformis cells aggregated to form denser and larger fusion bodies associated with thread-like elements (Fig. 4B). When the concentration of melamine in the culture medium reached 2.5 mg/mL, the nuclear membrane was damaged and the macronucleus region of the configuration disappeared from the T. pyriformis cells (Fig. 4C).
Effects of melamine on the T. pyriformis protein expression level
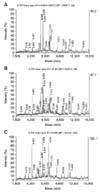
After 48 h of incubation, T. pyriformis was in the middle of its logarithmic growth phase (Fig. 1). The control culture and test cultures were analyzed simultaneously by MALDI-TOF-MS. When the concentrations of melamine in the culture medium changed, the MALDI-TOF-MS spectra of T. pyriformis differed accordingly (Figs. 5A-C), indicating that melamine influenced the protein expression of T. pyriformis cells.
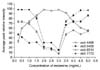
Melamine showed different effects on different proteins (Fig. 6). Initially, the relative intensity of m/z 4466 increased in response to the increasing concentrations of melamine up to 3 mg/mL, after which it decreased. This pattern of alterations in relative peak intensity was opposite in the case of the peaks at m/z 6455, m/z 6514 and m/z 7772 (Fig. 6). Taken together, these findings indicate that 3 mg/mL of melamine was a joint turning point that caused a reversal in the protein expression levels.
Discussion
To the best of our knowledge, no other studies have been conducted to examine the toxic effects of melamine in cell cultures, although clinical studies have provided evidence of the toxicity and physiological effects of melamine on animals [15,17,21,22]. Melamine has been reported to have low acute toxicity, with an oral LD50 in rats of 3,161 mg/kg [3]. The results of the present study showed that melamine also has a concentration-dependent inhibitory effect on T. pyriformis cells in vitro, with an IC50 value of 0.82 mg/mL, and that it eventually induces cytotoxicity. In the presence of melamine, T. pyriformis cells gradually became atrophic and were finally damaged in response to increasing melamine concentrations in culture media. Additionally, electron microscopy revealed alterations in the intracellular structure of T. pyriformis. Although low doses of melamine had no visible toxic effect on T. pyriformis, prolonged exposure to a low dose of melamine could be harmful to eukaryotic cells. Previous studies have shown that dose- and time-dependent exposure of cells to toxic substances can induce different cellular stress responses [23]. After a long exposure to melamine, accumulation of a low dose of this low toxic chemical substance may also influence the normal function of cells. The results of this study also demonstrate that melamine exerts a concentration-dependent toxic effect on eukaryotic cells that is accumulated over several generations. Thus, these findings demonstrate that melamine cannot be administered as a non-nitrogen source for eukaryotes.
Additionally, the simplicity, sensitivity and rapidity of this experiment as well as the low culture requirements demonstrate that T. pyriformis is an ideal model for in vitro cytotoxic bioassay [20,24], and that T. pyriformis bioassays can be used for the risk assessment of potentially toxic chemical substances.
In the present study, intact T. pyriformis proteins were harvested via repeated freezing and thawing, and proteins from different cell cultures were analyzed simultaneously by MALDI-TOF-MS. The presence of melamine in the test culture media resulted in dramatic deviations in the MALDI-TOF-MS spectra when compared with the negative control culture. Specifically, the relative intensities of the peaks corresponding to different proteins were influenced differently by the melamine. This nonspecific regulatory influence of melamine on protein expression levels indicates that its toxic effect at the physiological level may affect several cellular mechanisms.
Peaks with a high signal-to-noise ratio (S/N > 5) and a high reproducibility were selected as representative peaks. Four matched peaks, m/z 4466, m/z 6455, m/z 6514, and m/z 7772 (m/z ± 1), appeared in all of the MALDI-TOF-MS spectra. Moreover, the relative intensities of these peaks were much higher and more sensitive to the influences of melamine than that of any other peaks. Therefore, we assumed that these alterations in protein expression levels might indicate an unhealthy status of cells, such as toxicant-induced cell stress. Accordingly, the identification of bioindicators in a follow-up study may facilitate the monitoring and control of bioreaction processes.
We further assumed that these four proteins may be related to the metabolism of melamine or other toxicants in T. pyriformis. Before the concentration of melamine reaches 3 mg/mL, cell growth is only inhibited, indicating that cell metabolism may be interfered with by the presence of melamine and that the deformation of T. pyriformis cells may be caused by the irregularity of cellular protein expression levels. When the concentration of melamine increases, the accumulation of melamine in cells exceeds the normal metabolic capability of T. pyriformis, and most cells are damaged. Therefore, the alteration trends in the relative contents of these four representative MALDI-TOF-MS peaks differ before and after the turning point. As a result, these up- and/or down-regulated cellular proteins may be useful for indicating cell responses to different concentrations of melamine. However, these four low-weight proteins in T. pyriformis have not been reported previously; therefore, their actual functions in cells should also be further studied, and our understanding of the intracellular process pertaining to melamine or other toxicant induced cell stress still needs to be expanded.
In this study, the cytotoxic effects of melamine were evaluated in vitro at both the cellular level and the protein level, and proteins sensitive to the presence of melamine were identified. The results indicated that melamine influences the growth and morphology of eukaryotic cells, and that it affects the cellular protein expression levels. Future studies should focus on the identification of proteins corresponding to the most important discriminating peaks in the MALDI-TOF-MS spectra.
 XML Download