

 PDF
PDF ePub
ePub Citation
 Print
Print


Introduction
The productivity of high-yielding dairy cows has increased so that that milk yield has doubled over the past 40 years. This has increased cow susceptibility to metabolic diseases, mainly related to ketosis, fatty liver, and hypocalcemia [14]. Ketosis and fatty liver are closely linked and are responsible for severe economic losses in dairy farms due to drop in milk yield and increase in culling rates.
Clinical ketosis in dairy cows usually occurs between the second and seventh week of lactation [6]. Nevertheless, most of cows in this stage of lactation may suffer a subclinical form of ketosis defined as increased blood ketone bodies without any other symptoms but accompanied by considerable decrease in milk yield and susceptibility other diseases [6]. The prevalence of subclinical ketosis in high-yielding dairy cows in The Netherlands was estimated in 12 to 47% of the herd [12]. Such prevalence is considered to be higher during the first month of lactation compared to the second month, with a peak of occurrence at the fourth week [3].
High-yielding dairy cows suffer from negative energy balance (NEB) during the first week of lactation because of energy expenditure due to milk production and limited feed intake [12]. NEB leads to lipomobilization with a high probability of fatty infiltration into the liver. It has been calculated that the amount of fat accumulated in the liver during the first 10 days of lactation is 60 to 125 g/day, leading to fatty infiltration in up to 25% of hepatic tissue [1].
Fatty liver or hepatic lipidosis in these cows occurs when lipid uptake by the liver exceeds the capacity of lipid oxidation or secretion by this organ, which is more common during the first 4 weeks of lactation [4]. Liver lesions caused by fatty infiltration as a consequence of lipomobilization are typically observed in high producing cows during the first stage of lactation. Development of these hepatic lesions leads to a high probability of suffering from other disorders, such as ketosis, mastitis, metritis, hypocalcemia, abomasum displacement and placenta retention, in a more severe and less responsive manner [2].
Diagnosing liver lipidosis and susceptibility of ketosis in high-yielding dairy cows may include liver biopsy or ecography, but a less invasive and more economical analytical method may be the measurement of blood biochemical indicators [3]. The main blood indicators of lipomobilization in ruminants are beta-hydroxybutyrate (BHB), the most important and abundant ketone body, and non-esterified fatty acids (NEFA). The main indicators of hepatic lesions and function are enzymes aspartate transaminase (AST), gamma-glutamyl transferase (GGT), glutamate dehydrogenase (GLDH), and the metabolites glucose, cholesterol, and albumin [17]. The present study was conducted to determine the relationships between blood indicators of lipomobilization and hepatic function in high-yielding dairy cows in a region of Galicia (Spain). The purpose was to obtain parameters to help diagnose the severity of metabolic disorders related to NEB during early lactation in dairy cows.
Materials and Methods
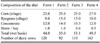
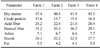
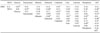
Our study was performed in the Galicia at four dairy farms under similar husbandry and feeding conditions (Table 1). The cows, all Holstein-Friesian, were high-yielding with a preceding lactation over 10,000 L of milk and also with a minimum yield of 40 L on the day of blood sampling. The cows were housed in free-stalls with sand beds, and only fed a mixed ration of similar composition (Tables 1 and 2). Clean water was available ad libitum in automatic drinking troughs. The cows were milked twice a day and the number of cows at milking varied from 92 to 163 in the different herds.
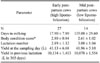
Two groups of cows were chosen according to the lactation stage (Table 3). One group consisted of early post-partum cows in the first month of lactation (n = 27), and a second group included mid post-partum cows between 3 to 5 months of lactation (n = 14). Cows in early post-partum were designated as the high lipomobilization group (risk group), and cows in mid post-partum were classified as the low lipomobilization group (control group).
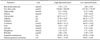
Blood samples were collected from the coccygeal vein in plain vacuum tubes after the first milking in the morning before feeding. Body condition scores were recorded by the same observer using the 1~5 scale according to Ferguson et al. [8], meaning 1 = too thin and 5 = too fat. The blood samples were kept in ice boxes and carried to the laboratory within 1 h. The samples were then centrifuged (1,000 × g for 10 min) to obtain serum, which was immediately frozen in Eppendorf tubes at -20℃ until the biochemical measurements.
The following biochemical blood components were measured by different colorimetric techniques using a spectrophotometer (Genesys; Thermo, USA): BHB and NEFA levels were measured using a kit from Randox (Ireland), AST, GGT and triglycerides were measured using kits from Spinreact (Spain), glucose, total proteins and albumin were measured using kits from Human (Germany), and urea, creatinine, bilirubin, calcium, and phosphorus were measured using a kit from RAL (Spain). Statistical analysis included performing a multivariate ANOVA of the blood metabolites using a general linear model and Pearson test for bipartial correlation. The principal effect was the stage of lactation (early vs. mid-postpartum cows) in the analysis of blood metabolites. The parity number and the body condition scores were not statistically different in the proposed model. Software SPSS for Windows (version 9.0; SPSS, USA) was used to perform the statistical analysis.
Results
Results of the serum biochemical analyses for both groups of cows are shown in Table 4. Indicators of lipomobilization, i.e., NEFA and BHB, were higher in early lactation cows (high lipomobilization) compared to mid lactation cows (low lipomobilization). No statistical difference was found between the mean values of BHB for both groups of cows (Table 4). However, if only the cows in both groups with serum BHB values above 1.2 mmol/L were considered, the mean value of the high lipomobilization group (early lactation) was higher than those for the low lipomobilization group or control group (2.66 mmol/L vs. 1.43 mmol/L). Cows with these BHB values included 11 animals in the early lactation stage (41%) and four in the mid lactation stage (28%).
Activities of serum AST and GGT were similar in both groups of cows. Although the mean AST value of early lactation cows was higher than that of the mid lactation group, no significant difference was observed between the two groups of cows. The mean triglyceride values in the high lipomobilization group were less than those of the low lipomobilization group, but no significant differences was found between the two groups of cows. Serum concentrations of glucose, total proteins, albumin, and urea of the early lactation cows were significantly lower (p < 0.05) than those of the mid lactation cows.
Table 5 shows the correlation coefficients among the biochemical parameters calculated for all cows in this experiment. Significantly negative correlations (p <0.01) were observed between BHB and glucose, NEFA and total proteins, NEFA and globulins, NEFA and AST, glucose and creatinine, total protein and AST, and globulins and AST. Significantly positive correlations (p <0.01) were observed between total protein and albumin, albumin and phosphorus, and urea and phosphorus.
Discussion
The present work compared the metabolic conditions of high-yielding dairy cows during early lactation and mid lactation stages. Clearly, early lactation cows had high lipomobilization whereas cows in the mid lactation stage had low lipomobilization. In early lactation animals, NEFA values were more than twice those of mid lactation cows (p < 0.01), whereas BHB values exceeded the threshold of 1.2 mmol/L considered normal for non-ketotic cows [7].
The NEFA values in high yielding dairy cows with low lipomobilization may be up to 250 µmol/L when energy balance is stabilized during lactation [9]. There are few works on the threshold of serum NEFA levels which identifies high lipomobilization in dairy cows, but Oetzel [13] noted that NEFA concentration > 400 µmol/L indicate problems with energy balance and subsequent intensive lipomobilization. According to this report, 18 out of 27 early lactating cows (67%) and one out of 14 mid lactating cows (7%) presented evidence of high lipomobilization (NEFA > 400 µmol/L) in the present study. Considering that concentrations of serum NEFA > 700 µmol/L are associated with ketosis [13], five early lactating cows (18.5%) and only one mid lactating cow (7%) in the present study had NEFA concentrations above the value indicative of subclinical ketosis. Subclinical ketosis also may be diagnosed when serum BHB concentrations are above 1.2 mmol/L, while clinical ketosis is associated with BHB concentrations above 2.6 mmol/L [13]. In the present work, 11 early lactation cows (41%) and four mid lactation cows (28%) had serum BHB concentrations above 1.2 mmol/L.
These data suggest that serum NEFA could be less efficient indicators of subclinical ketosis (18.5%) than serum BHB (41%) in high yielding dairy cows during the early lactation period. This is in agreement with Duffield [7] who stated that the use of NEFA is a better indicator of energy imbalance in prepartum animals than BHB, but BHB is more useful postpartum. This fact may explain the low coefficient correlation (r = 0.11) founded between BHB and NEFA. In other words, high lipomobilization (high NEFA values) does not necessarily mean that the cow has subclinical ketosis. On the other hand, cows exhibiting low lipomobilization (normal NEFA values) may have ketonemia associated with subclinical ketosis (28% in the present work). Therefore, the data presented here show that serum NEFA may be used for detecting high lipomobilization but not subclinical ketosis. Additionally, the relationship between BHB and NEB may be inferred by the significant correlation between BHB and glucose values (r = -0.63).
According to the serum parameters, ketosis in cows may be diagnosed when the following values match the clinical signs: BHB > 1.2 mmol/L, glucose < 2.5 mmol/L, and triglycerides < 0.12 mmol/L [11]. Taking this criterion into account, six cows in early lactation (22%) and no cows in mid lactation had the indicative values but did not display any clinical signs, which means that they had a typical subclinical condition.
Đoković et al. [5] showed that the concentration of serum triglycerides is significantly lower (p < 0.01) in ketotic cows compared to healthy cows. These authors hypothesized that triglycerides accumulate in the liver cells of ketotic cows and cause their circulating values to decrease. The present work showed 14 cows with high lipomobilization (52%) and six cows with low lipomobilization (43%) that had triglycerides concentration less than 0.12 mmol/L. In addition, no significant correlation was found between triglycerides and NEFA or BHB, which means that triglyceride values may not be considered as an adequate indicator for lipomobilization. However, all cows suffering from subclinical ketosis according to the criterion cited above [11] and 61% of the cows with high lipomobilization (NEFA > 400 µmol/L) had triglyceride values less than 0.1 mmol/L.
Hepatic lipidosis is generally preceded by an increase in the concentration of ketone bodies in serum and urine. During the first month of lactation, 5 to 10% of high-yielding dairy cows suffer severe hepatic lipidosis and 30 to 40% have mild hepatic lipidosis [4]. This means that nearly 50% of those cows are at risk for metabolic disorders. When fat infiltrates the liver, a lesion appears in the hepatic tissues and the levels of enzymes that indicate liver injury (AST, GGT, and GLDH) are generally augmented [4]. The values of AST in the present study (maximum of 184.5 U/L) were higher than those of Jersey cows (maximum of 50 U/L) in Brazil [10]. Also, mean GGT values in our study (30 U/L) were higher than those obtained in early lactation Holstein cows in Croatia (19 U/L) [15]. These authors found that the highest measured value of AST was 84.97 U/L among 120 Holstein cows, which is lower than the maximum value obtained in our work. If AST activity higher than 100 U/L is indicative of hepatic lesions, 8 out of 27 early lactation cows (29.6%) in our study suffered some degree of hepatic lesions, probably due to fat infiltration. These animals included five out of six cows considered to be ketotic according to our criteria, and had a mean AST value of 137.4 U/L. Meanwhile, only 1 out of 14 mid lactation cows (7%) had AST values higher than 100 U/L. A negative correlation between AST activity and lipomobilization (NEFA values) was observed by the significant coefficient (r = -0.46). In the present study, all data concerning liver enzymes suggested that the process of lipomobilization was enough to cause liver lesions in one-third of the early lactating cows. We also found that AST is more sensitive than GGT for detecting hepatic lesions.
Fat infiltration into the liver may also affect the concentration of some blood components. Glucose levels may be diminished as well as concentrations of total proteins, albumin, and urea [16]. In the present work, glycemia and the serum concentrations of total proteins, albumin, and urea in early lactation cows were significantly lower than those of the mid lactation cows. The serum levels of glucose, proteins and urea are indicators of hepatic functionality [4] and decreases in their concentration may reflect fat infiltration in animals with high lipomobilization. In fact, significant correlation of NEFA values was observed between total proteins (r = -0.55) and urea (r = -0.34). Possible alterations in liver function may have deleterious effects on the metabolism of these animals, and impact milk production or reproduction.
In conclusion, we found that BHB levels are more sensitive for detecting subclinical stages of ketosis than NEFA in high-yielding dairy cows with a high degree of lipomobilization. Additionally, high lipomobilization negatively impacts liver functions but does not imply that ketosis might be present. Although triglycerides levels do not have value as indicators of lipomobilization, serum values bellow 0.1 mmol/L could be associated to ketosis. AST values are more sensitive than GGT as indicators of hepatic lipidosis in early lactation cows.
 XML Download