

 PDF
PDF ePub
ePub Citation
 Print
Print


Introduction
Intervertebral disc disease is a degenerative condition of unknown cause that results in herniation of the disc or disc material into the vertebral canal, compressing the spinal cord or spinal nerve roots [7]. Diagnostic imaging modalities for intervertebral disc disease include survey radiography, myelography, computed tomography (CT), and magnetic resonance imaging (MRI). One study has shown that a correct diagnosis of acute intervertebral disc prolapse (Hansen type I) may be made from survey radiographs in 69 to 72% of dogs [8]. However, false positive and false negative results are common [9]. Though the main roles of survey radiography are to help rule out differential diagnoses and to confirm anatomical landmarks, either myelography or advanced imaging should be performed for definitive diagnosis [15]. Since the development of non-ionic, water soluble, iodinated contrast media, myelography has been the standard diagnostic method for intervertebral disc disease [11]. Although the accuracy of myelography in one canine study was 86 to 97%, this diagnostic modality is invasive with the potential to cause side effects such as seizures and exacerbation of neurological signs [11].
Computed Tomography provides more accurate information and takes less time than myelography, particularly in chondrodystrophoid breeds, and is usually much easier to decide which side the disc material is located on from CT images than from myelograms [15]. In one study, the accuracy of CT and myelographies in diagnosing acute intervertebral disc disease was compared in 20 dogs. CT and myelography was found to be 90 and 88% accurate, respectively, at identifying the major site of disc herniation. Lateralization of disc material was correctly predicted in 96% of dogs with CT and in 92% of dogs with myelography [3].
MRI also provides transverse imaging and is superior to CT when the disc material is not mineralized. If the extruded material is not mineralized, contrast medium may be necessary [15]. Obviously the use of CT with subarachnoid contrast medium invalidates the potential advantage of diagnosing disc herniation without the side effects associated with myelography [11]. However, intervertebral disc herniation, especially in chondrodytrophoid breeds, usually occurs after the nucleus pulposus has become mineralized [6]. Therefore, mineralized intervertebral disc material in the vertebral canal can be detected clearly using CT without the subarachnoid injection of contrast medium [11].
The aim of this study was to describe the computed tomographic characteristics of the acute thoracolumbar intervertebral disc diseases and to pursue any exploitable relationships between clinical parameters and CT imaging characteristics.
Materials and Methods
Patient criteria
Medical records of dogs admitted to the Seoul National University Hospital for Animals and received computed tomography of the spine between May 2003 and June 2005 were reviewed. Case records included information such as signalment, history, neurological examination and treatment including medical management, decompressive surgery and alternative therapy. Of all cases, the cases in which thoracolumbar intervertebral disc disease was confirmed by CT were selected. There were 55 cases. Six of 55 cases had myelographies performed prior to CT scanning, and 9 of 55 cases had insufficient information such as the result of neurological examination. Those 15 cases were excluded from this study. Therefore. 40 cases of dogs were analyzed for the study. Decompressive surgery was performed in 18 of 40 cases, and it was investigated whether they had concurrent epidural hemorrhages.
Neurological examinations
Neurological examination was performed by neurologists according to the modified Tarlov scale [16] for better fitting the patients in the present study, and the patients were classified as grades I to IV. Grade I was the patients with only pain, grade II was the patients with paraparesis and loss of proprioception, grade III was the patients with paralysis and loss of superficial pain, and grade IV was the patients with loss of deep pain.
CT examination
Scans were performed using a CT scanner (GE CT/e; General Electric Medical System, Japan) under general anesthesia. Initially, scout lateral and ventrodorsal views were obtained. After intravenous injection of non-ionic iodine contrast media (Omnipaque 300 mgI; Amersham Health, Ireland), helical scanning was performed at a 3 mm slice thickness, 3 mm image interval, 120 kVp and 100 mA. Thereafter, axial scanning at the intervertebral space level was performed at a 1 mm slice thickness, 1 mm image interval, 120 kVp, 100 mA, and the gantry was appropriately angled so that the image plane was parallel to the intervertebral disc spaces.
Criteria for image evaluation
Attenuation of the normal spinal cord
The degree of attenuation of the normal spinal cord was measured in Housefield units (HU) in at least 5 images in each dog that were at least 6 images (6 mm) distant from the herniated lesion. A slightly smaller region of interest (ROI) than the cross sectional area of the spinal cord was chosen and the same ROI used in each image for that dog [12].
Distribution pattern of disc herniation
Disc herniation was classified as single, continuous, and multiple patterns. Single was disc herniation at only one intervertebral disc space. Continuous was disc herniation at more than two adjacent intervertebral disc spaces. Multiple patterns was disc herniation at more than two sites, each herniation was also able to be single or continuous pattern of disc herniation.
Location of disc herniation
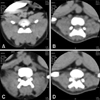
Each herniation was described as either ventral, lateral (left, right) or dorsal. A herniation was regarded as ventral when the apex of the herniated disc material was localized in the ventral region of the spinal cord, as lateral when the apex was close to the lateral recess, and as dorsal when the herniated disc material was in the dorsal part of the spinal cord (Fig. 1).
The size of disc herniation
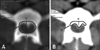
The size of the disc herniation in relation to the size of the spinal canal was calculated by two different methods; A-index and H-index [17]. A-index was the ratio of the area of herniated disc material to the spinal canal. H-index was the ratio of the height of herniated disc material to the spinal canal. The area and height of spinal canal were measured with a vertebra window (a window width of 2,000 and a window level of 350 HU). The area and height of herniated disc material were measured with a spine window (a window width of 400 and a window level of 40 HU). The height of herniated disc material was measured at the apex of the disc material, parallel to the line of the height of the spinal canal (Fig. 2). Measurements were performed in every transverse image in which the herniated disc material was shown. Each case was represented by three different values of each index such as a top value, average of top three values and average of top five values. A top value means the highest value of the index, average of top three values the average of the highest three values of the index, and average of top five values the average of the highest five values of the index in each case.
Attenuation of herniated disc material
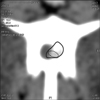
The attenuation of herniated disc material was measured at two regions. One was the total herniated disc area at the transverse image and the other was the region which was not mineralized in the herniated disc material. The attenuation of the non-mineralized area of the herniated disc material was measured with a ROI that was as large as possible in the non-mineralized region of herniated disc material (Fig. 3).
Statistical analysis
Statistical analysis was performed to confirm the correlation of clinical grade with A-index and H-index, and the difference of the attenuation of herniated disc material with epidural hemorrhage or not. The correlations between grades and those indexes were evaluated by the Pearson correlation analysis. The significant indifferences among each data were also determined with one way ANOVA and independent t-test using SPSS (SPSS for Windows Release 12.0.0; SPSS, USA). A p-value of < 0.05 was considered to be statistically significant.
Results
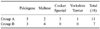
Breed distribution
Six pure breeds and two mixed-breed dogs were represented in the 40 cases of acute thoracolumbar intervertebral disc disease. Pekingese predominated (17 cases, 42.5%), followed by Maltese (8 cases, 20.0%), Cocker Spaniels (5 cases, 12.5%), Shihtzu (3 cases, 7.5%), Dachshunds (2 cases, 5.0%), Yorkshire Terriers (2 cases, 5.0%), mixed-breeds (2 cases, 5.0%), and Poodle (1 case, 2.5%).
Neurological examination
By the modified Tarlov grading scale, 5 cases were grade I, 6 cases were grade II, 13 cases were grade III, and 16 cases were grade IV.
Attenuation of normal spinal cord
The normal spinal cord was characterized by intermediate attenuation of the transverse image (mean attenuation: 23.4 ± 11.8 HU; range: -0.6~59.3 HU).
Site of disc herniation
The T13-L1 intervertebral disc space was found to be the most commonly affected main lesion(12cases, 30%). The second most commonly affected main lesion was at the T12-T13 intervertebral disc space (9 cases, 23%), followed by L1-2 (7 cases, 18%), T11-12 (6 cases, 15%), L4-5 (2 cases, 5%), L5-6 (2 cases, 5%), L2-3 (1 case, 3%), and L3-4 (1 case, 3%). A main lesion was defined by the most herniated disc space of all herniated disc spaces in each dog.
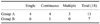
Distribution pattern of disc herniation
There were 18 cases of single pattern of disc herniation, 11 cases of continuous pattern of disc herniation, and 11 cases of multiple pattern of disc herniation (Table 1). In all, 85 disc spaces were affected. The number of single patterns in all affected disc spaces was 41 disc spaces and the remaining 44 were continuous patterns. All of T9-T10 intervertebral disc spaces were continuous patterns (Table 2).
Location of disc herniation
There were 75 ventral, 8 lateral and 2 dorsal locations of disc herniations. In the 8 lateral disc herniations, 6 were left sides and 2 were right. The dorsal locations of disc herniations were the extension from left side to dorsal portion of the spinal cord (Table 3).
Size of disc herniation
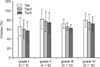
A-index
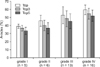
A significant correlation existed between each different sampling method and an animal's grade (p < 0.01). A higher grade was associated with a significantly higher index for three different sampling methods (top, average of top 3 and average of top 5) (Fig. 4). Each A-index of top with each grade was 39.22 ± 2.68 in Grade I, 46.04 ± 6.88 in Grade II, 52.88 ± 10.73 in Grade III, and 59.54 ± 5.92 in Grade IV. In Pearson correlation analysis, coefficients of correlation of three different sampling methods were slightly different, and a coefficient of correlation of the top 5 was slightly higher than the others (A-index of top: 0.684, A-index of top 3: 0.670, A-index of top 5: 0.690). Each A-index of top 5 with grade was 33.38 ± 4.37 in Grade I, 36.59 ± 6.86 in Grade II, 45.30 ± 9.04 in Grade III, and 52.10 ± 6.93 in Grade IV.
Epidural hemorrhage
The dogs with acute thoracolumbar intervertebral disc disease were treated by medical, surgical or alternative methods. Decompressive surgery was performed in 18 cases. These 18 cases were classified as group A and group B. Group A was the dogs with concurrent epidural hemorrhage, and group B was the dogs without concurrent epidural hemorrhage (Table 4).
There were 4 continuous pattern herniation cases in group A and 1 case of continuous pattern herniation in group B. The one case in group B had only 2 adjacent intervertebral disc spaces affected, but the 4 continuous pattern cases, one of which being also a multiple pattern, in group A had more than three continuous intervertebral disc spaces affected (Table 5).
Group A and B were compared by the degree of attenuation of herniated disc material. The HU value of herniated disc material was measured at two different areas; the total herniated disc area and the non-mineralized disc region. There were significant differences in HU values between groups by either method (p < 0.05). Each HU value of herniated disc materials of the total area was 185 ± 85 in group A and 238 ± 103 in group B. And each HU value of the non-mineralized region was 88 ± 26 in group A and 120 ± 24 in group B.
Discussion
The herniation type of intervertebral discs are divided into Hansen types I and II. Type I is more common in chondrodystropic breeds such as the Dachshund and the disc extrusion often results in more severe symptoms than type II. The nucleus pulposus of a chondroid disc is often extruded in an acute or subacute fashion [10]. In this study, all of the dogs which were affected acute thoracolumbar intervertebral disc disease were chondrodystrophic breeds except for two mixed-breeds. Distribution of the 645 cases of intervertebral disc disease by breed, sex, and anatomic site of involvement was studied. More than 53% of the cases were Dachshunds and the other breeds most often represented were Cocker Spaniel, Beagle, and Pekingese in order of decreasing frequency [5]. In this study, Pekingese was represented most frequently, and less for the Maltese, Cocker Spaniel, Shihtzu, Dachshund, in that order. Dachshunds were represented in only 5% of cases. It is thought to be due to possible regional breed population characteristics, although the contributing cause is not clear.
The normal spinal cord had intermediate attenuation on transverse images (mean attenuation: 31.3 ± 8.6 HU; range: 4~55) [11]. In this study, the normal spinal cord had a slightly high mean attenuation, but similar to the range of attenuation (mean attenuation: 23.4 ± 11.8 HU; range: -0.6 ~59.3 HU). There have been reports of identification of the cord and the level of the conus with CT by measuring the spinal canal HU. This value will be helpful to identify the spinal cord when the spinal cord exists with the herniated disc materials. But there were some limitations. In individual patients, HU values often varied randomly and it was impossible to obtain a reading reliable enough to predict the level of the conus. More problematic were the artifacts from the intermittent bony ring of the spinal canal that contains the cord and an unpredictable amount of other bone and gas from the surrounding body. The patient's respiration and other motions add to the artifacts [13].
In thoracolumbar disc disease, over 50% of lesions occur at the T12-T13 and T13-L1 discs, and more than 85% occur between T11-T12 and L2-L3, with the disc extrusion occurs occasionally as far cranial as T9-T10 [15]. The intercapital ligaments are short, transverse fibrous bands that lie ventral to the dorsal longitudinal ligament, joining the rib heads between T2 and T11, and these ligaments buttress the dorsal part of the annulus cranial to T11 and help resist dorsal disc protrusion [18]. In this study, the T13-L1 disc was the most common site of thoracolumbar disc disease, with 53% of lesions occurring at the T12-T13 and T13-L1 discs, and 87% occuring between T11-T12 and L2-3. In dogs, the mobility of the vertebral column is especially large in the thoracolumbar junction, and intervertebral disc disease is recorded most frequently at the most mobile region of the vertebral column in all animals [2]. It is considered that this is why the most common site of disc herniation is the thoracolumbar junction as with the results of the present study.
In the distribution pattern for each breed, the Maltese showed a tendency to have more single pattern disc herniation than other patterns. In the distribution patterns of all affected disc spaces, continuous pattern was more frequent at the thoracic than lumbar spine. There were two continuous patterns of disc herniation at T9-T10 in all affected disc spaces. In both of the cases, there was herniated disc material extended up to 4 intervertebral disc spaces. One of 2 cases had decompressive surgery, epidural hemorrhage was observed at surgery. It is considered that the disc material at T9-T10 extended from the caudal disc space with epidural hemorrhage. In all affected disc spaces, the T12-T13 and T13-L1 disc spaces were also common sites of disc herniation.
Spinal CT scan effectively shows a medial and lateral disc herniation. In localizing the exact level of the intervertebral disc, CT has advantages over myelography [14]. In our study, 75 (88.2%) of 85 disc spaces were ventrally located, the highest rate. And 2 (2.4%) of 85 disc spaces were had dorsally located disc herniation. Both of these cases had surgery and identified the concurrent epidural hemorrhage. In the lateral location of disc herniation, the left side was more frequent than right in all affected disc spaces. But left sides occurred at 3 cases and right sides at 2 cases. So there was no significant difference in the incidence of left and right sides.
Clinical signs of intervertebral disc disease vary from only spinal hyperesthesia to paraplegia with or without pain perception [3]. Spinal cord compression by herniated discs causes a closed type of injury that alters cord function and structure [18]. The severity of signs depends on the velocity at which the compressive force is applied, the degree of compression, the duration of compression, and the ratio of spinal cord diameter to vertebral canal diameter [12]. In humans, the size of the disc herniation in relation to the size of the spinal canal provided the best positive correlation to the clinical findings [17]. There was also a significant positive correlation between the improvement from sciatic pain and the reduction in the size of the individual hernia [4]. In this study, two different methods to measure the size of herniated disc were used. A-index was significant correlated with the clinical grade. Particularly, average of top 5 was slightly more correlated. It could be the reason why some cases of disc herniation were the multiple or continuous patterns.
In humans, measuring the absolute area of the herniation and the spinal to canal is technically demanding, time consuming, and therefore still not suitable for routine use in clinical practice. A simplified way to describe the area of the spinal canal that is occupied by the hernia would be to measure the linear relationship between the size of the disc hernia and that of the spinal canal. The sagittal diameter of the canal and the herniation gave a less precise description of the relative size and morphologic characteristics of a lumbar disc hernia, but the ratio of sagittal diameter correlated more strongly to the degree of sciatic pain than the other two different ratios, which were calculated by area or two perpendicular lines [17]. But in this study, the ratio of sagittal diameter, which was the H-index, was not correlated with clinical grade. The possible contributing causes for this difference may include the variability and severity of clinical signs as well as the location.
Type I disc extrusion is often associated with rupture of the vertebral sinuses and hemorrhage into the epidural space, which can exacerbate spinal cord compression [1]. CT can identify acute hemorrhage in the vertebral canal. The appearance of CT images suggests that epidural hemorrhage can extend over a number of vertebrae to each side of the disc herniation. The herniated material was distinguishable from the spinal cord, but was only slightly more attenuating than the spinal cord (mean attenuation: 59 ± 17 HU; range: 38~98 HU), and extended over distances of up to five vertebrae [11]. In this study, the herniated material with concurrent epidural hemorrhage was extended over distances of up to three vertebrae (4 cases of continuous pattern and 1 case of multiple pattern of disc herniation), and was slightly more attenuating than the spinal cord, which was measured at a non-mineralized region (mean attenuation: 86 ± 26 HU; range: 32~149 HU). Two of three cases with dorsal location of disc material had confirmed epidural hemorrhage at surgery. The epidural hemorrhage could be predicted by the distribution pattern, location and attenuation of herniated disc materials. Although there were statistically significant differences between two groups when measured by two other methods, the measurement of herniated disc material at the non-mineralized region is thought to be more useful than at the total area due to the narrow range of mean HU value.
In chondrodytrophoid breeds, herniated disc materials were usually mineralized and were able to be described by CT. In conclusion, the area ratio of the herniated disc material to spinal canal could be calculated, which was correlated with clinical grade. And the HU value of the herniated disc material was also able to be measured. The HU value of the group with concurrent epidural hemorrhage was lower than the group without concurrent epidural hemorrhage. Therefore, it was considered that CT characteristics such as area ratio, HU value, distribution pattern, and location could be helpful for the accurate evaluation and prediction of the status of the patient with intervertebral disc disease.


 XML Download