

 PDF
PDF ePub
ePub Citation
 Print
Print


Introduction
The body condition score (BCS) system is a subjective method to assess the body fat reserves of farm animals, particularly over the bony prominences like back and pelvic region. It gives an immediate appraisal of the body state of the animal and is readily incorporated into operational decision making. This BSC system is an universally accepted, non-invasive, quick and inexpensive method to estimate the degree of fatness [3,7]. It helps to evaluate the status of dairy herds nutrition programme, identify lactating cows problems such as ketosis, thin cow syndrome, etc. It mainly helps to forecast the cows performance, aids in improving the management of body fat reserves for better health, production and reproduction performance of dairy cows [3,5].
The ideal body reserves for pregnant, lactating and non-lactating farm animals allow them to attain maximum milk production with minimum metabolic disorders. Body weight alone is not a good indicator of body reserves. The visual and tactile appraisal of animal condition provides a good assessment of body fat reserves minimizing the influence of frame sizes and intestinal contents. As body condition is the reflections of the fat reserves carried by the animal the ability to estimate the body condition accurately an relate it to production of the animal would help the farmers to increase the overall efficiency of feeding and management of farm animals. Keeping this in view, during the last three decades the traditional and subjective appraisal of the body reserves in farm animals made by eye and touch, has been rationalized by the introduction of numerical systems of rating specific anatomical points. Thus the BCS systems were developed using 0 to 5 scale in ewes [14] and an 8 grade system in dairy cows [8]. A body condition scoring chart in a 1 to 5 scale using 0.25 increments was developed for Holstein dairy cows [9]. This chart was utilized for scoring the crossbred dairy cows by sight and palpation [1,22].
Various studies on the precision of BCS system, including the ultrasonic assessment of subcutaneous fat, indicated that BCS values were closely related to the actual measurement of subcutaneous fat [6,16,29].
India has the largest buffalo population of the world and their numbers are continuously rising [21]. Buffalo occupies an important place in the dairy industry of India and is the main milk producer of the country. Milk yield of an average indigenous buffalo is nearly 3 times that of an average indigenous cow. In order to derive the maximum potential from native buffaloes, a body condition scoring system would be useful in evaluating their fitness to understand the present status of them and accordingly suggest the feeding and management practices. There was no scale developed specifically for buffaloes and few studies were done on buffaloes. The BCS systems developed for dairy cows could not be apt for scoring buffaloes because of the structural and functional differences between the two species. Hence, in the present study a new BCS system was developed for Murrah buffaloes by studying in detail the anatomical features and also the actual amount of fat reserves which help in the assessment of body condition scores and the BCS system developed was validated through ultrasonographic measurements of fat reserves.
Materials and Methods
Identification of the skeletal check points
Skeletal check points were identified in consideration of the anatomical features and amount of fat reserves at various skeletal check points in 50 slaughtered Murrah and Graded Murrah female buffaloes 5~10 years of age at Municipal slaughter house (Kabela), Tadepalligudem, West-Godavari Dist. A.P. India. The anatomical differences between cows and buffalos in the selection of skeletal check points were recorded by studying the cow and buffalo skeletons in the museum at the Department of Anatomy, College of Veterinary Science, Tirupati and also the pelvic measurements from previous studies in the buffalo [17] and crossbred cow [18]. The observations were utilized to study the anatomical features in 50 slaughtered buffaloes. The amount of fat reserves were measured in the same slaughtered buffaloes at six skeletal checkpoints which included points between the 12th and 13th ribs, spinous and transverse processes of the lumbar vertebrae, sacral crest and tuber sacrale, sacral crest and tuber coxae (hook), hooks and tuber ischii (pin), and between the tail head and pins. Based on the amount of fat reserves at the check points the scores were assigned on a 1 to 5 scale of the new BCS system.
Preparation of a preliminary BCS chart
Initially, a score chart for assessing the body condition of buffaloes was prepared using a 5 point scale in 0.25 increments after reviewing the procedures currently used for scoring dairy cows [8,9,28]. The chart was used to examine 10 skeletal check points. Based on the amount of fat reserves and the scores assigned the priority of the skeletal check points were decided and were kept in order in the preliminary BCS chart as shown below; 1. tail head to pin, 2. spinous processes of the lumbar vertebrae, 3. depression between the spinous and transverse processes, 4. transverse processes of lumbar vertebrae, 5. spinous process of the thoracic vertebrae, 6. between 12th and 13th ribs, 7. sacral crest, 8. depression between sacral crest and tuber sacrale, 9. depression between sacral crest and hook, 10. depression between the hooks and pins.
After each check point was observed thoroughly by sight and palpation, the scores were recorded and an average BCS was assigned to the buffaloes.
Scoring using preliminary BCS chart to prepare valid new BCS chart
Two hundred Murrah and Graded Murrah female buffaloes, 4~10 years in age and in 1~5 lactations maintained at Buffalo Research Station, Venkataramannagudem, West-Godavari Dist. were scored using a preliminary BCS chart. Each point was keenly observed by sight and palpation, and then a score was assigned by the researcher. It was noticed that there was no difference in the scores assigned at the 2nd and 5th check points viz., spinous process of lumbar and thoracic vertebrae, respectively, as well as at the 8th and 9th check points viz., the depression between sacral crest and tuber sacrale and the depression between sacral crest and hooks, respectively, as the amount of fat reserves observed were the same in all the animals examined.
Preparation of valid and new BCS chart
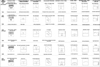
The new chart for scoring on a 1 to 5 scale at 0.5 increments, functioning as a 9 point scale, was prepared. Diagrams were added to the text to convey the gradation of body changes and reduce the dependence on written descriptions (Fig. 1). Eight skeletal checkpoints were examined by using the chart to indicate the body condition. The eight locations observed were: 1. tail head to pin, 2. spinous processes of the lumbar vertebrae, 3. depression between the spinous and transverse processes, 4. transverse processes of lumbar vertebrae, 5. point between 12th and 13th ribs, 6. sacral crest, 7. depression between sacral crest and pins, 8. depression between hooks and pins.
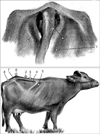
After each check point was observed by sight and palpation, the scores were recorded and the average BCS was assigned to the same herd of 200 buffaloes. A Murrah buffalo showing the skeletal check points for BCS is presented in Fig. 2.
BCS of buffalo herd
The herd of two hundred buffaloes scored by using 0.25 increments was rescored using the new BCS chart without referring to the previously assigned scores to determine the accuracy. The scores assigned for the same herd of buffaloes by the faculty members of the department who had expertise in body condition scoring were also compared. The scores assigned by faculty members coincided with the scores of researcher and so the method of score assigning by researcher using the new score system was standardized.
Validation of the new BCS system
The precision of the new body condition score system was tested in 10 buffaloes for each point [1-5] of the scale by ultrasonographic measurements of body fat reserves. The BCS and ultrasonographic measurements were obtained independently for the same buffaloes on the same day. An ultrasound machine (LOGIQ α-100; GE Medical Systems, Canada) with a 5.5 MHz convex transducer was used to determine the amount of subcutaneous fat at five body locations through a coupling gel on each buffalo [4]. Body locations were selected based on the skeletal check points used for body condition scoring and ease of obtaining and reading ultrasonographic measurements.
The first location was the area between the tail head and pin bones and the second location was the lumbar area. The transducer was oriented parallel to the midline, midway between the spinous and transverse processes. The third location was the area between the 12th and 13th ribs. The fourth was the area between the sacral crest and hooks. The fifth area was located midway between hooks and pins above the greater trochanter of the femur. Measurements were obtained by freezing the image on the screen of the ultrasound machine and then measuring the layer of subcutaneous fat in the centre of the screen [6].
Statistical analysis
Analysis of variance (ANOVA) was used to study the variations in the carcass fat thickness at various skeletal check points, the variations in ultrasonographic fat reserves with BCS and among different BCS groups, and to compare the scores assigned with carcass fat reserves. Correlation coefficients were used to study the relationship between the scores of various check points, relationships between the body condition scores assessed by either 0.25 or 0.5 increments in a 1 to 5 scale, relationship among BCS, carcass fat and ultrasonographic fat reserves. The values were found to be significant only at 0.01 level. Hence, the significance was mentioned at 0.01. All the statistical procedures were performed according to the standard methods and formulae [25].
Results
Development of the new BCS system
The anatomical differences studied between buffalo and cattle skeletons showed that the spinous processes of lumbar vertebrae were narrow and pointed at the ends in buffalo, but wide and blunt at the ends in cattle. The tips of lumbar transverse processes were narrow and pointed in buffalo and broad in cattle while the ribs were more curved in the buffalo and less in cattle. The pelvic measurements of the between tuber sacrale, between hooks and tuber sacrale, between pins distance and the height of pelvic outlet were greater in buffalo (10.8 cm, 24.9 cm, 30 cm and 31.5 cm, respectively) compared to cattle (7.5 cm, 20 cm, 24 cm and 25 cm, respectively), whereas the length of dorsal sacral crest and between hooks and pins distance were less in buffalo (30 cm and 42 cm) when compared to that of cattle (35 cm and 46 cm). From these findings, the anatomical structures helpful in the identification of skeletal check points in buffaloes were identified and were examined in slaughtered buffaloes. The results showed that the spinous processes of thoracic vertebrae and the spinous and transverse processes of lumbar vertebrae are narrow and pointed at the ends. This feature enabled us to assess the fat reserves easily by vision and palpation on live animals. The ribs are more curved, which gives clarity to examine the area between the ribs. The 12-13th intercostal space was easy to examine as the 13th rib is at the border of the thoracic and lumbar regions. The convexity of the dorsal crest and the sharp bony prominences of the hooks and pins help in the examination of fat cover in the pelvic area.
The fat thickness in 50 slaughtered buffaloes measured at six skeletal check points viz., between 12th and 13th ribs, lumbar area, between sacral crest and tuber sacrale, between sacral crest and hooks, between hooks and pins and between tail head and pins were 4.19 ± 0.27, 4.43 ± 0.28, 3.56 ± 0.24, 3.56 ± 0.23, 3.22 ± 0.19 and 6.28 ± 0.37 mm, respectively. Significant differences were observed in the fat thickness among various check points (p < 0.01). The mean fat thickness at tail head to pins was significantly (p < 0.01) higher than those of other skeletal check points (Table 1).
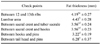
The scores were assigned on a 1 to 5 scale based on the amount of fat reserves at skeletal check points in slaughtered buffaloes (Table 2). The values of carcass fat thickness at individual skeletal check points and the mean of all the 6 check points were calculated for the five scores (Table 3). There were significant (p < 0.01) differences in the carcass fat thickness among the five scores at all the individual check points as well as the mean of the 6 check points indicating that the scale was internally consistent.
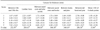
The BCS was assessed in two hundred buffaloes following the preliminary chart on a 1 to 5 scale at 0.25 increments, examining 10 skeletal check points. The mean scores at the skeletal check points 1, 2, 3, 4, 5, 6, 7, 8, 9 and 10 were 3.51, 3.38, 3.31, 3.26, 3.38, 3.28, 3.22, 3.26, 3.26 and 3.24, respectively. The mean BCS of the herd was 3.31. Correlation coefficients for all the mean scores among the 10 skeletal check points showed that the correlation was significant (p < 0.01) for all the points, whereas the score at the spinous processes of thoracic and lumbar vertebrae (2nd and 5th check points) and the score at the sacral crest to tuber sacrale and sacral crest to hooks (8th and 9th check points) were strongly correlated (r = 0.981 and r = 0.984, respectively) compared to other check points (Table 4). Hence, the 5th and 8th points were eliminated from the BCS chart.
The new valid BCS chart was a 1 to 5 scale at 0.5 increments examining 8 skeletal check points (Fig. 1). BCSs were assigned to the same herd of two hundred buffaloes following the new BCS chart. The mean scores at the skeletal check points 1, 2, 3, 4, 5, 6, 7 and 8 were 3.49, 3.36, 3.29, 3.28, 3.23, 3.22 and 3.26, respectively. The mean BCS of the herd was 3.29. The mean BCS assessed using 0.25 and 0.5 increments were significantly (p < 0.01) correlated (r = 0.81). Moreover, there was no appreciable difference in the amount of fat reserves when 0.25 increments were used compared to 0.5 increments. Hence, the BCS system on a 1 to 5 scale using 0.5 increments examining eight check points was found to be valid, appropriate and precise.
Validity of the new BCS system
Ultrasonographic measurements of fat thickness showed that there were significant (p < 0.01) differences in the fat thicknesses at various skeletal check points within each BCS. The fat thickness was highest at the tail (p < 0.01), followed by the lumbar area, ribs, sacral crest to hooks, and hook to pin points. Table 5 shows the ultrasonographic measurements of mean body fat thickness for buffaloes of different body condition scores. Significant differences were observed in the fat thickness for buffaloes of various BCS groups (p < 0.01). As the BCS increased, the amount of fat reserves also increased significantly, indicating that BCS adequately reflected the amount of actual fat reserves (p < 0.01).
Correlations among BCS, mean carcass fat reserves and mean ultrasonographic fat reserves showed that BCS was significantly (p < 0.01) correlated with the carcass fat reserves (r = 0.860) and ultrasonographic fat reserves (r = 0.854). There was a significant (p < 0.01) correlation between the carcass and ultrasonographic fat reserves (r = 0.942) (Table 6).
Discussion
The anatomical differences between cattle and buffalo skeletons in this study showed that the pelvic measurements were in accordance with the findings of Malik et al. [17] in Murrah buffaloes and Malik et al. [18] in crossbred cows. The mean ± SE value of carcass fat thickness between 12th and 13th ribs (4.19 ± 0.27 mm) in the present study was slightly higher than the value (3.83 ± 0.21 mm) recorded by Sarma and Sharma [24] on the 12th rib for male Murrah buffalo calves slaughtered at 19 months of age. The difference might be attributed to the age group of animals. The mean ± SE (mm) values of carcass fat thickness at the point between 12th and 13th ribs for the scores 1 to 5 ranged from 1.67 ± 0.07 to 7.82 ± 0.21, whereas the values recorded by Apple et al. [2] by assigning scores to beef cows on a 9 point scale ranged from 0.5 ± 1.5 to 27.3 ± 1.5. The difference in the fat thickness measurements might be attributed to the species differences.
The preliminary BCS chart prepared using a 1 to 5 scale at 0.25 increments examining ten skeletal check points was similar to the chart developed by Edmonson et al. [9] for Holstein dairy cows with eight skeletal check points. The 5th and 8th check points were eliminated from the BCS chart prepared based on the correlations studied for the mean scores among the ten check points. Body condition is scored with only the check points that decisively contributed to the differences among scores. Significant correlation between BCS at 0.25 and 0.5 increments showed that there was no appreciable difference in the amount of fat reserves between the two. Hence, the BCS system can be separated by 0.5 increments, in accordance with the findings of Ferguson et al. [10] who reported that BCS can only be separated by 0.5 units for scores less than 2.5 and greater than 4.0.
A new valid BCS chart on a 1 to 5 scale using 0.5 increments to examine 8 skeletal check points was developed. The 5 point scale developed in the present study can be used to score Murrah dairy buffaloes. For beef cattle, a 9 point scale is commonly used [27]. A 5 point scale [19] and a 5 to 15 point scale [26] have also been used for beef cattle. For dairy cows, 8 and 10 point scales are used in Australia and New Zealand [23]. The Danish scoring system for dairy cows is based on a 9 point scale [15]. Prevailing scoring systems for dairy cows in the United States and Ireland use a 5-point scale.
The skeletal check points examined in various BCS systems differed from study to study. Jefferies [14] examined the vertebral column and lumbar vertebrae in ewes, Gerloff [12] examined the pin, loin, withers and ribs of dairy cattle, Edmonson et al. [9] examined the spinous and transverse processes of lumbar vertebrae, between spinous to transverse processes, over hanging shelf formed by the transverse processes above the flank, bony prominences of hooks and pins, depression between hook and pins, depression between the hooks and depression beneath the tail of Holstein dairy cows. However, the present study examined the depression between tail head to pins, the spinous and transverse processes of lumbar vertebrae, between the spinous to transverse processes, between 12th and 13th ribs, sacral crest, depression between sacral crest and hooks, and the depression between hooks and pins in Murrah buffaloes. The differences in the check points may be attributed to the species and breed differences in the animals. The new BCS is determined by sight and palpation of the skeletal check points which was in tune with Wildman et al. [28] and Ferguson et al. [10], both who examined the body locations by appearance and palpation, whereas Edmonson et al. [9] evaluated the body locations only visually.
Therefore, the present study suggested that anatomical studies, amount of fat reserves and the assessment of scores helped in the development of a valid BCS system. The BCS system helps the farmers to overcome difficulties in the management of buffaloes. The farmers will be instructed on how to assess the body condition using the BCS system, which skeletal check points to examine and how to detect the changes in body fat reserves using a 1 to 5 scale at 0.5 increments through video, explaining in the local dialect. This would allow the farmers to be trained by the wide distribution of video cassettes, enabling them to score their animals independently. The BCS system developed is user friendly, easy, quick, repeatable and inexpensive.
The ultrasonographic fat thickness measurements were significantly (p < 0.01) higher at the check point between tail head to pins, in accordance to the findings of Gentry et al. [11] who observed that the tail head area accounted for the majority of the variation in BCS in mares. As the BCS increased, the amount of fat reserves increased significantly (p < 0.01), indicating that BCS adequately reflected the amount of actual fat reserves. Significant (p < 0.01) correlations were observed between BCS and ultrasonographic fat reserves (r = 0.85), in accordance to the findings of Lubis and Fletcher [16], who reported a significant correlation (r = 0.87) between subjectively determined BCS and ultrasonically determined back fat thickness in swamp buffalo cows, and Zulu et al. [29] who reported significant correlations between BCS and ultrasonographic measurements of the subcutaneous fat in dairy cows.
A significant (p < 0.01) correlation between carcass and ultrasonographic fat reserves showed that ultrasonography has the potential to determine fat thickness with a high degree of accuracy. This was in agreement with the findings of Perkins et al. [20], who reported a significant (p < 0.01) correlations (r = 0.75) between ultrasonic and carcass measurements in beef cattle, indicating that ultrasonic measurements of back fat taken before slaughter might be a relatively accurate predictor of final carcass thickness. Greiner et al. [13] also reported a significant correlation (r = 0.89) for ultrasonographic and carcass fat and concluded that ultrasound can be an accurate estimator of traits in carcass and live cattle. Therefore, BCS adequately reflected the amount of actual fat reserves and was significantly correlated with the carcass fat reserves as well as the ultrasonographic fat reserves.


 XML Download