

 PDF
PDF ePub
ePub Citation
 Print
Print


Introduction
Electroretinography (ERG) is a reliable diagnostic tool for the evaluation of retinal function. It is commonly used to diagnose retinal disorders before cataract extraction or in cases of unexplained visual loss without ophthalmoscopic abnormalities [11].
The definition of a normal range of ERG values is difficult because the results of ERG can vary due to intrinsic factors and extrinsic factors. Of the former, the eye's state of light adaptation affects the results of the ERG recording the most, followed by species, age, transparency of the ocular media, retinal integrity, retinal circulatory disturbances, ocular opacity and pupil dilation [2]. Extrinsic factors are time and intensity for light stimulation, location and type of electrodes, kind of recording equipment used, anesthetic protocol, experimental conditions, and environment factors [2]. All of these factors may differ between various laboratories. However, yielding normal ranges for the ERG will certainly help to diagnose retinal disease processes. Normal ranges should be obtained for each specific clinic or laboratory, breed, age range, and every ERG equipment used.
In this study, the amplitude and implicit time ranges of the a- and b-wave, and b/a ratio of normal eyes in healthy Shih Tzu dogs were measured using the Handheld Multispecies ERG (HMsERG) for determining the standard ERG parameters in our laboratory.
Materials and Methods
Animals
Twelve eyes of six healthy Shih Tzu dogs were used. All were normal based on the physical, hematological, serological and ocular examination results. Their average age and weight were 2.28 ± 0.48 (mean ± SE) and 3.59 ± 6.45 kg, respectively. They were individually confined and fed commercial dry food and water ad libitum.
ERG equipment
The portable mini-Ganzfeld ERG unit (HMsERG; RetVet, USA) was used in this study. The frequency band was 0.3 to 300 Hz. The primary components of the ERG unit were the stimulation and the recording systems. The unit contained a compact flash card (CFC) with software to drive the ERG unit. Obtained ERG recordings were stored on the CFC. The reference and ground electrodes were needle electrodes (Model E2-straight needle; Astro-Med, USA) and an ERG Jet contact lens electrode (Nicolet Biomedicals, USA) was used as the active electrode. The obtained responses were transferred to a computer to visualize the ERG readings and to print the results.
ERG procedure
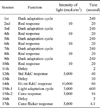
ERG examinations were performed under dim red light in a dark room. The pupils were dilated with 0.5% tropicamide (eye drops, two times, 15 min intervals; Samil, Korea). After producing mydriasis, animals were dark-adapted for 20 min [4,10,12,15]. ERG examination was then performed under general anesthesia using a combination of 40 µg/kg medetomidine hydrochloride (Orion Pharma, Finland) and 4 mg/kg ketamine hydrochloride (Yuhan, Korea) intravenously [6,8,12]. The ground electrode was placed over the external occipital protuberance and the reference electrode was placed approximately midpoint between lateral canthus and ipsilateral ear pinna [8]. The active electrode was positioned on the cornea after topical anesthetic eye drops (0.5% proparacaine hydrochloride ophthalmic solution; Alcon, Belgium) and artificial tears (0.03% hydroxypropylmethyl cellulose; Hanlim, Korea) were applied [2,3,14]. Before ERGs were recorded, impedance and baseline tests were performed; the latter for evaluating the noise level in the environment. ERGs were recorded automatically using the dog diagnostic protocol pre-programmed for this equipment which came from the manufacturer that way. It consists of a total of 17 sessions and the entire protocol takes 34.57 min per eye. All functions, including intensity of light and time for each session are described in Table 1 [5].
Evaluation of ERG
The a-wave amplitude was measured from the baseline to the a-wave through, and the b-wave amplitude was measured from the a-wave trough to the b-wave peak [9]. Then b/a ratios of amplitude were calculated. The a- and b-wave implicit times were measured from the stimulus onset to the a-wave trough and b-wave peak, respectively [9]. For estimation of normal ranges of each measurement values, the mean and standard error of a- and b-wave amplitudes, and implicit times, as well as b/a ratios were calculated. Because there is no a-wave in the dark adapted eye at 10 mcd.s/m2, the a-wave at 10 mcd.s/m2 were not used.
Results
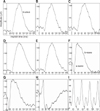
The results of ERG recordings using the dog diagnostic protocol of the HMsERG are represented as waveforms (Fig. 1). Both a- and b-waves were represented in the standard rod and cone (Std R&C), high-intensity rod and cone (Hi-int R&C), and cone responses, but only b-waves were obtained for the rod and cone flicker responses (Fig. 1).
a- and b-wave amplitude and b/a ratio
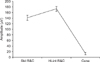
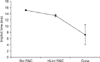
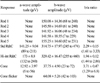
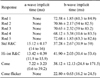
The a-wave amplitude is shown in Fig. 2 and Table 2. The Hi-int R&C response was high at 173 ± 8.80 µV (mean ± SE); the Std R&C and the following cone responses were 141.25 ± 9.04 µV and 12.92 ± 3.97 µV, respectively.
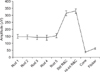
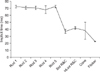
The b-wave amplitude is shown in Fig. 3 and Table 2. Rods 1 to 5 had amplitudes of 150.08 ± 14.36 µV, 145.50 ± 14.69 µV, 141.92 ± 16.06 µV, 141.58 ± 18.55 µV and 155.25 ± 14.60 µV, respectively. It was increased in the Std R&C response with 314.75 ± 17.97 µV and the highest in the Hi-int R&C response with 329.42 ± 16.47 µV. The cone and cone flicker responses had lower amplitudes than the rod responses at 37.75 ± 4.90 µV and 64.08 ± 5.26 µV, respectively.
a- and b-wave implicit time
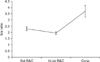
The a-wave implicit time is shown in Fig. 5 and Table 3. It was the fastest for the Std R&C response at 15.12 ± 0.17 ms (mean ± SE), and were 13.42 ± 0.39 ms and 7.22 ± 3.23 ms for the Hi-int R&C and cone responses, respectively.
The b-wave implicit time is shown in Fig. 6 and Table 3. The implicit time of rods 1-5 were the highest at 72.58 ± 1.85 ms, 70.86 ± 2.17 ms, 70.65 ± 2.32 ms, 68.12 ± 5.38 ms and 72.68 ± 1.83 ms, respectively. Std R&C and Hi-int R&C responses showed similar values at 37.28 ± 2.67 ms and 41.90 ± 2.03 ms, respectively, and then it decreased for the cone response to 38.12 ± 12.13 ms.
Discussion
Shih Tzus were selected for this study because it is the most preferred and the most common dog breed in Korea. The breed has a predisposition for eye diseases which requires retinal evaluation for diagnosis, such as retinal detachment, progressive retinal atrophy and cataracts [13].
Various anesthetic protocols can affect the results of ERG examinations. According to previous studies, halothane and sevoflurane strongly depress the scotopic threshold response in Beagles, while moderately depressing the b-wave and increasing the oscillatory potential amplitudes, precluding their use for ERG examinations [14]. On the other hand, the combination of ketamine and xylazine has been commonly used because the ketamine and xylazine mix achieves sufficient immobilization for disturbance-free ERG recordings [3]. In regards to ketamine, Kommonen and Raitta [3] reported the most adequate time for the ERG recording was 10 to 20 min after ketamine administration. Furthermore, it had no significant effect on the ERG results. This protocol also showed that there was no globe rotation for Poodle and Beagle dogs. Therefore it did not require stay-sutures for restriction of eyeball rotation. However, this effect cannot be achieved in Labrador Retrievers [3]. Isoflurane appears not to affect the results of ERG recordings. But eyeball rotation may occur, so stay-sutures are recommended [4,5].
In this study, ketamine and medetomidine was used intravenously. We used medetomidine instead of xylazine because of the vomiting risk [5]. With this combination, appropriate anesthesia was achieved for ERG examination, which took almost 40 min. Moreover, eyeball rotation was not observed in any of the dogs. Because atipamezol hydrochloride could be applied as a counter if needed, we believe that this protocol is safer than previous anesthetic protocols. Therefore, the combination of ketamine and medetomidine can be considered as a good anesthetic protocol to use with the HMsERG in the Shih Tzu dog.
The HMsERG consists of the unit body, a mini-ganzfield and three electrodes; the active electrode (the jet lens electrode) and 2 needle electrodes. Very advantageous in regards to the HMsERG is the mini-ganzfield. Up to now, the conventional Ganzfeld dome has been widely used for full-field ERG examination in veterinary ophthalmology [5,7,9]. However, some disadvantages of the conventional Ganzfeld dome are the large and expensive system, the difficulty of using bilateral stimulation recordings, and the fixation of the animal during examination [5]. Also the location of the dog's head inside a sphere of 60 cm diameter may be difficult to achieve [5]. But the mini-ganzfield overcomes theses issues.
The HMsERG has four built in protocols based on the International Society for Clinical Electrophysiology of Vision (ISCEV). Among them, the dog diagnostic protocol was used in this study because this provides more accurate values of rod and cone responses in dogs than the case for short protocols [1].
Generally, ERG examinations are interpreted with amplitude and implicit times of a- and b-waves. In addition, one of the reasons that the evaluation of b/a ratios are considered to be an important parameter being that it is an indicator of disorders of the retina in cases with dense opacity observed in the anterior segment and vitreous body [5].
The ISCEV established standard flash b/a ratio = 2 at intensity of 3 cds.s/m2 in humans [7]. Maehara et al. [5] reported similar b/a ratio at the same intensity of light in beagles. In this study, b/a ratio was 2.29 ± 0.15 at the intensity 3 cds.s/m2. This result is similar to the above studies.
The time of dark adaptation is important since it can affect the ERG results as the values may be affected by the degree of light exposure before the ERG [11]. Because the dog diagnostic protocol has a dark adaptation cycle (a low intensity stimulation for every 4 min) of 20 min, any further dark adaption is not needed before performing ERG examinations. However, when we applied 20 min of dark adaptation before performing an ERG examination, then we obtained the same b-wave amplitudes as the dark adaptation cycle. This means we were not checking the dark adaptation cycle properly. But these results can be used as the normal values of specific responses such as the rod system b-wave, the mixed response rod and cone a- and b-waves (for scotopic recordings) and the cone a- and b-waves and the flicker b-waves (for photopic recordings).
In conclusion, we believe that the parameters obtained in this study can be used as normal ERG reference ranges for Shih Tzu dogs.
 XML Download