

 PDF
PDF ePub
ePub Citation
 Print
Print


INTRODUCTION
The acute phase response (APR) is a generalized response of the organism to multiple disturbances of its physiological homeostasis. Inflammatory processes are the main causes for the initiation of these defense mechanisms.1 As part of systemic inflammatory reactions, interleukin 6 (IL-6) regulates APR genes in liver cells including C-reactive protein (CRP), fibrinogen, serum amyloid A (SAA), α2-macroglobulin, and albumin.2 Elevated levels of IL-6 and liver APR genes that are a reflection of the inflammatory state have been reported in patients with acute coronary syndrome.3 IL-6 actions are mediated by a specific cell surface IL-6 receptor (IL-6R), an 80-kDa glycoprotein (gp80), and a signal transducing molecule, glycoprotein gp130, which is also the signaling molecule for various IL-6 family cytokines.4 IL-6 binds to its cognate receptor, and IL-6/IL-6R forms a complex with a gp130 homodimer. Ligand-induced oligomerization of receptor subunits leads to activation and phosphorylation of a signal transducer and activator of transcription 3 (STAT3) and of linker proteins, which propagate the signal to other pathways and cause activation of immediate early response genes, such as c-jun.5 STAT3 and c-Jun cooperatively activate APR gene transcription6 and act in concert with various isoforms of the transcription factor CAAT enhancer-binding protein (C/EBP) to up-regulate APR protein expression.7
PPARs are ligand-activated transcription factors that belong to the superfamily of nuclear receptors.8 PPARs are activated by natural ligands such as fatty acids, eicosanoids, and oxidized fatty acids.9 Of the 3 PPAR family members, PPAR-α, PPAR-β/δ, and PPAR-γ, PPAR-α is the target of the lipid-lowering fibrates.9 PPARs regulate gene expression by forming heterodimers with the retinoid X receptor (RXR) and binding to specific DNA sequences located in the promoter region of target genes, termed PPAR response elements (PPRE transactivation). PPREs consist of a direct repeat (DR) of a hexameric AGGTCA recognition site separated by 1 (DR-1) or 2 nucleotides (DR-2).10 A physiological role for PPAR-α is to control FA oxidation in response to fasting by inducing ketone body formation11 and high-fat-feeding.12 PPAR-α also plays a major role in lipid homeostasis by controlling key genes encoding enzymes and apolipoproteins involved in lipoprotein metabolism.13 Furthermore, PPAR-α displays antiinflammatory activities and controls the inflammatory response in the vascular wall.14 The control of inflammatory pathways by PPARα occurs mainly via repression of target genes caused by negative interference in a DNA-binding-independent manner (transrepression).14 It is well-established that serum concentrations of hepatic inflammatory response genes (eg, fibrinogen, CRP, SAA) are elevated in patients with coronary artery disease (CAD), and several of the genes, including fibrinogen and CRP, are considered as risk markers.14
PPARα seems to decrease inflammation, mainly through direct interaction with NFκB, causing inhibition of its signaling pathway or reducing the activated levels of NFκB and subsequent inflammation. In fact, PPARα was reported to protect the liver from obesity-induced inflammation after feeding with a high-fat diet (HFD) for 6 months.15 Furthermore, PPARα was implicated in the attenuation of oxidative stress in alcoholic liver disease when treated with polyenephosphatidylcholine through downregulation of ROS generating enzymes such as ethanol-inducible cytochrome P450 2E1 (CYP2E1), acyl-CoA oxidase, and NADPH oxidase.
PPARγ, a nuclear transcription factor, regulates lipid metabolism and the inflammation response, and maintains the quiescent phenotype of hepatic stellate cells.16,17 PPARγ knockout causes hepatic insulin resistance and increases the plasma free fatty acids level.16 Dysfunction of PPARγ is related to the inflammatory and pro-fibrogenic actions in the liver, 17 inferring that PPARγ may play a major role in the pathogenesis of non-alcoholic steatohepatitis.
Recent evidence suggests that PPARs may attenuate inflammatory signaling pathways and, as such, the acute phase response in the liver and interfere with cardiac remodeling. This function is largely mediated through the ability of agonist-activated PPARs to form complexes with other transcription factors, such as NF-κB and STATs (signal transducers and activators of transcription), thereby resulting in the functional cross-inhibition of their transcriptional activity.18 Treatment with L-165041 inhibits phenylephrine- and lipopolysaccharide-induced NF-κB activation in cultured neonatal rat cardiomyocytes and embryonic rat heart-derived H9c2 cells.19 The antihypertrophic effects of this PPARβ/δ agonist involve down-regulation of the NF-κB signaling pathway through enhanced physical interaction between the p65 subunit of NF-κB and PPARβ/δ.20
PPARs are activated by natural ligands such as polyunsaturated fatty acids and by synthetic ligands (drugs belonging to the fibrate family). Recent observations indicate that PPARα activators could reduce the inflammation by decreasing cytokines, adhesion molecules, and NOS2. In addition, PPARα activators reduce oxidative stress by increasing antioxidant enzymes such as Cu/Zn2+ superoxide dismutase and glutathione peroxidase. Indeed, PPARα activation exhibits anti-inflammatory and antioxidant properties in vitro and in different experimental models, including carrageenan-induced paw edema, experimental colitis, and liver cirrhosis. In addition, PPARα agonists have been recently demonstrated to be protective in both neuronal cell culture21 and in vivo cerebral ischemia models.
Fibrates are hypolipidemic drugs that efficiently normalize hypertriglyceridemia and hypercholesterolemia. In addition, fibrates may also lower fibrinogen and CRP plasma levels and affect other plasma APR proteins.22 Fibrates exert their action via activation of the nuclear receptor PPARα. PPARα regulates transcription of target genes via binding of PPARα with its heterodimeric partner retinoid X receptor to specific response elements. This pathway is mainly involved in the regulation of genes that play a role in lipid and lipoprotein metabolism and may, in large part, explain the normolipidemic action of fibrates.13 Furthermore, PPARα has been demonstrated to act as a negative regulator of genes involved in the inflammatory response by antagonizing the activity of transcription factors, such as NF-κB and AP-1, partly by direct interaction with proteins such as p65 and c-Jun. In line with these findings, impaired expression of PPARα has been found to sustain the inflammatory response.
In the present study, I hypothesized that LPS-induced inflammatory cytokines, TNF-α, IL-1β, or IL-6, exert their effects directly on the hepatocytes and suppress the messenger RNA of PPARs and co-regulators contributing to the alterations in lipid metabolism that occur during the APR. In addition, fenofibrate, a PPARα agonist, reduces secretion of proinflammatory cytokines from serum and protein or mRNA in liver.
METHODS
Chemicals and supplies
The lipopolysaccharide (LPS) (Escherichia coli 055:B5 clone), fenofibrate, was purchased from Sigma (St. Louis, Mo, USA). Plastic culture wares were purchased from Falcon, Inc. (Becton Dickinson Biotech, Lincoln, IL). Dulbecco's modified essential medium (DMEM), TRIzol, and fetal bovine serum (FBS) were obtained from Invitrogen (Invitrogen, Carlsbad, CA). Antibodies, including anti-HO-1, anti-tumor necrosis factor α (anti-TNF-α), anti-peroxisome proliferator activated receptors (anti-PPARs: PPARα, β/δ, and γ), anti-janus kinase 1 (JAK1), anti-phosphorylated-JAK1, anti-STAT3, anti-phosphorylated-STAT3, anti-catalase, anti-PGC-1, anti-TLR4, and anti-beta-actin were purchased from Santa Cruz Biotechnology (Santa Cruz, CA). Mouse anti-phospho-Iκ Bα and rabbit anti-IκBβ Abs were purchased from Cell Signaling Technology (Beverly, MA). ECL solution was obtained from Thermo Scientific (Pierce Chemical, Rockland, IL). Mouse TNF-α, IL-1β, and IL-6 immunoassay kits were purchased from R & D Systems (Minneapolis, MN, Canada). For immunohistochemistry, LSAB+System-HRP kit was obtained from DAKO (Carpinteria, CA, USA). For cDNA synthesis, Transcriptor First Strand cDNA Synthesis Kit was purchased from Roche (Indianapolis, IN, USA).
Culture and treatment of HepG2 cells
Hepatoma (HepG2) cells were purchased from American Type Culture Collection (Mannassas, VA, USA), and maintained in the DMEM containing 10% FBS, penicillin/streptomycin, and 1 x nonessential amino acids. HepG2 cells were seeded at the density 3×10⁶ cells/dish (6-cm plate for protein level and mRNA level). Prior to each experiment, the HepG2 cells were rinsed two times with 1 ml warm (37℃) phosphate-buffered saline (PBS) and the medium was replaced with fresh serum-free DMEM plus 0.1% bovine serum albumin. The cells were then treated with 5 µg/ml LPS for 20 h. For some experiments, fenofibrate was added as a pretreatment 30 minutes before LPS stimulation.
Measurement of proinflammatory cytokines
To quantify the secretion of proinflammatory cytokines from LPS-treated Balb/c, TNF-α knockout, and IL-6 knockout mice, whole blood was isolated from the mice before sacrifice, incubated at 4℃ for 16 h, and centrifuged at 4,000 rpm for 20 min. Thereafter, the level of proinflammatory cytokines was determined by ELISA according to the manufacturer's instructions.
Assay for messenger RNA expression by reverse transcriptase-polymerase chain reaction (RT-PCR)
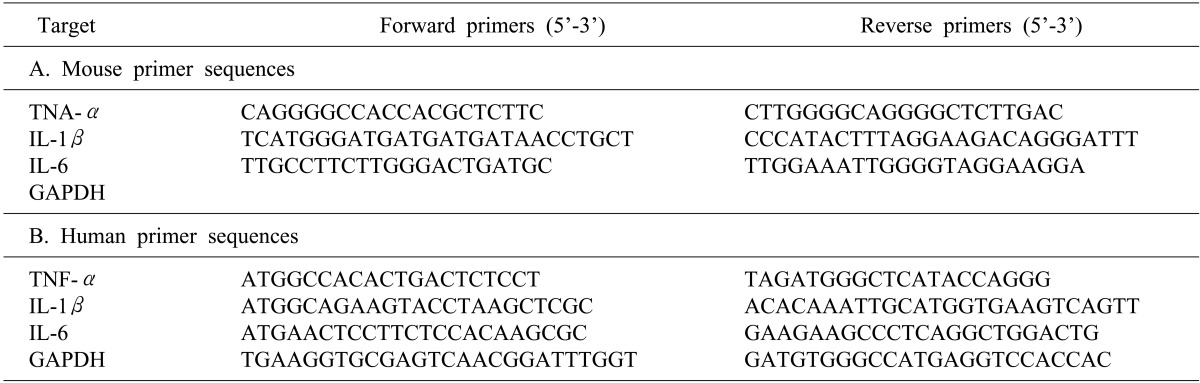
After extracting total RNA from the liver using TRIzol, the complementary DNA (cDNA) was synthesized using reverse transcriptase. RNA (2 µg) and oligodT were preincubated at 70℃ for 5 minutes, then quick-chilled on ice. cDNA synthesis was performed at 42℃ for 60 minutes, and followed by reverse transcriptase inactivation at 94℃ for 5 minutes. PCR was then performed with Taq polymerase (SolGent Co., Daejeon, Korea) for 35 to 40 cycles using the following protocol: 94℃ for 30 s, 55℃ to 61℃ for 30 s, 72℃ for 30 s. Primers are listed in Table 1.
Measurement of hepatic messenger RNA levels by quantitative real-time polymerase chain reaction (QRT-PCR)
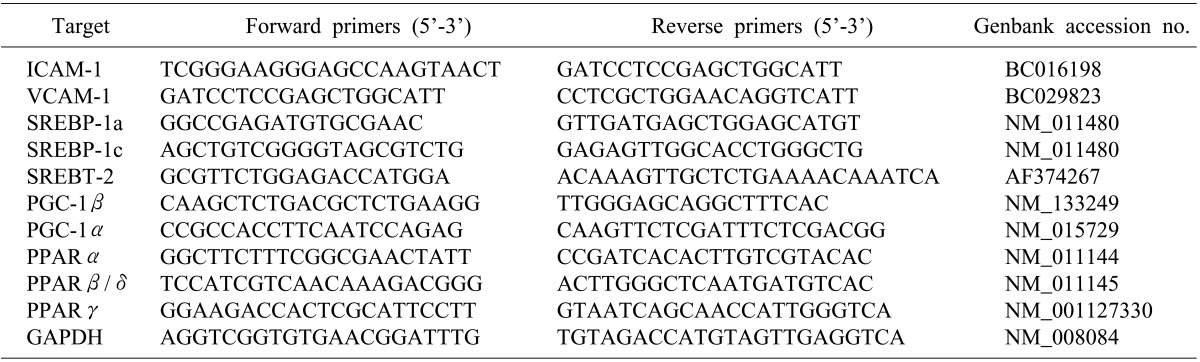
RNA was extracted using TRIzol and cDNA was synthesized using Superscript III. Semiquantitative real-time PCR analysis using Fast SYBR Green Master Mix (AB) was performed using a Step One Plus (AB). Primers are listed in Table 2.
Study animals
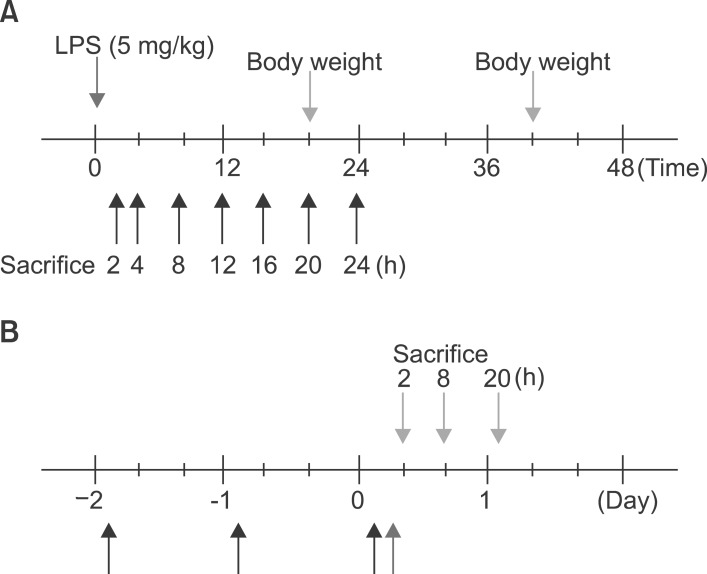
Eight-week-old male Balb/c mice weighing 22 to 23 g were purchased from ORIENT (Korea). Balb/c, TNF-α knockout, and IL-6 knockout mice were maintained in a room with a normal light cycle and were provided with rodent chow and water in SPF conditions. Mice were injected intraperitoneally with 100 µg of LPS per 20 g mouse in 700 µl saline or with saline alone. Food was withdrawn at the time of injection because LPS and cytokines induce anorexia in rodents. The livers were removed after treatment at the time indicated in the text. The doses of LPS were not lethal, as the LD50 for LPS in rodents is approximately 5 mg/100 g body weight. Four groups of mice were used in some experiment for testing the effect of fenofibrate. The first group (n=5) received an equal volume (25 ml/kg) of methylcellulose (0.5%) instead of the fenofibrate. The second group (n=5) received an equal volume of methylcellulose and 100 µg of LPS. The third group (n=5) received fenofibrate 100 mg/kg by oral administration for 2 days and were then injected with 100 µg of LPS. The last group (n=5) received only fenofibrate (Fig. 1).
Preparation of cell extracts
Briefly, HepG2 cells were disrupted in a sucrose-HEPES buffer containing 0.5% Nonidet P40 as a detergent, protease inhibitors, and dithiothreitol. After disruption by 5-minute incubation on ice and centrifugation, nuclear proteins were separated in a sodium chloride-HEPES buffer and re-suspended in a glycerol-containing buffer. Total cell lysates were prepared according to Santa Cruz Biotechnology (Santa Cruz, CA) Western Blotting Protocol. Briefly, cells were washed once with PBS, scraped into a 0.6 ml radio-immunoprecipitation assay (RIPA) buffer, then incubated for 1 hour with rocking. Lysates were then centrifuged at 13,000 rpm for 15 minutes and the supernatant was retained as the total cell lysate. All the procedures were carried out on ice. Protein quantification was determined by the Bradford assay (Bio-Rad, Hercules, CA). For preparation of liver extracts from LPS-injected mice, liver tissues were homogenized into 0.1 ml 1×SDS sample buffer [62.5 mM Tris-HCl (pH 6.8 at 25℃), 2% w/v SDS, 10% glycerol, 50 mM DTT, 0.01% w/v bromophenol blue], then added 0.4 ml 1×SDS sample buffer. Lysates were sonicated for 30 seconds to shear the DNA and then centrifuged at 13,000 rpm for 15 minutes and the supernatant was retained as the total liver tissue lysate. Sample lysates (50 µl) were heated to 98℃ for 10 minutes.
Western blot analysis
Denatured cell lysate was loaded onto 10% SDS-polyacrylamide gels and subjected to electrophoresis. After electrotransfer onto nitrocellulose membrane (Amersham Pharmacia Biotech, Piscataway, NJ), blots were blocked with phosphate-buffered saline containing 0.5% Tween-20 and 5% dry milk for 1 h at room temperature and incubated for 2 h at room temperature with polyclonal anti-HO-1, anti-TNF-α, anti-actin, anti-PPARs (PPAR α, PPAR β/δ, PPAR γ), anti-catalase, anti-PMP70, and anti-PGC-1 at a dilution of 1:1,000. Immune complexes were detected by using the appropriate second antibody linked to horseradish peroxidase according to the ECL Plus Western blotting kit (Amersham Pharmacia Biotech). After extensive washes, the band on the membrane was visualized using chemiluminescent reagents according to the manufacturer's instructions in the dark. Immunoreactive bands were quantified by densitometry. Other antibodies tried were anti-phospho-JAK1, anti-JAK1, anti-phospho-STAT3, and anti-STAT3.
Immunohistochemistry
The removed liver was fixed in 4% formaldehyde for 16 h at 4℃. The liver was washed three times with PBS, dehydrated, and embedded in paraffin. Sections of 4 µm were deparaffinized in xylene and rehydrated through graded concentrations of ethanol. For immunohistochemical study, the kit (LSAB Universal K680; Dako) was used, and all the procedures were performed according to the instructions of the manufacturer. The endogenous peroxidase was blocked with 3% hydrogen peroxide for 5 min at room temperature. After the sections were washed in PBS, nonspecific binding was blocked with 1% bovine serum albumin for 1 h. Then, primary antibody (1:200 diluted) (TNF-α, TLR4, and PPARs) was added to the slides and the incubation proceeded for 1 h. After repeated washes with PBS, the section was incubated with biotinylated secondary antibody for 1 h and then covered for 15 minutes with streptavidin-peroxidase. Finally, after repeated washes with PBS, the sections were stained in a freshly prepared substrate solution (3 mg of 3-amino-9-ethylcarbazole in 10 ml of sodium acetate buffer, pH 4.9, 500 µl of dimethylformamide, and 0.03% hydrogen peroxide) for 10 min. The nuclei of the immunostained cells were counter stained with Mayer's hematoxylin.
Hematoxylin and eosin staining
After the experiment, the liver was fixed in 4% formaldehyde for 16 h at 4℃ and embedded in paraffin. Sections were stained with hematoxylin and eosin.
Statistic analysis
Each experiment was performed at least 3 times independently, and all values were represented as the means±standard deviation (SD) of triplicates. The one-way analysis of variance (ANOVA) was used to analyze the statistical significance of the results. The values of p<0.05 were considered as statistically significant.
RESULT
Injection with LPS increased leukocyte recruitment into liver and liver injury
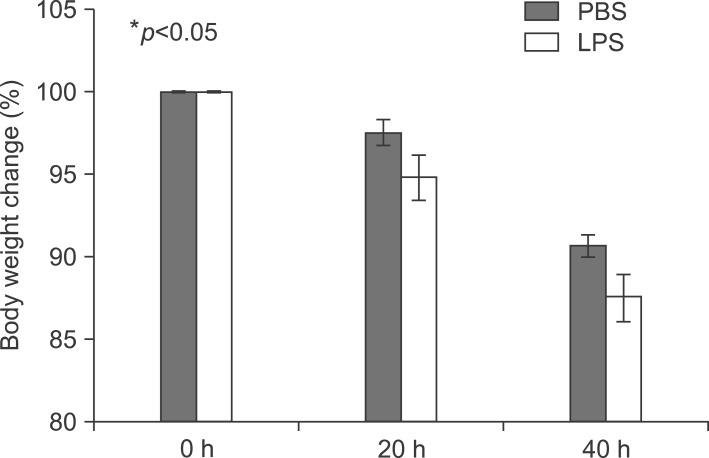
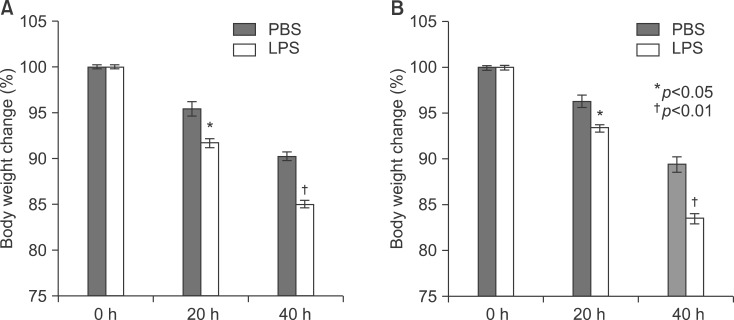
At first, the mice were weighed after LPS injection (Fig. 2).
LPS induced inflammation in Balb/c mouse; Pro-inflammatory cytokines secreted from serum and expressed in liver of LPS-injected Balb/c
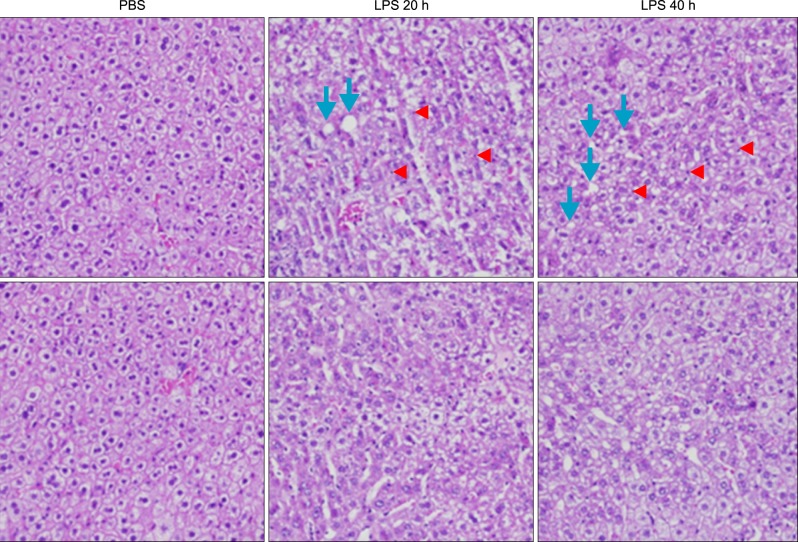
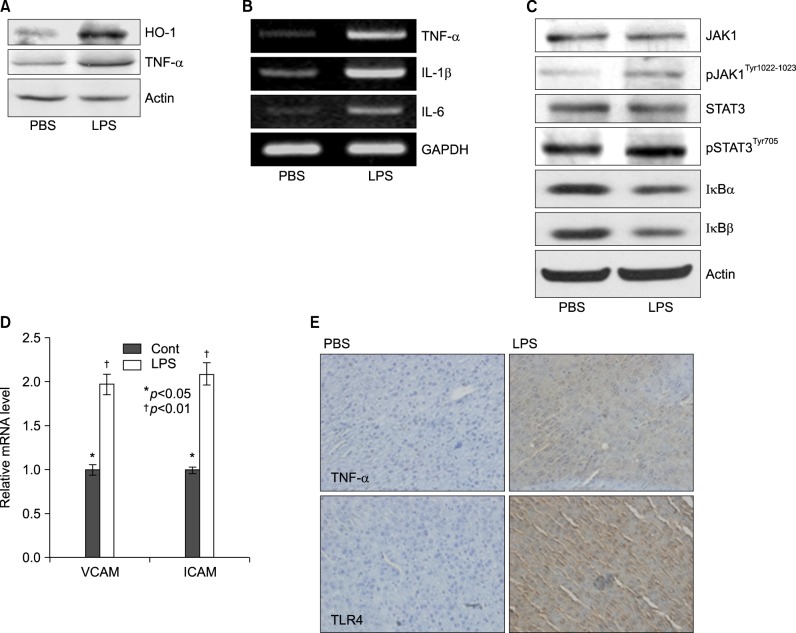
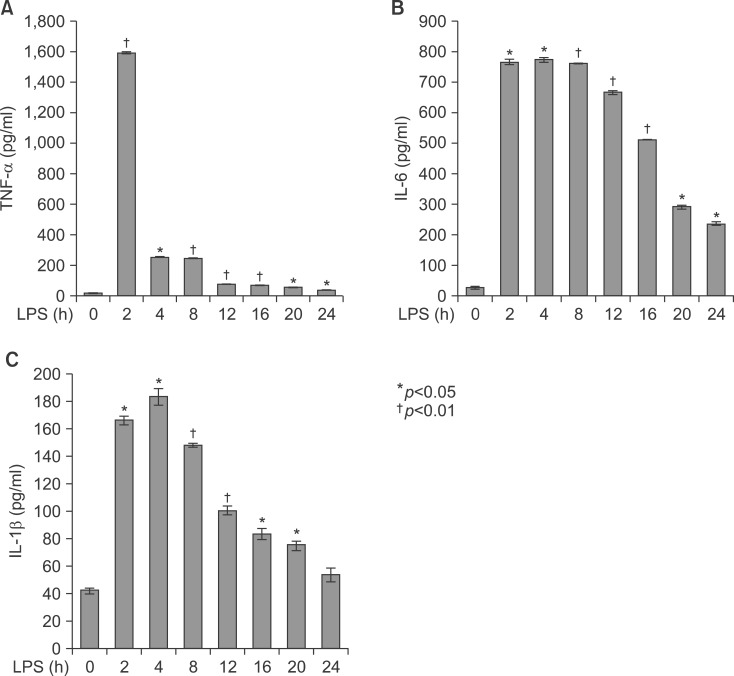
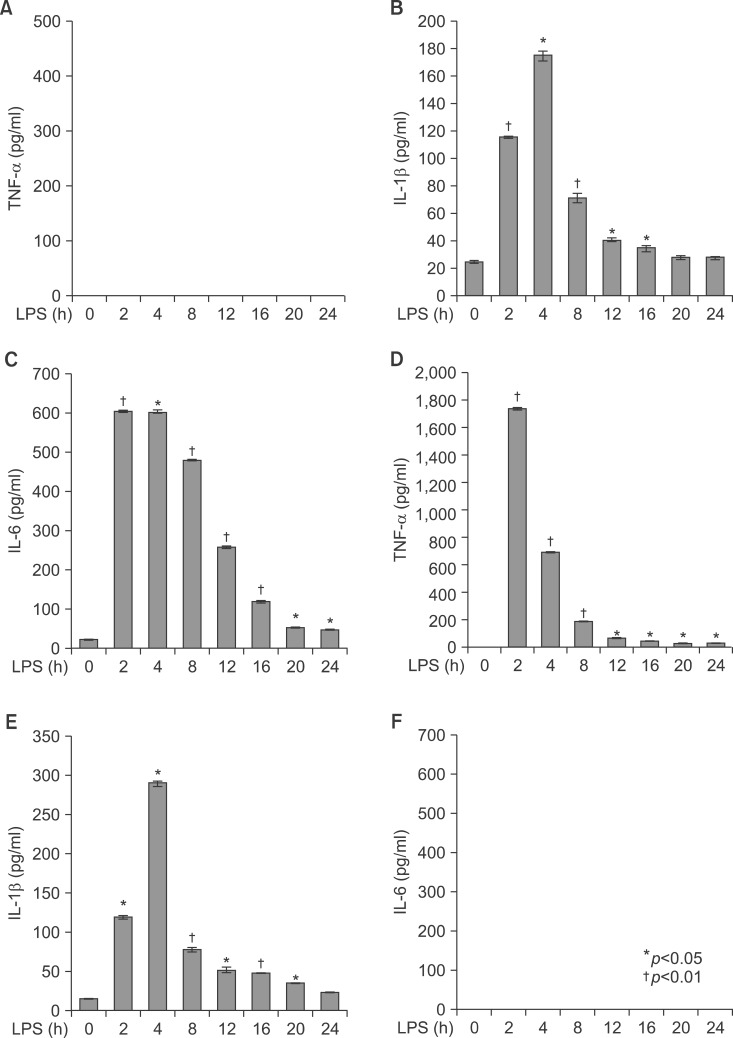
Livers of Balb/c appeared histologically normal. However, in livers from LPS-injected mice, histological analysis revealed the accumulation of micro-vesicular intracellular lipid droplets that were not observed in the PBS-injected Balb/c group. In addition, there were leucocytes infiltrations in the liver of LPS injected Balb/c at the indicated times (Fig. 3). As shown in Fig. 4, LPS treatment resulted in an increase of TNF-α, HO-1 (stress response protein), and TLR4 (Fig. 4A, E), or an increase of TNF-α, IL-1β, and IL-6 mRNA (Fig. 4B). The vascular cell adhesion protein 1 (VCAM) mediates the adhesion of lymphocytes, monocytes, eosinophils, and basophils to vascular endothelium. It also functions in leukocyte-endothelial cell signal transduction, and upregulation of VCAM in endothelial cells by cytokines occurs as a result of increased gene transcription (e.g., in response to TNF-α andIL-1). The promoter region of the VCAM gene contains functional tandem NF-κB (nuclear factor-kappa B) sites. VCAM and ICAM were induced in the liver with LPS-injected Balb/c (Fig. 4D). JAK-STAT signaling is an important regulator of inflammatory responses in the liver. The binding of IL-6 to its membrane receptor leads to the phosphorylation of STAT3 proteins on a specific tyrosine residue (Tyr705) by JAK, which undergoes homo- or heterodimerization. These STAT 3 dimers dissociate from the receptor and translocate into the nucleus, where they induce the expression of specific genes. As shown in Fig. 4C, there was an increase in the activity of the JAK/STAT3 signaling pathway in the liver of mice with LPS, as phosphor-STAT3Tyr705 and phopho-JAKTyr1022-1023 protein levels were increased. The mammalian transcription factor NF-κB regulates a wide variety of genes, including those involved in the inflammatory response, such as the induction of TNF-α production. In resting cells, NF-κB is bound in the cytoplasm to the inhibitory protein, IκB. Upon stimulation, IκB kinases phosphorylate IκB on serine 32, thus triggering its degradation by the proteasome. Western blot analyses were performed with anti-IκBα and IκBβ antibodies on total protein samples extracted from the liver with the LPS treatments. Western blots revealed that protein levels of IκBα and IκBβ were decreased in LPS-treated liver (Fig. 4C). As shown Fig. 4C, these results indicate that an LPS induced phospho-JAK1 and -STAT3, and proteolysis of both IκBα and IκBβ. In the current study, I demonstrated that LPS induces transcriptional and translational upregulation of TNF-α, IL-1β, and IL-6 in the liver in vivo. Previous studies have demonstrated that the production of proinflammatory cytokines is significantly enhanced by the interaction of TLR4 and its exogenously introduced ligand LPS. I therefore investigated by immunohistochemical staining whether in vivo injection of LPS affects the expression of TLR4 and proinflammatory cytokines in the liver. As shown in Fig. 4E, the LPS-injected groups had markedly enhanced expression of TLR4 and TNF-α proteins. Next, serum was isolated at 2, 4, 8, 16, 20, and 24 h after 5 mg/kg LPS injection in Balb/c. The secretion of proinflammatory cytokines was determined by enzyme-linked immunosorbent assay (ELISA). As shown in Fig. 5A, injection of LPS resulted in a marked increase of TNF-α secretion, which was observed as early as 2 h and reached a primary peak level with 1,591.15±5.798 pg/ml at 2 h, and thereafter gradually decreased in a time-dependent manner. LPS also increased secretion of IL-1β, which already reached a peak level with 183.2604±6.542 pg/ml at 4 h, thereafter sustaining its level up to 12 h, and gradually decreasing in a time-dependent manner. IL-6 secretion already reached a peak level with 766.3889±8.214 pg/ml at 2 h, and thereafter gradually decreased in a time-dependent manner (Fig. 5).
Cytokines induced LPS decreased PPARs and co-activators level of mRNA and protein in Balb/c
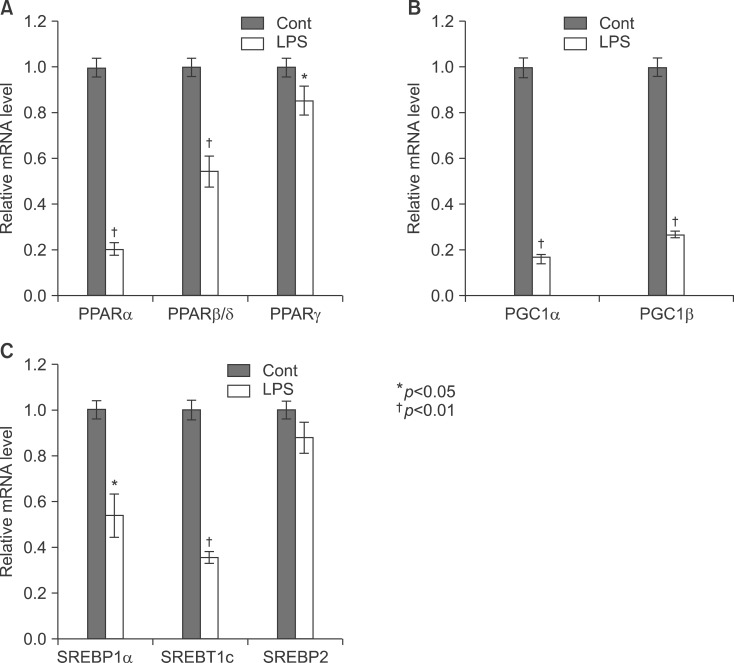
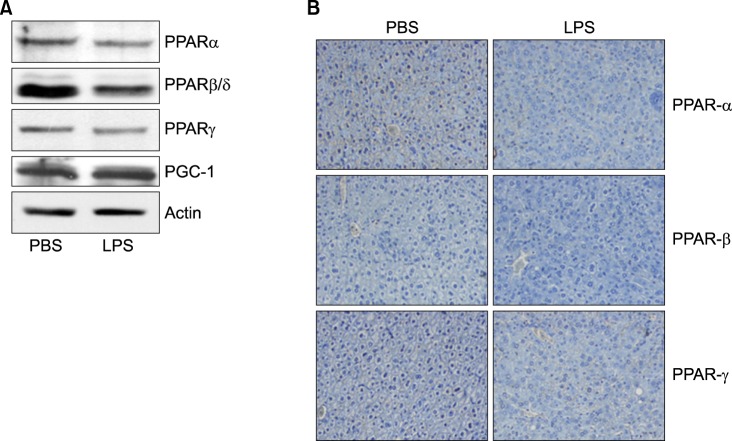
As shown Fig. 6A, LPS significantly decreased the mRNA levels of PPARα and PPARβ/δ. As reported previously in hamsters, LPS-treated mice also displayed a decrease in retinoid X receptor α (RXRα), PPARα, PPARγ, and liver X receptor α (LXRα) mRNA levels, indicating that the acute phase response (APR) in vivo decreases their nuclear hormone receptors. Moreover, PPARγ coactivator 1α (PGC1α) and PGC1β mRNA levels decreased in the liver (Fig. 6B). In addition, LPS decreased the mRNA levels of SREBP-1α and SREBP-1c, an LXR-regulated gene (Fig. 6C). In contrast, the mRNA level of SREBP-2 was not altered by LPS injection. As shown in Fig. 7, LPS decreased PPARα, PPARβ/δ, and PPARγ in the liver of Balb/c.
LPS induced inflammation in TNF-α and IL-6 knockout mouse; Pro-inflammatory cytokines secreted from serum and expressed in liver of LPS-injected KO mice.
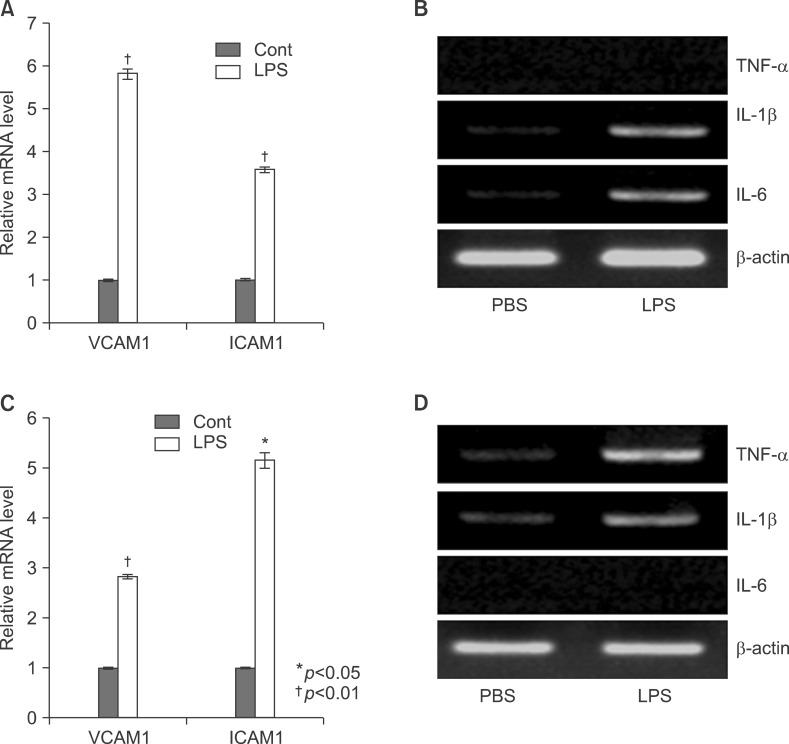
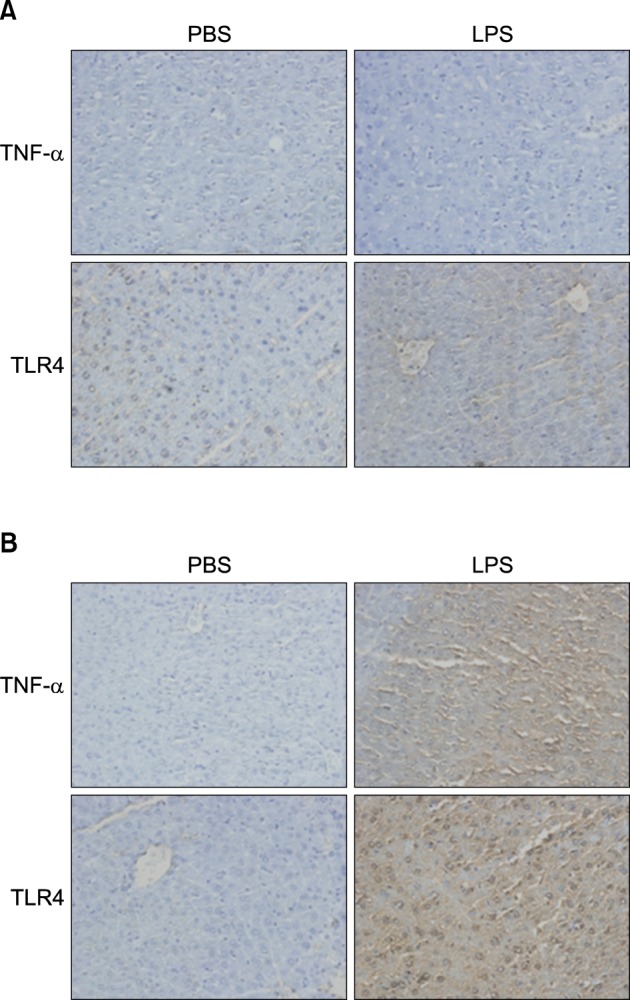
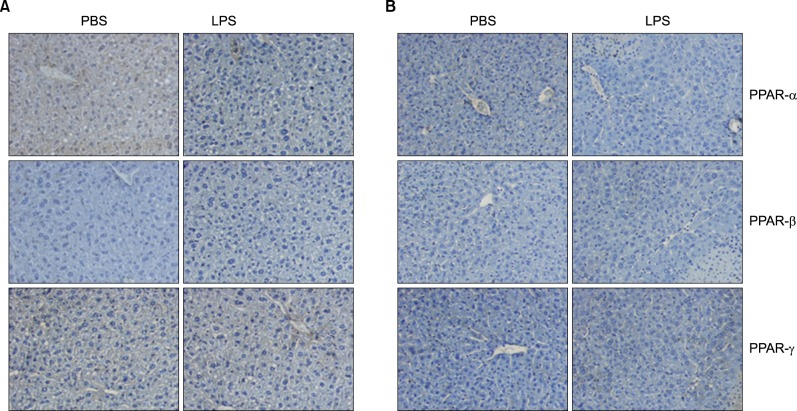
To explore the role of PPARs on LPS-induced inflammation in liver, I next examined with TNF-α and IL-6 knockout mouse. All knockout mice were weighed after LPS injection (Fig. 8). LPS significantly decreased their body weight compared with the PBS-injected group after 20 and 40 hours. Serums of TNF-α and IL-6 KO mice were separated at 2, 4, 8, 12, 16, 20, and 24 h after exposure to 5 mg/kg LPS. The secretion of each proinflammatory cytokine, including TNF-α, IL-1β, and IL-6, was determined by ELISA. As shown in Fig. 9, LPS injection resulted in a marked increase of IL-1β secretion, which was observed as early as 2 h and reached a peak level of 175.2273±3.551 pg/ml at 4 h, and thereafter gradually decreased in a time-dependent manner (Fig. 9B). LPS also induced an increased release of IL-6, which already reached a peak level of 605.1538±3.085 pg/ml at 2 h, and sustained this level up to 4 h, and then gradually decreased in a time-dependent manner in the TNF-α KO mouse (Fig. 9C). In IL-6 KO mouse, LPS injection resulted in a marked increase of TNF-α secretion, which reached a peak level of 1749.417±10.053 pg/ml at 2 h, and then decreased in a time-dependent manner (Fig. 9D). In addition, LPS induced an increased release of IL-1β, which was observed as early as 2 h (120.3412±2.658 pg/ml) and reached a peak level of 290.9527±3.338 pg/ml at 4h, and then decreased in a time-dependent manner (Fig. 9E). There were no secretions of TNF-α and IL-6 in TNF-α KO (Fig. 9A) and IL-6 (Fig. 9F) KO mouse. VCAM and ICAM were induced in the liver with LPS-injected TNF-α (Fig. 10A) and IL-6 (Fig. 10C) KO mouse. Interestingly, VCAM and ICAM increased the level of mRNA in KO mice more than Balb/c. Next, I examined the transcriptional activation of proinflammatory cytokines in the liver of LPS-injected TNF-α and IL-6 KO mice. An increase in the RT-PCR products of proinflammatory cytokine mRNAs was detected (Fig. 10B, D). Next, I investigated by immunohistochemical staining whether an in vivo injection of LPS affects the expression of TLR4 and proinflammatory cytokines in the liver of TNF-α and IL-6 KO mice. As shown in Fig. 11A, the LPS-injected groups showed very slight expression of the TLR4 protein, similar to that of the PBS control. In addition, no staining of the TNF-α protein was seen in the liver of TNF-α KO mouse. However, as shown in Fig. 11B, the expression of TNF-α and TLR4 protein after LPS treatment was markedly enhanced by LPS in all regions of the liver of IL-6 KO mouse (Fig. 11B).
Cytokines induced LPS decreased PPARs and co-activators level of mRNA and protein in TNF-α and IL-6 knockout mouse
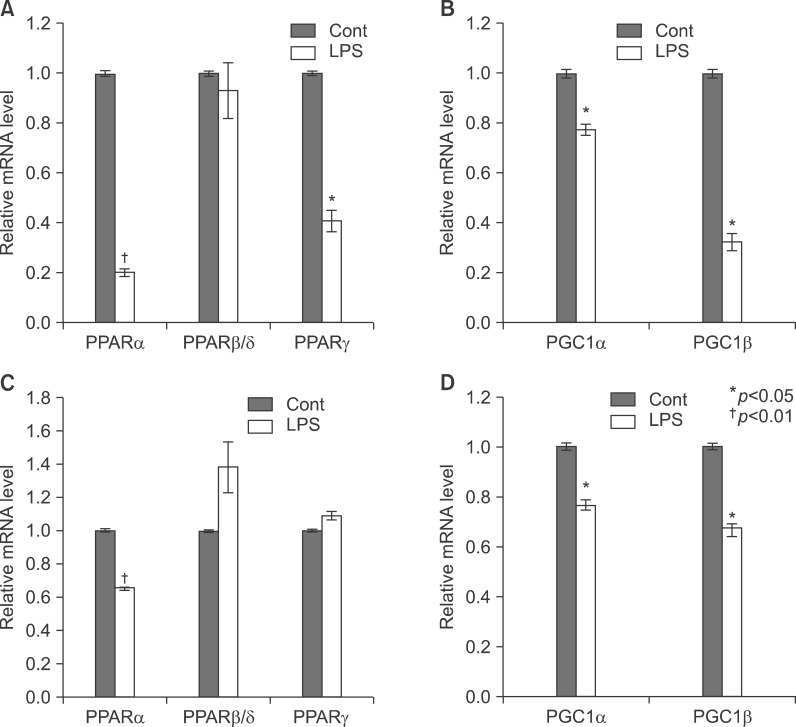
Next I examined the level of PPARs and coactivators mRNA in the liver with LPS-injected TNF-α and IL-6 KO mouse. As shown in Fig. 12A, LPS significantly decreased the mRNA levels of PPARα and PPARγ in the liver of TNF-α KO mouse. In addition, LPS only significantly decreased the mRNA levels of PPARα in IL-6 KO mouse (Fig. 12C). Moreover, PGC1α and PGC1β mRNA levels of LPS-treated mice decreased in the liver of TNF-α and IL-6 KO mice (Fig. 12B, D). Furthermore, LPS injection decreased the expression of PPARα protein in TNF-α and IL-6 knockout mice (Fig. 13A, B).
Pretreatment with fenofibrate attenuated leukocyte recruitment and liver injury after LPS
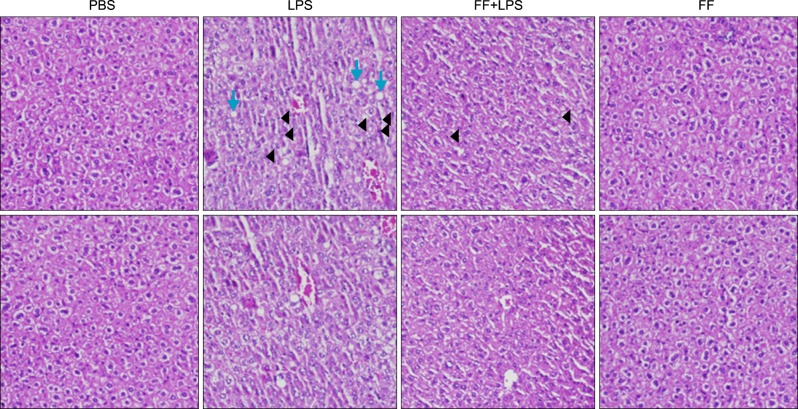
To explore the role of PPARα activation on LPS-induced proinflammatory cytokines and inflammation-related PPARs gene expression in the liver, I pretreated the mice with a PPARα agonist, fenofibrate, as described in Fig. 1B. The liver sections from mice injected with LPS alone or fenofibrate plus LPS were stained by hematoxylin and eosin. More pronounced liver injury was noted in mice treated with LPS. However, fenofibrate administrations produced notable block necrotic inflammation (arrow) and ameliorated leukocyte infiltration (arrowhead, Fig. 14).
Fenofibrate inhibited LPS-induced elevation of pro-inflammatory cytokines in serum and liver of Balb/c, TNF-α KO, and IL-6 mice
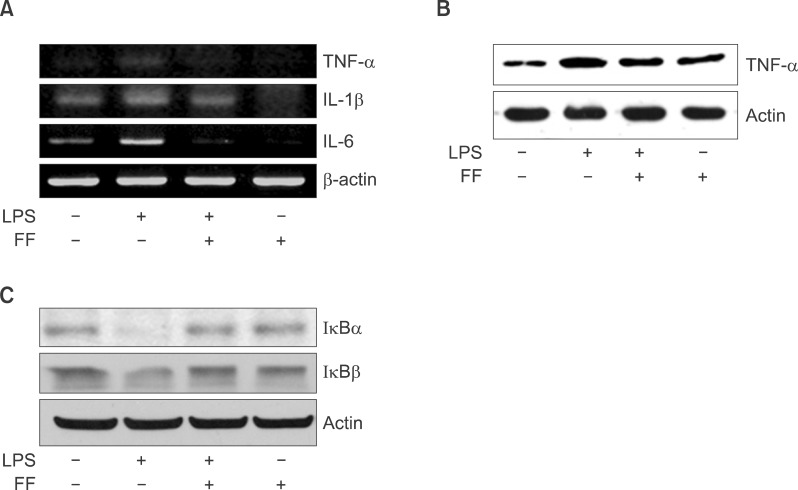
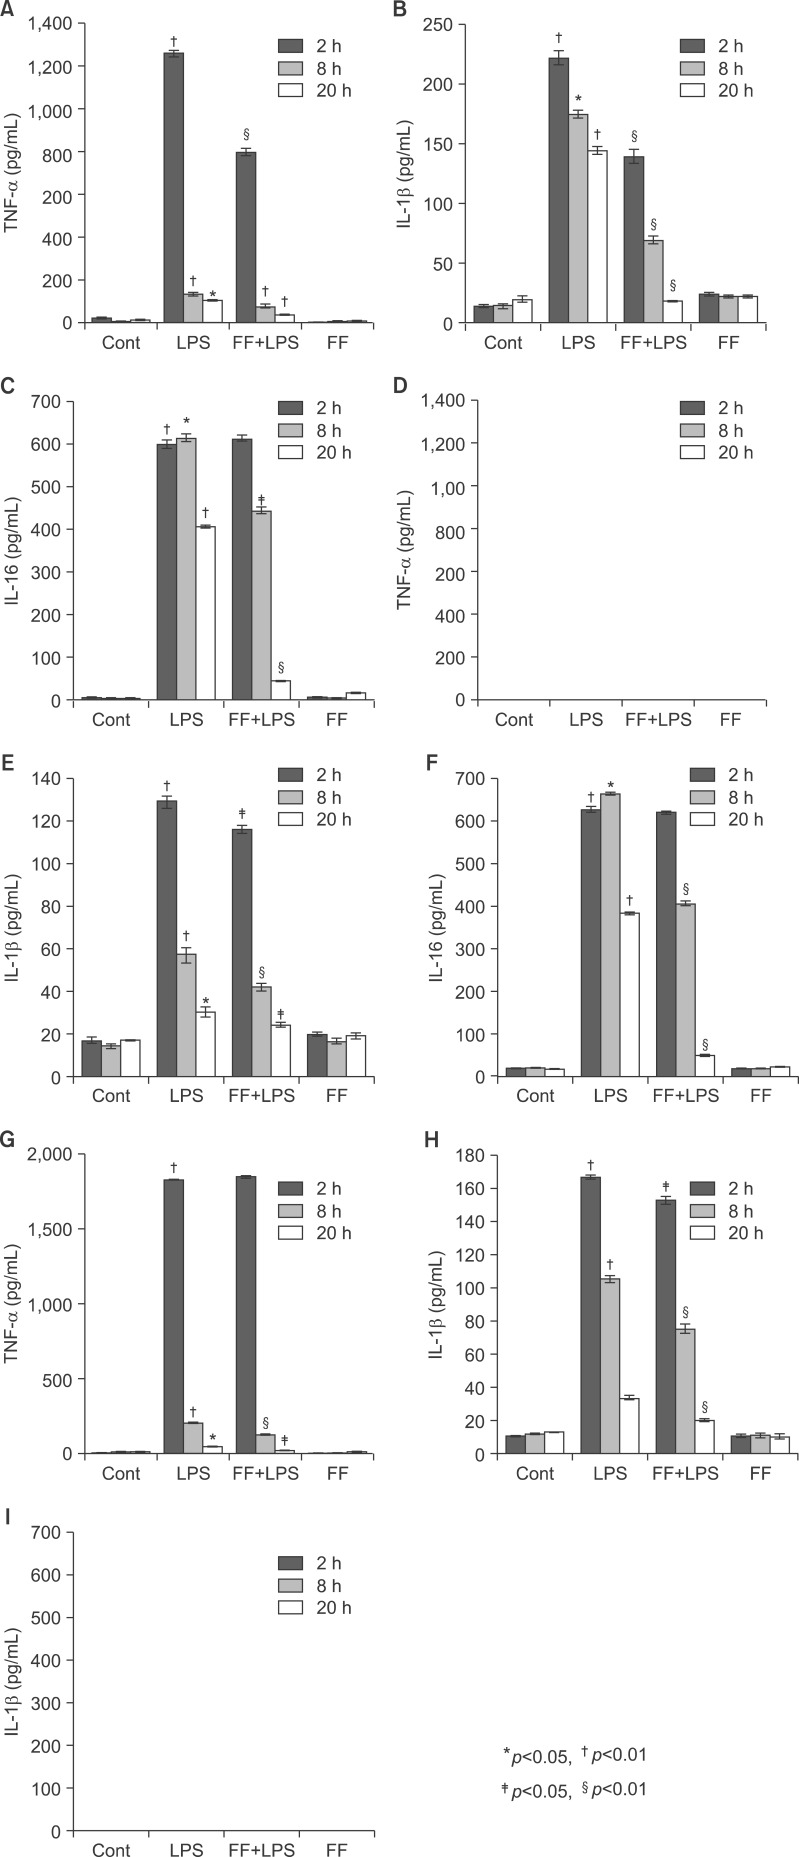
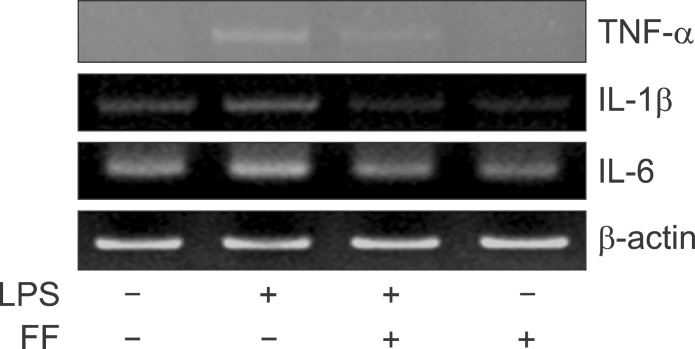
To gain further insight into the mechanisms underlying the proinflammatory profile blockade by fenofibrate, I injected fenofibrate as described in 'Methods'. As shown in Fig. 15A and B, LPS increased the proinflammatory cytokines mRNA level (TNF-α, IL-1β, and IL-6) and TNF-α protein level in the liver of Balb/c mouse. However, pretreatment of the liver with fenofibrate decreased the proinflammatory cytokines mRNA and protein level. I also checked the IκBα and IκBβ protein levels. LPS decreased the IκBα and IκBβ protein levels. However, fenofibrate blocked degradation of IκBα and IκBβ proteins (Fig. 15C). Next, In order to quantify the effect of fenofibrate on LPS-induced release of proinflammatory cytokines from serum, I surveyed the proinflammatory cytokines using the ELISA method in Balb/c, TNF-α KO and IL-6 KO mice. As shown Fig. 16A-C (Balb/c), injection of LPS resulted in a marked increase of TNF-α, IL-1β, and IL-6 secretion in the indicated times. However, fenofibrate significantly decreased the secretion of TNF-α, IL-1β, and IL-6. Fenofibrate alone did not change the secretion of proinflammatory cytokines. As shown Fig. 16D-F (TNF-α KO) and G-I (IL-6 KO), injection of LPS markedly increased proinflammatory cytokines. However, pretreatment with fenofibrate significantly decreased secretion of TNF-α, IL-1β, and IL-6.
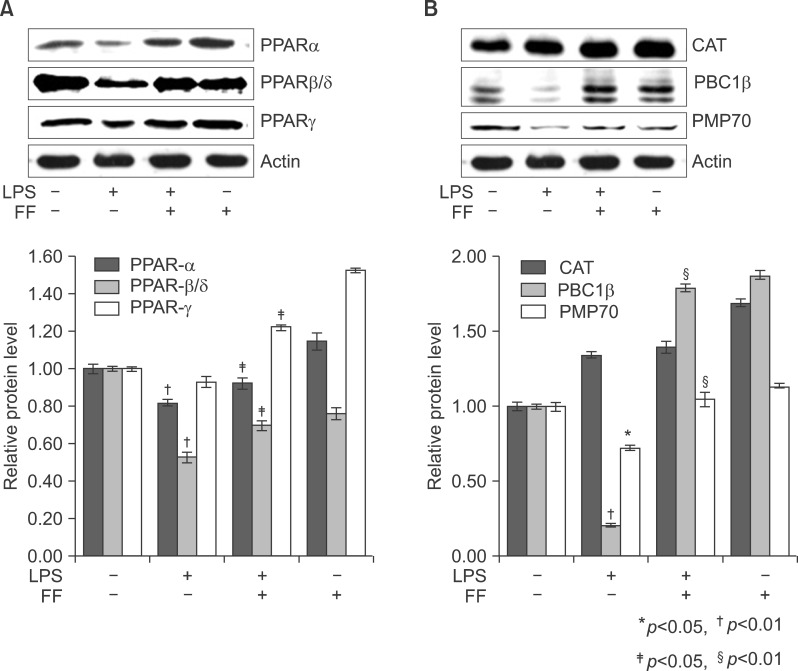
Fenofibrate inhibited LPS-induced decrease of PPARs in liver of Balb/c
To investigate if activated PPARα could lead to a dramatically reduced ability to degrade PPARs in response to LPS treatment, Western blot analyses were performed with anti-PPARα, PPARβ/δ, and PPARγ antibodies on total protein samples extracted from the liver with various treatments. Western blots revealed that the protein levels of PPARs were decreased in LPS-injected liver (Fig. 17A). Treatment with LPS induced rapid proteolysis of PPARs, and fenofibrate blocked proteolysis of PPARs. Fenofibrate treatment itself regulated the protein levels of PPARα and PPARγ without LPS stimulation. In addition, treatment with LPS decreased PGC1β and PMP70 proteins. However, treatment with fenofibrate blocked degradation of PGC1β and PMP70 proteins (Fig. 17B).
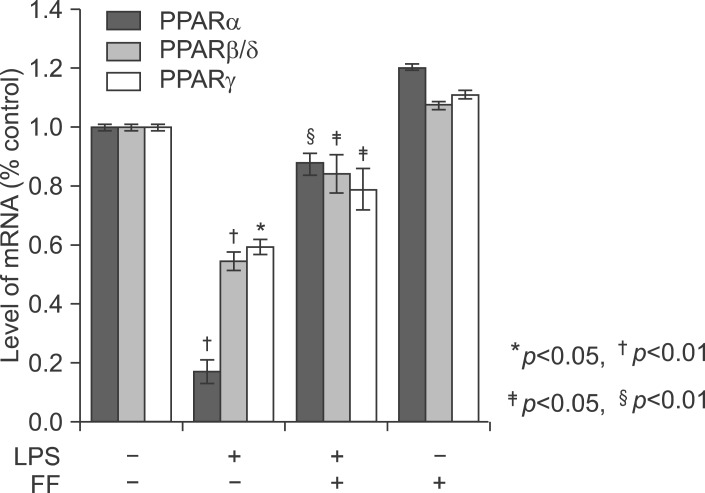
Pretreatment with fenofibrate elevated PPARs mRNA
LPS causes a decrease in PPARs including PPARα, PPARβ/δ, and PPARγ in the liver of Balb/c. The liver was pretreated with fenofibrate and further maintained with LPS for 20 h. As shown in Fig. 19, treatment with LPS resulted in a significant decrease. PPARα was the most inhibited. However, pretreatment with fenofibrate significantly increased PPARs mRNA levels.
DISCUSSION
In the present study, I report that LPS induces inflammation in the liver of Balb/c through the NFκB signal pathway as well as in TNF-α KO and IL-6 KO mouse. Furthermore, I demonstrate that LPS decreases mRNA levels of PPARs. However, fenofibrate, a PPARα agonist, attenuates the response of inflammation through blocking NFκB signaling. Finally, I show that fenofibrate regulates, at least in part, mRNA levels of PPARs.
Infection, inflammation, and injury induce the acute phase response, which results in a wide range of metabolic changes that are mediated by altered gene expression, caused primarily by the production of inflammatory cytokines including TNF-α, IL-1β, and IL-6.23 The mechanism of induction of the positive acute phase proteins has been studied in detail.24 Activation of the TNF/IL-1 receptors leads to activation of transcription factors such as NFκB and activator protein 1 (AP1) inducing class I positive acute phase proteins, whereas activation of the IL-6 receptor activates Janus kinase tyrosine kinase, which subsequently phosphorylates tyrosine residues of signal transducer and activator of transcription proteins inducing the transcription of class II positive acute phase proteins. LPS increases the recruitment of leukocytes into the liver and proinflammatory cytokines including TNF-α, IL-1β, and IL-6 in Balb/c. In addition, hepatocytes over expressed TLR4 and TNF-α through the JAK-STAT and NFκB signal pathway.
Previous studies have shown that the levels and DNA-binding activity of PPARα, and LXRα are significantly decreased during LPS-induced APR in the livers of Syrian hamsters. This decrease was accompanied by reduced expression of their target genes. In the present study, I demonstrate that LPS-induced inflammation decreases the levels of mRNA, PPARα, PPARβ/δ, and PPARγ in the liver of Balb/c. Moreover, the protein levels of PPARs decrease in the liver. These results indicate that proinflammatory cytokines can directly induce changes in the levels of PPARα, PPARβ/δ, and PPARγ in hepatic tissue.
LPS increases proinflammatory cytokines including IL-1β and IL-6 in TNF-α KO mouse. The mRNA levels also upregulate in the liver of TNF-α KO. LPS increases proinflammatory cytokines including TNF-α and IL-1β in IL-6 KO mouse. The mRNA levels also were upregulated in the liver of IL-6 KO. Interestingly, VCAM1 is highly expressed in the absence of TNF-α. However, ICAM1 is highly expressed in IL-6 KO.
LPS in vivo including Balb/c, TNF-α KO, and IL-6 KO mice differentially regulated PPAR isoforms. LPS-induced inflammation decreases all PPAR isoforms in Balb/c. However, inflammation significantly decreases PPARα and PPARγ in the liver of TNF-α KO mouse, and decreases PPARα and PPARβ/δ mRNA in IL-6 KO mouse.
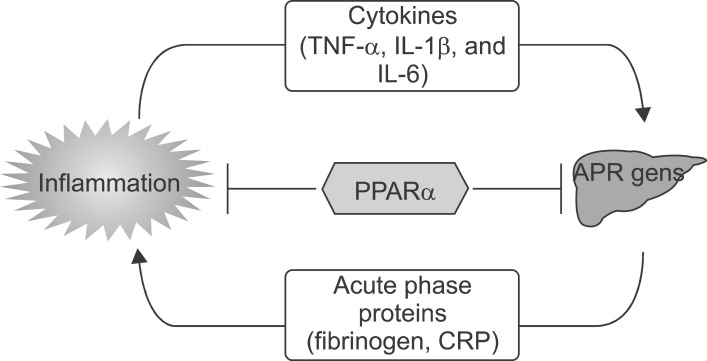
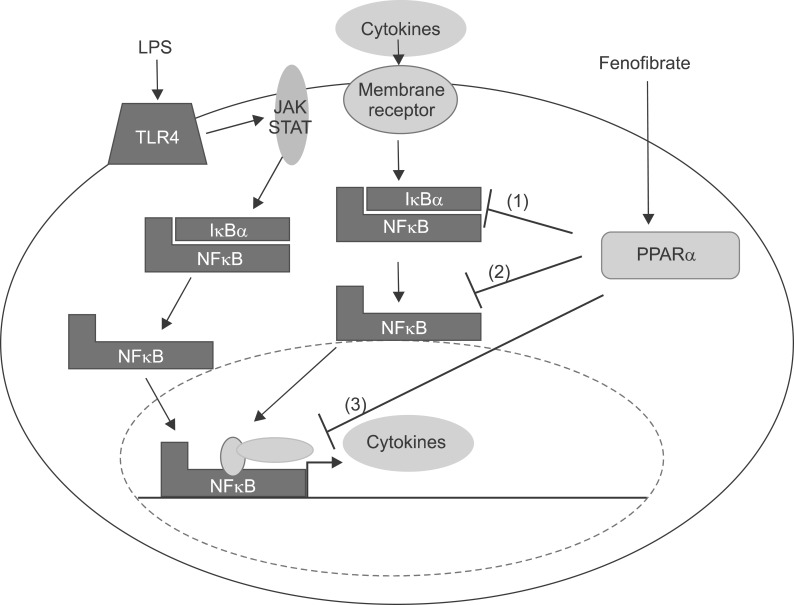
A role for PPARα as a general modulator of the inflammatory response was provided by Devchand et al.,25 who demonstrated that inflammation is prolonged in PPARα-deficient mice. Subsequently, PPARα was found to regulate the inflammatory response in vascular cells (Fig. 20). For example, PPARα activation results in the inhibition of the production of endothelin-1, vascular cell adhesion molecule (VCAM)-1, IL-6, and tissue factor in endothelial cells, smooth muscle cells, and macrophages.26-28 In vivo evidence of an antiinflammatory action of PPARα came with the demonstration that aortas from PPARα-deficient mice display an exacerbated inflammatory response to lipopolysaccharide stimulation. Because PPARα is highly expressed in the liver, a role for PPARα as a modulator of the inflammatory response at the hepatic level and the acute phase response was thereafter demonstrated (Fig. 20).14 The acute phase response is a generalized response of the organism to multiple disturbances of its physiological homeostasis, which is exacerbated under conditions of sepsis. Although inflammatory processes are important for the initiation of defense mechanisms,1 they can become deleterious under situations of chronic activation. Produced as part of systemic inflammatory reactions, IL-6 and IL-1 induce acute phase protein (APP) genes in liver cells, such as CRP, fibrinogen, serum amyloid A (SAA), and α2-macroglobulin2 Elevated levels of IL-6 and liver APPs are found in patients with acute coronary syndrome and reflect the inflammatory state.3 The expression levels of APPs are regulated by fibrates,29 which act via a PPARα-dependent mechanism.30 Hence, several acute phase response markers such as fibrinogen, CRP, SAA, α2-macroglobulin, and plasminogen are lowered after fenofibrate treatment in humans, whereas levels of albumin, a negative acute phase response protein, are raised.
Several studies have delineated the cellular and molecular mechanisms explaining the modulation of the hepatic inflammation response by PPARα activation (Fig. 21). Transcription of target genes by proinflammatory cytokines, such as TNF-α, IL-1, and IL-6 is mediated by several transcription factors acting alone or in combination. Among such transcription factors are CCAAT-enhancer binding proteins (C/EBP), signal transducer and activator of transcription proteins (STAT), the activator protein-1 (AP-1) complex including c-fos and c-jun, and the NFκB complex, which is most frequently composed of p50 and p65 proteins. Transcriptional activity is mediated by interaction with cofactors that remodel chromatin and bridge the DNA-bound transcription factors to the basal transcription machinery. Therefore, a decrease in cofactor availability would strongly affect transcription. This constitutes the first antiinflammatory mode of action of activated PPARα. For instance, through the binding and titration of GRIP1/TIF2, a coactivator for C/EBPβ, PPARα interferes negatively with IL-6 transcription induction. This mechanism may participate in the inhibition of several C/EBPβ/GRIP1-regulated APP genes by fibrates, including fibrinogen-α, fibrinogen-β, and serum amyloid A.30
Treatment with fenofibrate reduces cerebral infarct size caused by cerebral ischemia. Some fibrates, in particular fenofibrate, have been shown to inhibit complex I of the respiratory chain, suggesting a role of fenofibrate in mitochondrial dysfunction. Another hypothesis is that a high dose of fenofibrate may exert a massive antiinflammatory effect by inhibiting cytokines (TNF-α, interleukin-1) production. It is known that blockade of cytokines in the early phase is beneficial but their presence is also fundamental for the processes of tissue repair and regeneration.31
In this study, I report that treatment with fenofibrate, a PPARα agonist, improved the hepatitis cell damage and attenuated the recruitment of leukocytes. Fenofibrate blocked the level of proinflammatory cytokines through inhibiting IκBα and IκBβ degradation and inducing NFκB translocation in liver of Balb/c mouse and HepG2 cell. In addition, fenofibrate attenuates levels of proinflammatory cytokines in the serum of Balb/c, TNF-α KO, and IL-6 KO mouse. The present study also demonstrates that LPS-induced inflammation decreased PPARs mRNA levels in the liver, and fenofibrate significantly increased mRNA levels of PPARs.
 XML Download