

 PDF
PDF ePub
ePub Citation
 Print
Print


INTRODUCTION
Liver cirrhosis is a long-term consequence of chronic hepatic damage.1 Following repeated injury, the liver undergoes regeneration and fibrosis in the process of tissue remodeling. It is characterized by excessive accumulation of extracellular matrix, with the formation of scar tissue encapsulating the area of injury.2 No effective therapy but transplantation is currently available for this disease. Although it is effective, extensive clinical application is limited by the lack of donor organs.1,3,4 Thus, it is one of the great interests to search for an effective alternative treatment for this life-threatening disease.
Mesenchymal stem cells (MSCs) are defined as highly proliferating and adherent fibroblastic cells that have the potential to differentiated specific cells such as chodrocytes, osteocytes, adipocytes, hematopoetic stromal cells.5,6 Recent reports have shown that the MSCs have the capacity to differentiate into hepatocytes. Therefore, MSCs have been considered as an important source of stem cells for cell therapy. Subsequently, others have shown the hepatic engraftment of transplanted MSCs using sublethal animal models of liver injury and suggested the clinical potential of MSCs in the treatment of liver disease. These results indicate that MSCs are attractive cell sources for regenerative medicine.7,8 The cell-based hepatocyte transplantation is of particular interest and believed to hold great promise because of the simpler and less invasive procedure. There are increasing evidences in the literature suggesting mesenchymal stem cells as a transplantable source of hepatic progenitor cells.9,10
In recent years, there have been numerous studies that hepatocyte growth factor (HGF) is able to maintain the survival of MSCs and accelerate these effects.11-13 HGF has potent cytoprotective function on hepatocyte and stimulates the migration and proliferation of activated stem cell into parenchyma.14,15 Simultaneous implantation MSCs with HGF can improve liver regeneration, reduce the animal's mortality as well as have the potent anti-fibrotic effect in an experimental study.16 Some studies suggest that simultaneous implantation MSCs with HGF may be a novel therapeutic option for the treatment of liver fibrosis.9 However, early differentiation process of MSCs to hepatic lineage such as progenitor oval cell or matrix component cells has not been elusive yet.
Initially, it would be expected that HGF has a principle role in the differentiation process of hepatocyte and result in the acceleration of hepatic regeneration. The rats underlying liver cirrhosis were divided into 2 groups (group I: Isolated MSCs; group II: HGF-treated MSCs) according to the transplanted materials and compared with normal saline as control. These results contribute to our understanding of the stem cell's differentiation process and therapeutic potentials by comparing MSCs with HGF treated MSCs, will provide a new concept for the development of cell therapy-based strategies for the treatment of difficult-to-treat liver diseases.
Go to : 
METHODS
Preparation of mesenchymal stem cells
MSCs were provided by InVitrogene Corporation (rat mesenchymal stem cells, Invitrogen, USA). MSCs are extracted from isolated from the rat bone marrow are expanded using α-MEM glutamax Medium with 10% mesenchymal FBS (Invitrogen, MA, USA) at a density of 1×10⁶ cells in T25 culture flask, which supports a much shorter cell doubling time(36+/-4 hours) than traditional medium (DMEM+10% FBS), resulting in a cell doubling time of 54+/-4 hours. The medium was changed every 3-5 days and cells were maintained in humidified incubators at 37℃ with 5% CO2. After 1 week of culture, non-adherent cells were discarded and adherent cells were passed in weekly intervals by TrypLE Express (Gibco, Invitrogen, USA) for further studies. MSCs can be expanded to 3-4 passages before they lose their ability to grow or differentiate into all potential phenotypes.
TAA-induced liver fibrosis
Male, Sprague-Dawley (SD) rats, 100-150 g, purchased from Nara-Biotech (Korea) were used. Rats were maintained in an air-conditioned house with specific pathogen-free conditions, and were subjected to a 12:12-h daylight/darkness and allowed unlimited access to food and water. The 0.04% TAA (Sigma, St. Louis, USA) was administrated in the drinking water (400 mg TAA/L) with a standard solid diet for induction of liver fibrosis. Liver cells were stained with Hematoxylin & Eosin (H&E), Sirius-red, and Periodic Acid Schiff (PAS) for histological examination to evaluate the extent of the liver fibrosis or regeneration. The protocol was approved by Animal Care Committee of Asan Institute for Life Sciences, Seoul, Korea.
Transplanted materials to evaluate the hepatic fibrosis and repair
Rats underlying liver cirrhosis were divided into 2 groups (group I: Isolated MSCs; group II: HGF-treated MSCs) according to the transplanted materials and compared with Normal Saline as control.
Isolated MSCs
MSCs were harvested after culture for 3 or 4 passages and prepared MSCs were incubated in culture medium with CELL STALKER-CSR dye for overnight at 37℃, 5% CO2. After administration TAA for 8 weeks, MSCs without HGF were added via trans-splenic infusion. Animals were anesthetized, a 3 cm-long midline abdominal incision was made, and the abdominal cavity was exposed. Isolated MSCs was injected directly into the inferior tip of the spleen using 50 ul Hamilton syringe (Hamilton Company, Nevada, USA). A total of 2×10⁶/30 ul cells were injected per rat. The pinhole at the injection site was pressed for hemostasis. Subsequently, 1 ml of normal sterile saline was administered into abdomen as fluid replacement. The abdominal wall was closed in two layers in a running fashion. All procedures were performed under sterile conditions. The animals was raised for further 2 weeks, sacrificed in 10 weeks (8 weeks after TAA administration and 2 weeks after isolated MSCs transplantation via transsplenic puncture).
HGF-treated MSCs
MSCs were harvested after culture for 3 or 4 passages. Prepared MSCs were incubated in culture medium with CELL STALKER-CSR dye for overnight at 37℃, 5% CO2 and incubated with HGF (50 ng/ml) during 2 weeks extra. HGF-treated MSCs (2×10⁶/30 ul cells) were transplanted via transsplenic infusion. Animals were anesthetized, a 3 cm-long midline abdominal incision was made, and the abdominal cavity was exposed. HGF-treated MSCs was injected directly into the inferior tip of the spleen using 50 ul Hamilton syringe (Hamilton Company, Nevada, USA). The pinhole at the injection site was pressed for hemostasis. Subsequently, 1 ml of normal sterile saline was administered into abdomen as fluid replacement. The abdominal wall was closed in two layers in a running fashion. All procedures were performed under sterile circumstances. The animals were sacrificed in 10 weeks (8 weeks after TAA administration and 2 weeks after transplantation HGF-treated MSCs via direct splenic puncture).
Histological study
The animals were perfused with 300-400 ml of fixative containing 4% paraformaldehyde in 0.1 mol/L phosphate buffer (pH 7.4), and embedded in paraffin then cut into serial 5 µm thick sections. Liver tissue slices were fixed in 4% PFA solution and embedded in paraffin. Five micrometer thick histological cuts from the paraffin blocks obtained from all groups. The specimens were stained with H&E, Sirius-red, and PAS according to the standard protocols.
Immunohistochemistry
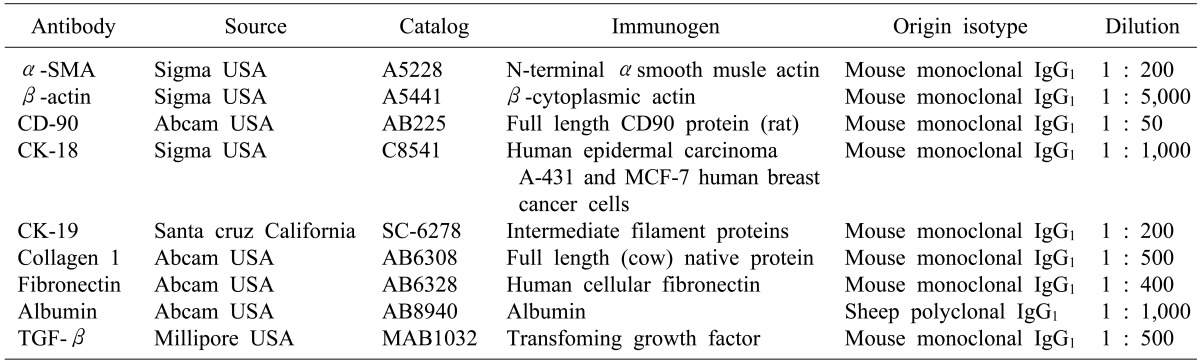
Fixed sections were permeabilized for 5 min with Triton X-100 (Merck) diluted to 0.5% in PBS. Endogenous peroxidase activity was quenched by incubating for 5 min in a solution containing 0.3% H2O2 in 10% methanol. Sections were blocked with 2% normal goat serum in PBS for 1 hr and incubated with primary antibodies at the indicated dilutions (Table 1) overnight at 4℃. For negative controls, primary antibodies were omitted or replaced with normal serum. On the following day, cells were incubated with secondary antibodies (biotinylated rabbit or mouse IgG [1 : 400; Vector, Burlingame, CA]) for 1 hour, followed by streptavidin horseradish complex (1 : 400; Vector) for 1 hour. Immunolabeling was visualized using a 0.05% 3,3 -diaminobenzidine/0.01% H2O2 mixture as a chromogen. For fluorescent stain, cells were incubated with secondary antibodies (FITC-, CY-3 rabbit or mouse IgG [1 : 500; Jackson Lacoratories]) for 1 hour 30 min. The results were evaluated by Leica TCS-SP2 and Laser scanner confocal microscopy.
Western blot analysis
Cells were lysed by adding sodium dodecyl sulfate-polyacrylamide gel electrophoresis (SDS-PAGE) sample buffer (62.5 mM Tris-HCl, pH 6.8, 2% SDS, 7.8% glycerol, 4.5% mercaptoethanol, and 0.1% bromphenol blue) and boiling for 5 minutes at 100℃. Lysates were clarified by centrifugation, and protein concentrations of supernatants were determined with bovine serum albumin as a standard. Proteins were separated by SDS-PAGE using the Laemmli buffering system with 4% stacking and 10% separating gels (70 min at 130 V), and transferred to nitrocellulose membranes with a Bio-Rad transfer unit (120 min at 200 mA). Protein blots were incubated in blocking buffer [2% BSA in Tween-20/Tris-buffered saline (TBS)] for 1 hr at room temperature on a rotating platform, then sequentially incubated with primary antibodies (overnight) and horseradish peroxidase-conjugated secondary antibodies (1 hr), followed by three washes. Immunoreactive bands were visualized by chemiluminescence reagents (Pierce, Rockford, IL). Optical density of bands was analyzed with an Imaging Densitometer (Bio-Rad GS-670).
Statistical analysis
Adobe Photoshop 7.0 (Adobe Systems, Mountain View, CA) was used to optimize image quality and to prepare figures. The data were analyzed by a one-way ANOVA with a Tukey-Kramer multiple comparison post hoc test in GraphPad Instat 3.05 (GraphPad, San Diego, CA). Each value is expressed as mean SEM, and p<0.001 was considered significant.
Go to :
RESULTS
Histological differences between the TAA/MSCs and TAA/HGF-treated MSCs
Light microscopy demonstrated typical histopathologic changes indicative of persistent liver damage. TAA induced liver fibrosis became more intense and severe by 8 week, with moderate bile duct proliferation and fibrotic nodules (Fig. 1), which are more or less aggravated after Normal saline infusion in control group. Less hepatic fibrosis and more hepatocyte regeneration were detected in isolated stem cell group compared to normal saline or HGF-treated MSC group. Contrary to our expectation, HGF-treated MSCs group is not remarkable to Normal saline group in regard to the extent and degree of hepatic repair (Fig. 1).
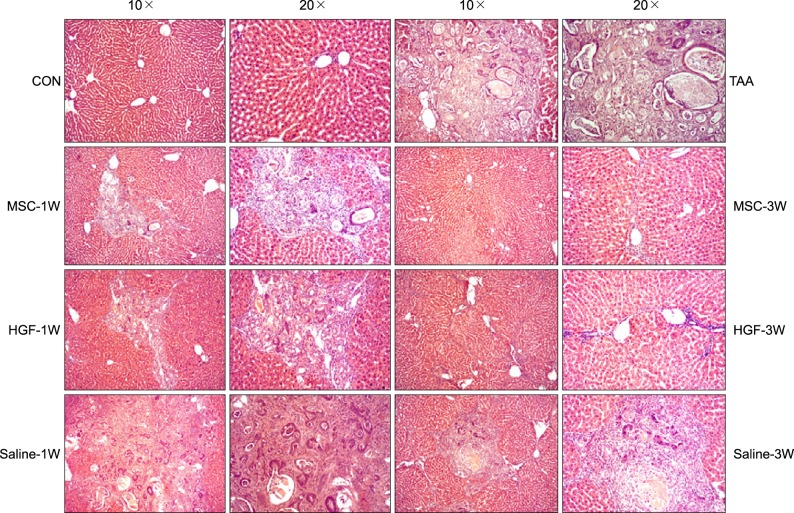 | Fig. 1Histological appearances in the TAA-induced cirrhotic livers. For comparing isolated MSCs group with normal saline group or HGF-treated MSC group, each specimen was stained with H&E stain (Original magnification: ×10, ×20); more prominent hepatocyte regeneration and decreased hepatic fibrosis were detected in isolated MSCs group, but not normal saline or HGF-treated MSCs group.
|
To assess fibrotic liver cells, paraffin sections were subjected to PAS staining, control group demonstrate demonstrated that glycogen-stained hepatocytes with PAS staining was reduced and depicted a strongly time-dependent lack of glycogen (Fig. 2). Isolated MSCs group demonstrated a diffuse and homogeneous pattern of PAS staining for glycogen (Fig. 2). Less hepatic fibrosis, more glycogen storage was detected in isolated stem cell group, compared to HGF-treated stem cell group (Fig. 2).
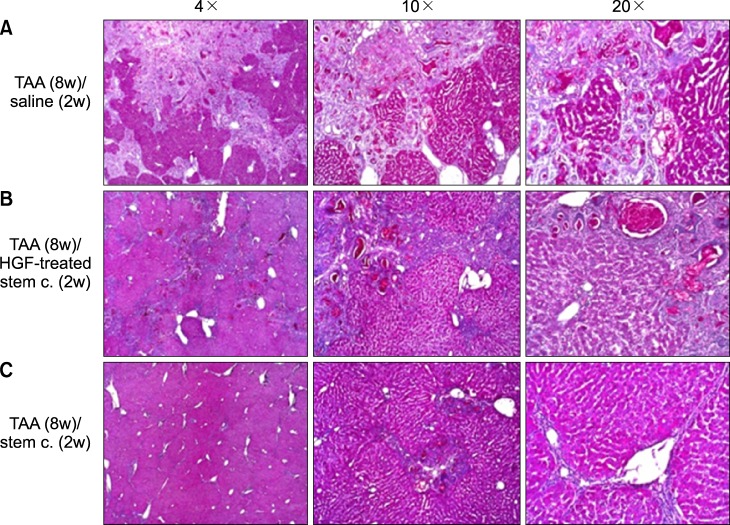 | Fig. 2Histological appearances in the TAA-induced cirrhotic livers. For comparing isolated MSCs group with normal saline group or HGF-treated MSC group, each specimen was stained with PAS stain (Original magnification: ×4, ×10, ×20); more prominent hepatocyte regeneration and glycogen storage were detected in isolated MSCs group, but not normal saline or HGF-treated MSCs group.
|
Histopathologic analysis with Sirius-red staining demonstrated almost normalization of liver architecture in isolated MSCs group within 10 weeks of MSCs administration (Fig. 3). Alleviated septal fibrosis and less collagen deposition were detected in isolated MSCs group, thickened fibrosis and more collagen deposition in normal saline or HGF-mediated MSC group. The difference between HGF-treated MSC group and control group was not prominent unexpectedly (Fig. 3).
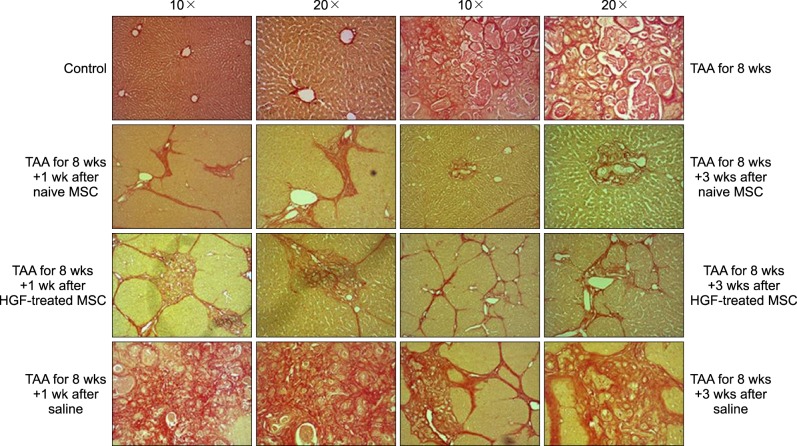 | Fig. 3Histological appearances in the TAA-induced cirrhotic livers. For comparing isolated MSCs group with normal saline group or HGF-treated MSC group, each specimen was stained with Sirius-red stain (Original magnification: ×10, ×20); Alleviated septal fibrosis and less collagen deposition were detected in isolated MSCs group, thickened fibrosis and more collagen deposition in normal saline or HGF-treated MSCs group.
|
To assess the degree of hepatic fibrosis, expressed amount of collagen α-1 and fibronectin were measured using Western blot analysis and RT-PCR study. During thioacetamide ingestion, there was a time-dependent increase in expressed amount of collagen α-1 and fibronectin. After MSC implantation, however, a expressed amount of collagen and fibronection in fibrotic areas was decreased from week 1 to week 3. In contrast, expressed amount of collagen and fibronection in saline-injected rats increased still. Western blot analysis and RT-PCR study for collagen α-1 also supported these serial changes of fibrosis (Fig. 4).
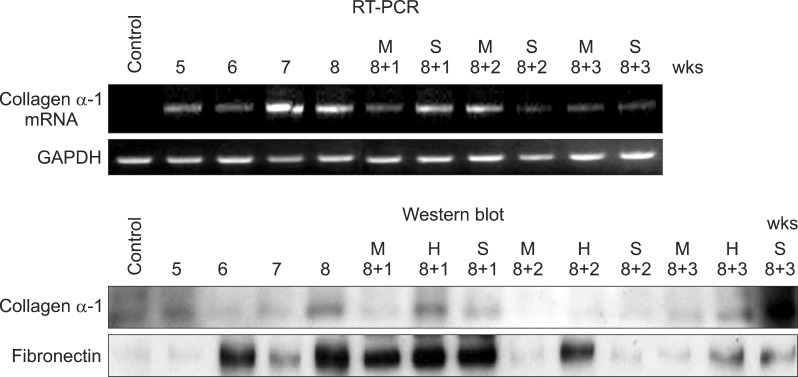 | Fig. 4Western blot analysis and RT-PCR study also showed these serial changes of fibrosis, Quantification of fibrosis induction and MSC-associated effects were assessed through antibody studies for collagen α-1 and fibronectin and RT-PCR for collagnen α-1 messanger ribonucleic andi (mRNA). The expressed amount of collagen α-1 and fibronectin were increased in 8 weeks after TAA ingestion and more decreased in additional 2 weeks after MSC infusion, contrary to control group.
|
The change and migration of stem cell after HGF-treatment
To evaluate differentiation of HGF-treated MSC into functional hepatocytes, we demonstrated the expression of albumin by high resolution fluorescent microscopy at 2 weeks after injection. Green autofluroresence in HGF-treated stem cells indicate the differentiation to hepatocyte and albumin expression, red autofluroresence indicated stem cell itself without differentiation (Fig. 5).
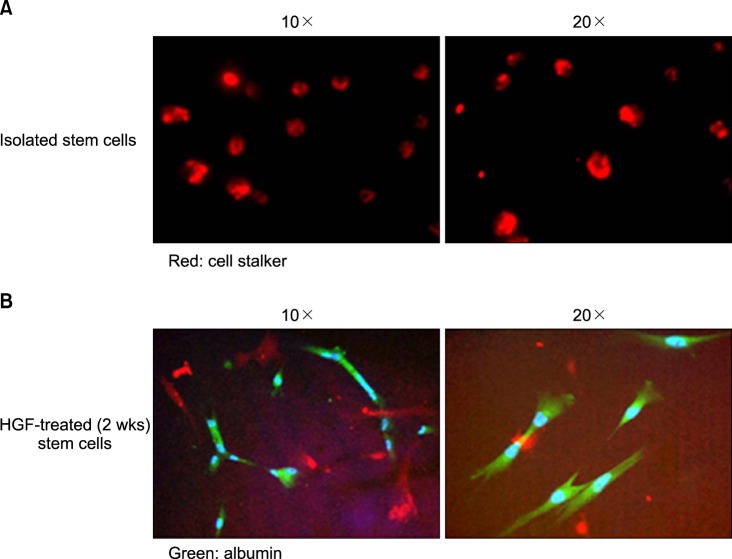 | Fig. 5Fluorescence microscope image showed that stem cells differentiate to hepatocyte and express the albumin in 2 weeks after HGF treatment. (A) Stem cells themselves without differentiation to hepatocyte-like cell (CELL STALKER-CSR dye staining, red; Original magnification: ×10, ×20). (B) Stems cells with differentiation to hepatocyte and albumin expression (Anti-albumin staining, green; Original magnification: ×10, ×20).
|
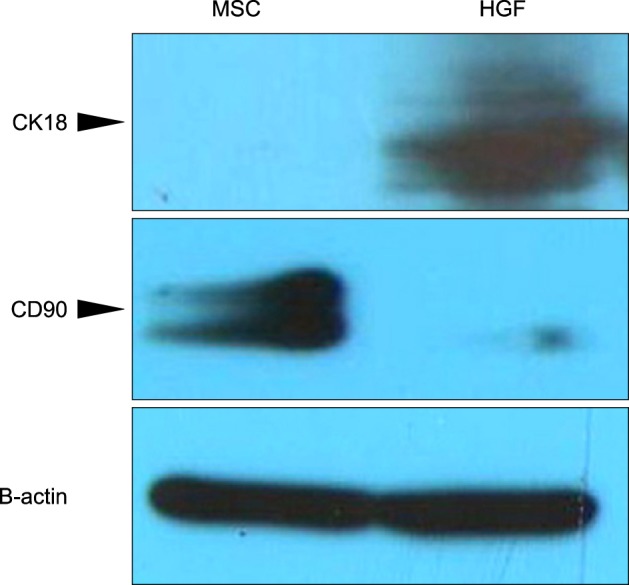
Protein expression of CK18, CD90 and β-actin in the cells was analyzed through western blot analysis (Fig. 6). The protein bands for specific hepatic markers (CK-18) were visible in HGF-treated MSCs. The protein bands of specific stem cell marker (CD 90) were visible in Isolated MSCs. β-SMA is common in both group. Western blot analysis indicated that these specific markers were actively synthesized before and after hepatic differentiation. HGF-treated MSCs became the CK18-positive and Isolated MSCs CD90-postive (Fig. 6).
To identify Transplanted donor cell distribution to the recipient liver. We demonstrated CELL STALKER-CSR dye staining and the expression of albumin by high resolution fluorescent microscopy at 1 and 3 weeks after injection. Red autofluorescence is mainly localized near the sinusoids in stem cell group and scattered away the sinusoids in HGF-treated stem cells group, which indicate the migration of stem cells during the differentiation process (Fig. 7).
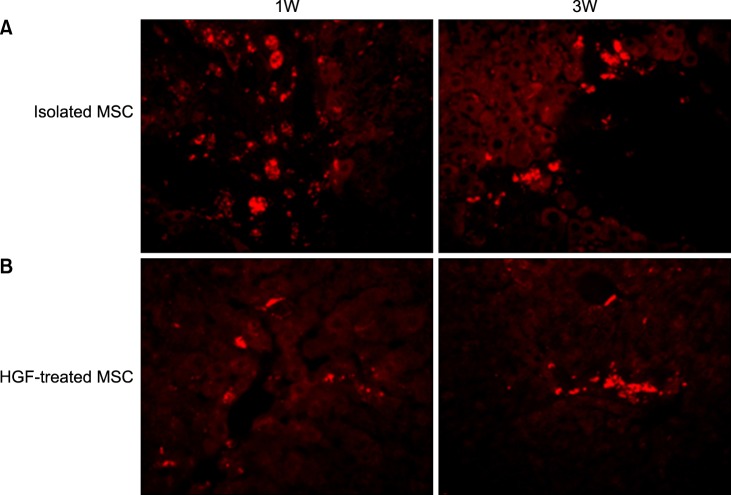 | Fig. 7Transplanted donor cell distribution to the recipient livers. High fluorescence microscope images (×20). (A) A number of Red autofluorescence is mainly localized near hepatic sinusoids in stem cell group, which indicated better engraftment (B). A few red autofluorescence is localized near peripheral hepatic sinusoids in HGF-treated stem cells group, indicated poor engraftment.
|
Comparing the serial differentiation phase between Isolated MSCs and HGF-treated MSCs
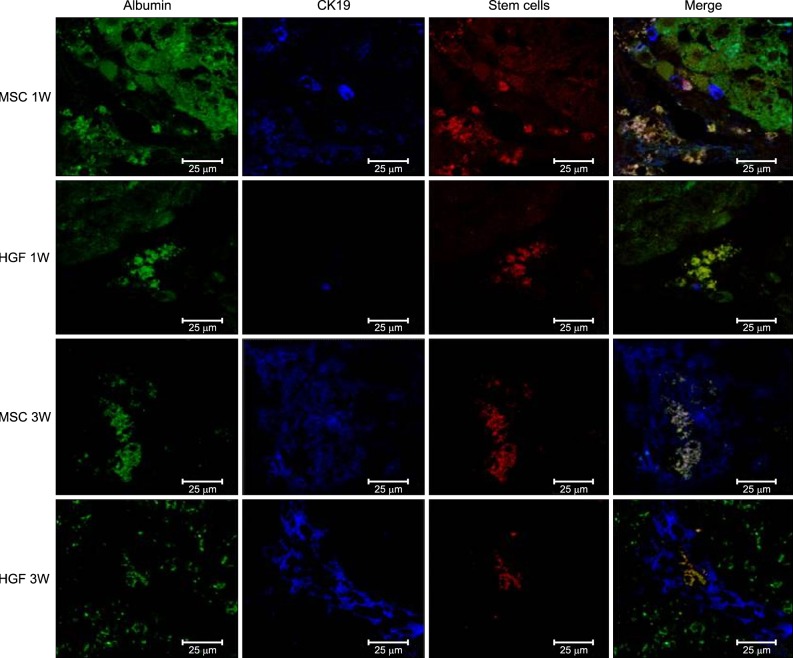
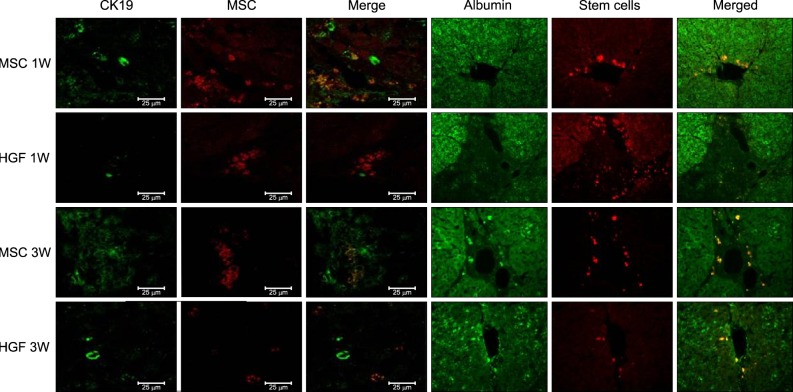
Hepatogenic differentiation of implanted MSCs was determined by immunohistochemistry using antibodies to albumin and CK19. Using CELL STALKER-CSR dye to detect MSCs, we found that these cells co-localized with antibodies to CK19- or thy1-stained oval cells and albumin (Fig. 8). One week after MSC implantation, CK19 stained oval cells derived from MSCs were located around the portal veins. At 3 weeks, more differentiated MSCs or hepatocyte-like cells were located toward the hepatic parenchyma, and albumin-stained areas had expanded and overlapped the MSC-stained areas. Nearly all the CK19/thy1- and albumin-stained areas overlapped the MSC-stained areas, indicating that most MSCs had transdifferentiated into oval progenitor cells and then into functional hepatocyte-like cells after hepatic implantation. HGF-treated MSCs differentiated into hepatocyte without the oval cells phase (Fig. 9). Isolated MSCs in the merged image demonstrate co-localization of CK-19 containing vesicles and stem cell, which mean sequential differentiation (i.e., MSCs differentiate to hepatocyte-like cell via oval cell phase).
 | Fig. 8Transplanted donor cell engraftment to the recipient liver and differentiation into the hepatocytes. High fluorescence microscope images (×20). Anti-CK19 staining, green. MSCs with CELL STALKER-CSR dye staining, red. Albumin positive stem cells in the merged images, yellow. Hepatogenic differentiation-related analyses showed that infusion of isolated MSCs advanced the appearance of oval cells in 1 week, leading to a higher population of hepatic progenitor cells and a lower population of MSCs at 3 weeks.
|
 | Fig. 9Transplanted donor cell engraftment to the recipient liver and differentiation into the hepatocytes. High fluorescence microscope images (×20). Hepatogenic differentiantion of implanted MSCs was assessed by immunohistochemistry using Antibody to albunin, CK-19 and CELL STALKKER-CSR dye to assess the MSCs. One week after MSC implantation, CK19 stained oval cells derived from MSCs were located around the portal veins. At 3 weeks, more differentiated MSCs or hepatocyte-like cells were located toward the hepatic parenchyma, and albumin-stained areas had expanded and overlapped the MSC-stained areas. Nearly all the CK19/thy1- and albumin-stained areas overlapped the MSC-stained areas, indicating that most MSCs had transdifferentiated into oval progenitor cells and then into functional hepatocyte-like cells after hepatic implantation.
|
α-SMA is not only a marker for activated hepatic stellate cells, but also for portal myofibroblasts. TUNEL represents a rather specific marker with respect to hepatic stellate cells degradation and fibrosis repair. At 1 week after MSC injection, there were some TUNEL-positive non-stellate cells, but its proportion decreased after 3 weeks. This finding indicates that the proportion of stellate cells among TUNEL-positive cells increased although total amount of TUNEL-positive cells decreased after 3 weeks (Fig. 10). To evaluate the extent of the hepatic fibrosis and repair by High fluorescence microscope images, Isolated MSC groups express lower α-SMA, higher TUNEL and albumin expression, which have much abilities to increase the appotosis of hepatic stellate cells and restore the hepatic fibrosis compared with HGF-treated MSCs (Fig. 10).
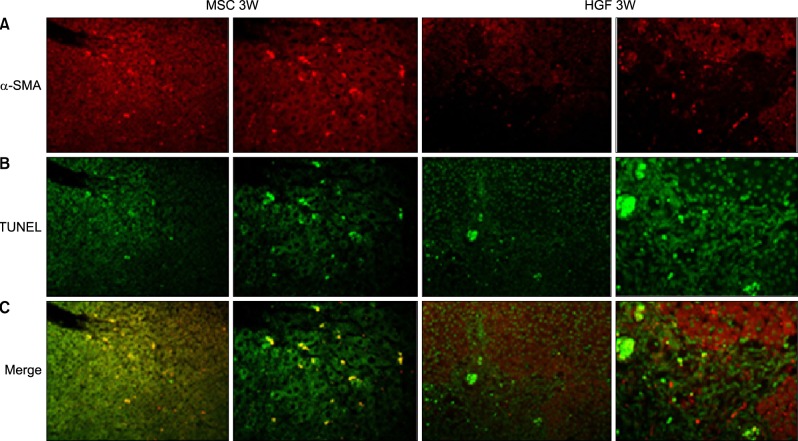 | Fig. 10Hepatic fibrosis and repair by transplanted donor cell engraftment to the recipient liver. High fluorescence microscope images: Engrafted isolated MSC groups express lower α-SMA and higher TUNEL compared with HGF-treated MSCs group. (A) Anti-α-SMA staining, red. (B) TUNEL staining, green. (C) α-SMA and TUNEL positive stem cells in the merged images, yellow. The merged images of TUNEL and α-SMA stains also revealed that apoptosis of hepatic stellate cells was less evident after HGF treatment.
|
Go to :
DISCUSSION
The end-stage of liver disease, such as hepatic failure, end-stage cirrhosis and infections present a major health concerns. Given the shortage of organs for liver transplantation, an increasing emphasis is being placed on cell-based liver therapies. Some of these therapeutic approaches have been moderate or short-term success.17,18 But, hepatocyte transplantation has not evolved as a viable alternative to liver transplantation, due to difficulty in a large amount of high-quality hepatocyte collection from the same donor liver. In addition, the in vitro culture of hepatocytes for transplantation is demanding and inefficient.19
Stem cells are therefore considered to be a potential alternative for liver-directed cell therapies since it has been reported that various kinds of stem cells were able to differentiate into functioning cells of various mature tissues including hepatocytes.20,21 MSCs were shown to have multiple beneficial effects in vitro that were relevant in a therapeutic context, including hepatocellular functional support, secretion of molecules that inhibit hepatocyte apoptosis, and modulation of an acute phase response by hepatocytes cultured in ALF-induced serum. BM-derived MSCs were isolated and expanded in adult rats and their multiple differentiation potential was also confirmed in vitro.8,17,18 Stem cell-derived hepatocytes may be an alternative cell source to treat liver diseases or to be used for pharmacological purposes currently.
HGF was originally reported in 1984 to be a mitogenic protein for mature hepatocytes in primary culture. HGF is a mesenchymal-derived cytokine that acts as mitogen, motogen, and morphogen in various target cells.22-25 HGFs ares expressed primarily by a variety of mesenchymal cells, including fibroblasts, hepatic stellate cells, smooth muscle cells, and endothelia, but also by megakaryocytic and myeloic lineages.26 HGFs are classical mediator of mesenchymal epithelial interactions.27,28 The important biological role of HGF is emphasized by the finding that mice that are transgenic for the HGF gene recover their original parenchymal liver cell mass twice as fast as controls after partial hepatectomy,29 Dong et al.30 insisted that HGFs are essential for the initiation of hepatic differentiation. HGF are the key cytokines involved in the liver-injury conditioned medium for the hepatic differentiation of BM-MSCs. Nishino et al.31 insisted that HGF gene transfer significantly improved survival after partial hepatectomy in the cirrhotic rats, HGF gene transfer to cirrhotic livers improves liver failure-associated death after partial hepatectomy by upregulating expression of an antiapoptotic protein, Bcl-xl. Yu et al.32 found that MSCs implantation with HGF significantly inhibited the formation of liver fibrosis in rats undergoing small for size liver transplantation, while MSCs implantation with HGF had synergistic effects in the process. Most modes have been indicated to synergistic relationships, which HGF not only stimulates hepatic regeneration but also accelerates liver function, improves fibrosis, and protects liver cells against injury.31,33-35 But, much more interesting is the difference between our results and previously stated contents.
In this study, after rats were treated with oral administration of TAA for 8 weeks, the liver exhibited a marked increase in extracellular matrix content and displayed bundles of collagen surrounding the lobules leading to large fibrous septa. But In 2 week later after implantation of MSCs, Less hepatic fibrosis and more hepatocyte regeneration were detected in isolated stem cell group compared to normal saline or HGF-mediated MSC group (Fig. 1C). Histopathologic analysis demonstrated almost normalization of liver architecture in isolated MSCs group within 10 weeks of MSCs administration (Fig. 3C). Alleviated septal fibrosis and less collagen deposition were detected in isolated MSCs group, thickened fibrosis and more collagen deposition in normal saline or HGF-mediated MSC group. The difference between HGF-treated MSC group and control group was not prominent (Fig. 3B and 3C).The extent and degree of hepatic repair is similar or a little better in HGF-treated MSCs group compared with Normal saline group (Fig. 1B), rather much decreased in HGF-treated MSCs group compared with isolated MSCs group unexpectedly. It is not clear why hepatic repair is more prominent in isolated MSCs group compared with HGF-treated MSCs group.
Recently, considerable doubt has been cast over the synergic effect between mesenchymal stem cell and HGF. Ren et al.36 insisted that human MSC can differentiate into hepatocyte-like cells but do not accelerate the capillarization and venularization of hepatic sinusoids, finally leading to the partial improvement of liver function in mice with CCl4-mediated chronic liver fibrosis. Baertschiger et al.37 insisted MSC differentiated into myofibroblasts with development of fibrous tissue, when transplanted into an injured or regenerating liver, which indicate that MSC in certain circumstances might be harmful due to their fibrogenic potential.
There are several studies that emphasize about the micro-milieu such as spatial configuration, cell to cell reaction to related to cell differentiation. Qihao et al.38 insisted that the co-culture microenvironment plays a decisive role for the hepatic differentiation of MSCs and it is more efficient than HGF treatment, which emphasize on cell to cell reaction in regard to hepatic differentiation. Lange et al.39 insisted that the rat MSCs from bone marrow can differentiate hepatocytic cells in the presence of fetal liver cell in vitro and the presence of MSCs in co-cultures also provides a beneficial environment for expansion and differentiation of fetal liver cell. Differentiation of stem cells might be tightly regulated by the microenvironment which is mainly composed of non-parenchymal cells. Deng et al.40 investigated fully activated hepatic stellate cells could modulate MSCs differentiation into hepatocyte-like cells. As organogenesis is not only dependent upon soluble factors but also cell-cell interactions, development of 3-dimensional culture systems wherein the anatomical features of developing liver lobules are recreated and the use of bio-reactors making it possible to more closely control physiological parameters such as pH and glycemia, may be needed to allow the creation of hepatocytes with fully mature characteristics and functions. The in vitro culture system still does not recreate all signals present in vivo that govern a coordinated maturation from pluripotent cells to terminally differentiated mature hepatocytes, despite the use of cytokine cocktails known to play a role during liver development.
To evaluate the extent of the hepatic fibrosis and repair by high fluorescence microscope images, Isolated MSC groups express lower α-SMA, higher TUNEL and albumin expression, which have much abilities to increase the appotosis of hepatic stellate cells and restore the hepatic fibrosis compared with HGF-treated MSCs (Fig. 8). α-SMA is not only a marker for activated hepatic stellate cells, but also for portal myofibroblasts. TUNEL represents a rather specific marker with respect to hepatic stellate cells degradation and fibrosis repair. It seems that Mature hepatocyte have a less powerful potentials such as, albumin synthesis, repair of fibrosis than mesenchymal stem cell. It is interesting that MSCs have more potent capacity compared with mature hepatocyte. This suggests that there are more important things in early or intermediate differentiation process of stem cell before maturation that have not clarified.
The mechanisms by which MSCs repair the fibrosis are still unclear. Fang et al.41 found that although albumin-positive donor-derived cells were present at lower frequency in sections of CCL4-induced liver tissues, infusion of FLK1+ murine MSCs might ameliorate liver fibrosis.
Ortiz et al.42 observed that MSCs administration reduced the degree of bleomycin-induced inflammation and collagen deposition within lung tissue, but male donor DNA accounted for 2.21×10⁻⁵% of total lung DNA in female recipient mice with MSCs treatment. Some studies insisted that engrafted MSCs scattered mostly in the hepatic connective tissue but did not differentiate into hepatocytes expressing human albumin or alpha-fetoprotein. Instead, these engrafted, undifferentiated MSCs secreted a variety of bioactive cytokines that may restore liver function and promote regeneration.43 Although the current study did not explain how the MSCs have more potential comparing with mature hepatocytes, this study support that MSCs have more powerful anti-fibrosis, regenerative effects in injured liver.
There has been a great deal of research on the development of stem cell, the intermediate phase remained unclarifed. Roelandt et al.44 supports the stepwise differentiation of human embryonic stem cells to cells with characteristics of primitive streak, mesendoderm definitive endoderm, hepatoblasts, and finally cells with phenotypic and functional characteristics of hepatocytes, Li et al.45 have previously developed a growth-factor-free co-culture method and observed rat MSCs differentiated into hepatic progenitor cells. Co-cultured MSCs had stayed at hepatic progenitor stage until week 3, and differentiated into hepatocytes or bile-ductal epithelial cells.
Remarkably, some studies proved the differentiation of rat multipotent adult progenitor cells to hepatocyte-like cells, even though rMAPC are isolated clonally from cultured rat bone marrow (BM) and have characteristics of primitive endoderm cells, which will be useful for generating hepatocyte-like cells from rodent and human stem cells, and to gain insight into the early stages of liver development.44 Until recently, there has been quite unknown process to clarify the early differentiation phase of stem cell.
The results of this study demonstrated that migration and engraftment of MSCs to the injured liver area, and differentiation into functional hepatocytes from 1 to 3 weeks. Localization of differentiation cells derived from transplanted MSCs was time-dependent changed from around centrilobular hepatic veins to parenchyma. Isolated MSCs is mainly localized in sinusioids, HGF-treated stem cell is scattered away to parenchyma in 3 weeks. MSCs transdifferentiated into CK-19 postive oval cells and then to albulmin-producing hepatocytes, HGF-treated MSCs differentiated into hepatocyte without the intermediate oval cells phase. HGF treated MSCs became the CK18-positive, MSCs became CD 90-positive.
At present, hepatocyte transplantation has long been recognized as a potential treatment for life-threatening liver disease. The potential of hepatocyte transplantation remains largely doubtful yet. Authors investigated various parameters expressing more success and efficacy of using MSCs than mature hepatocyte as an alternative cell source to hepatocyte transplantation for treatment of liver disease. Unfortunately, this study leave the unanswered the question why differences occurring between Isolated MSC and HGF-treated MSC and following mechanisms. Authors learned that there are unidentified events in early differentiation process of stem cell that play a major role in hepatic linage cell function. More studies are needed to illuminate the early phase of stem cell differentiation, only suggesting the new concept of MSC-related effect in this model.
Significant heptocyte differentiation occurred in not HGF-treated MSCs but isolated MSCs groups unexpectedly. These results suggest that the beneficial effect of MSC on in a rat model with thiacetamide-induced cirrhosis may occur during early differentiation course of MSCs, mature hepatocyte itself has a little effect on the acceleration of hepatic lineage cell differentiation. Further studies focused on the early process of differentiation may elucidate the new mechanism underlying MSC-associated effects.
Go to :
 XML Download