

 PDF
PDF ePub
ePub Citation
 Print
Print


Abstract
Figures and Tables
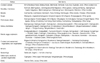
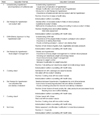
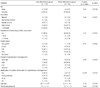
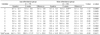
Table 4
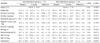
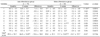
Table 5
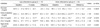
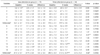
Table 6
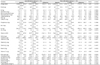
1) Mean ± SD
2) Mean % of RNI(Recommended Nutrient Intake for Dietary Reference Intake for Koreans)
*: p < 0.05, **: p < 0.01, ***: p < 0.001 by paired t-test between baseline and 8 weeks within group
#: p < 0.05, ##: p < 0.01 by t-test between differences of less attendance and more attendance group
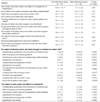
Table 7
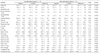
Table 8
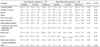
Table 9
1) Mean ± SD
2) Summated score of each item. Full score = 100, the correct answer for each question was scored 10, incorrect answer 0
*: p < 0.05, **: p < 0.01, ***: p < 0.001 by paired t-test between baseline and 8 weeks within group
1. Nutrition labeling shows sodium contents of processed food
2. Canned foods and instant foods contain lots of sodium
3. Using spices such as vinegar, mustard or soybean sauce instead of salt can reduce sodium intake
4. Salt substitute is a good way to reduce sodium intake
5. Increased risk of hypertension is associated with high level of serum triglycerides
6. Having family history of hypertension can elevate incidence of hypertension to descendent
7. Lowering body weight can reduce blood pressure
8. All the elderly has high blood pressure
9. Stress can lead to elevate blood pressure
10. Pregnancy can lead to elevated blood pressure in females
Table 10
1) Mean ± SD
2) Summated score of each item. Total score = 100, 'yes' answer for each item was scored 10, 'no' answer 0
*: p < 0.05, **: p < 0.01, ***: p < 0.001 by paired t-test between baseline and 8 weeks within group
##: p < 0.01 by t-test between differences of less attendance and more attendance group
1. Enjoy dried seafood or seasoned fish
2. Enjoy salted fish such as salted spicy pollack roe
3. Enjoy cooked rice topped with seasoned meats/seafood or one-dish meal
4. Usually eat all the broth of soup or stew
5. Enjoy instant foods such as ramyon, canned food, or ham.
6. Eating-out or taking delivery dishes more than twice a week
7. Enjoy Kimchi and pickled vegetables
8. Adding lots of soy-sauce or vinegar-hot pepper paste to fried foods, pan-fried foods or sashimi
9. Enjoy salty taste and thinking that salty taste is important one
10. Usually us soy-sauce rather than vinegar when cooking vegetables
Table 11
1) Mean ± SD
2) Summated score of each item. Full score of general dietary habits = 25
3) Summated score of each item. Full score of well-balanced dietary habits = 45
'yes' answer for each item (except 4 and 5) was scored 5, 'no' answer 0
'no' answer for each item 4 and 5 was scored 5, 'yes' answer 0
*: p < 0.05, ** : p < 0.01, *** : p < 0.001 by paired t-test between baseline and 8 weeks within group
#: p < 0.05, ##: p < 0.01 by t-test between differences of less attendance and more attendance group
1. Having 3 meals a day without missing any meal
2. Having breakfast everyday
3. Having enough time when eating
4. Having meals often after 10 PM.
5. Eating until feeling full.
6. Having cereals such as rice, breads, noodles, potatoes every meal.
7. Having meats or eggs more than once a day.
8. Having fishes more than once a day
9. Having soybean products such as tofu or soymilk everyday
10. Having vegetable dishes (except kimchi) everyday
11. Having dishes cooked with oils every meal
12. Having milk or dairy products everyday
13. Having fruits everyday
14. Trying to have various foods in a day
 XML Download