Journal List > Korean J Clin Microbiol > v.11(1) > 1038136

Kang and Kim: Characteristics of Microorganisms Isolated from Blood Cultures at a University Hospital Located in an Island Region During 2003∼2007

Abstract

Background

The referral hospital is somewhat isolated from the mainland due to its island status; thus, microorganisms isolated from blood cultures might have a distinct pattern in their frequency and anti-biogram. We attempted to uncover these characteristics.

Methods

The isolates from blood cultures at the Cheju University Hospital during 2003∼2007 were analysed. After inoculation in aerobic and anaerobic bottles, blood specimens were cultured using BacT/ Alert system, and the isolates were identifieded and antimicrobial susceptibilities were tested using Vitek II system.

Results

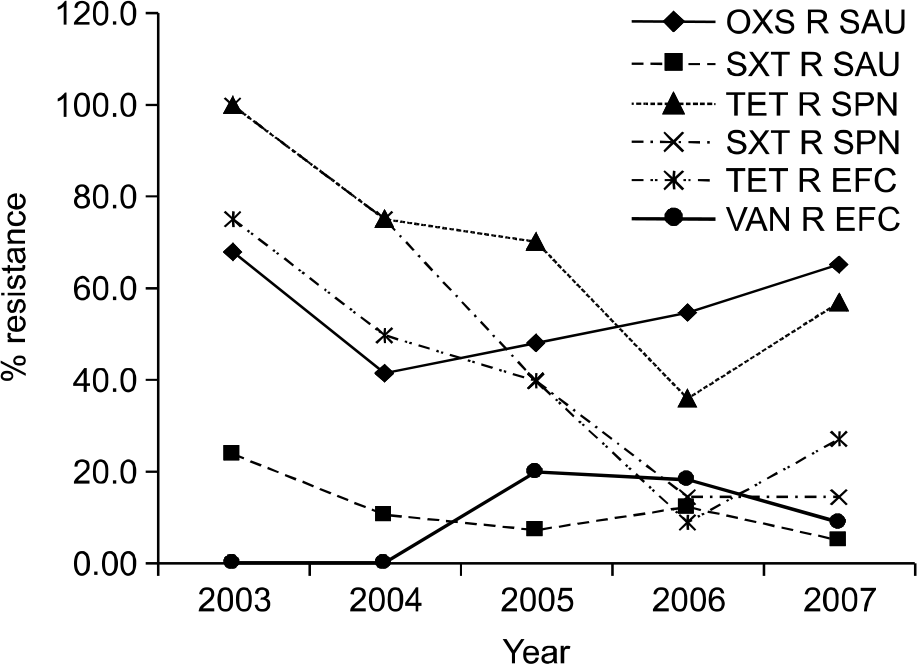
The overall positive rate of blood cultures was 9.6% and contamination rate was 3.6%. The most commonly isolated pathogens were Escherichia coli, Staphylococcus aureus, and Klebsiella pneumoniae. Gram positive rod, gram negative cocci, and anaerobes were not isolated, but fungi were isolated in 0.6% of blood cultures. The prevalence of methi-cillin-resistant S. aureus (MRSA) was 68.0% in 2003, 41.4% in 2004, 48.1% in 2005, 54.5% in 2006, and 65.2% in 2007. The prevalence of vancomycin-resistant enterococcus (VRE) was 0% in 2003 and 2004, 16.7% in 2005, 10.0% in 2006, and 9.5% in 2007.

Conclusion

The most commonly isolated pathogens were similar to those from other hospitals, but the isolation rates of MRSA and VRE by year showed different patterns. Also, gram positive rods, gram negative cocci and anaerobes were not isolated. To help the choice of empirical antibiotic treatments, we need complementary measures to upgrade microorganism isolation systems and further studies in-cluding the monitoring of antibiotic use.

References

1. Bryan CS. Clinical implications of positive cultures. Clin Microbiol Rev. 1989; 2:329–53.
2. Lee GI, Hong KS, Kim OK. Results of blood cultures at Ewha Womans' University Hospital in Recent 5 years. Korean J Lab Med. 1988; 8:169–75.
3. Ahn GY, Jang SJ, Lee SH, Jeong OY, Chaulagain BP, Moon DS, et al. Trends of the species and antimicrobial susceptibility of microorganisms isolated from blood cultures of patients. Korean J Clin Microbiol. 2006; 9:42–50.
4. Koh EM, Lee SG, Kim CK, Kim M, Yong D, Lee K, et al. Microorganisms isolated from blood cultures and their antimicrobial susceptibility patterns at a university hospital during 1994–2003. Korean J Lab Med. 2007; 27:265–75.
crossref
5. National Nosocomial Infections Surveillance System. National Nosocomial Infections Surveillance (NNIS) System Report, data summary from January 1992 through June 2004, issued October 2004. Am J Infect Control. 2004; 32:470–85.
6. National Committee for Clinical Laboratory Standards. Performance standards for antimicrobial susceptibility testing; tenth informational supplement M 100-S10. Wayne, PA; National Committee for Clinical Laboratory Standards. 2005.
7. Kim HO, Kang CG, Chong YS, Lee SY. Organisms isolated from blood at the Yonsei medical center. 1974–1983. Infect Chemother. 1985; 17:15–32.
8. Kim HK, Lee KW, Chong YS, Kwon OH, Kim JM, Kim DS. Blood culture results at the Severance Hospital during 1984–1993. Infect Chemother. 1996; 28:151–66.
9. Mylotte JM and Tayara A. Blood cultures: clinical aspects and controversies. Eur J Clin Microbiol Infect Dis. 2000; 19:157–63.
10. Goldstein EJ. Anaerobic bacteremia. Clin Infect Dis. 1996; 23:S97–101.
crossref
11. Edmond MB, Wallace SE, McClish DK, Pfaller MA, Jones RN, Wenzel RP. Nosocomial bloodstrem infections in United States hospitals: a three-year analysis. Clin Infect Dis. 1999; 29:239–44.
13. Kim KA, Shin SM, Moon HG, Park YH. Causative organisms of neonatal sepsis. Yeungnam Univ J Med. 1999; 16:60–8.
crossref
14. Orrett FA and Changoor E. Bacteremia in children at a regional hospital in Trinidad. Int J Infect Dis. 2007; 11:145–51.
15. Uh Y, Lee HH, Lee KW, Chong YS. The species and antimicrobial susceptibility of microorganisms isolated from blood cultures of patients. J Korean Soc Microbiol. 1991; 26:417–30.
16. Leclercq R, Derlot E, Duval J, Courvalin P. Plasmid-mediated resistance to vancomycin and teicoplanin in Enterococcus faecium. N Engl J Med. 1988; 319:157–61.
crossref
17. Hong SG, Kim S, Jeong SH, Chang CL, Cho SR, Ahn JY, et al. Prevlence and diversity of extended-spectrum β-lactamase -producing Escherichia coli and Klebsiella pneumoniae isolates in Korea. Korean J Clin Microbiol. 2003; 6:149–55.

Fig. 1.
Trend of antimicrobial resistance of S. aureus, S. pneumoniae and E. faecalis by year. Abbreviations: OXS R SAU, oxacillin-resistant S. aureus; SXT SAU, trimethoprim-sulfamethoxazole-resistant S. aureus; TET R SPN, tetracycline-resistant S. pneumoniae; SXT R SPN, trimethoprim-sulfamethoxazole-resistant S. pneumoniae; TET R EFC, tetracycline-resistant E. faecalis; VAN R EFC, vancomycin-resistant E. faecalis.
kjcm-11-11f1.tif
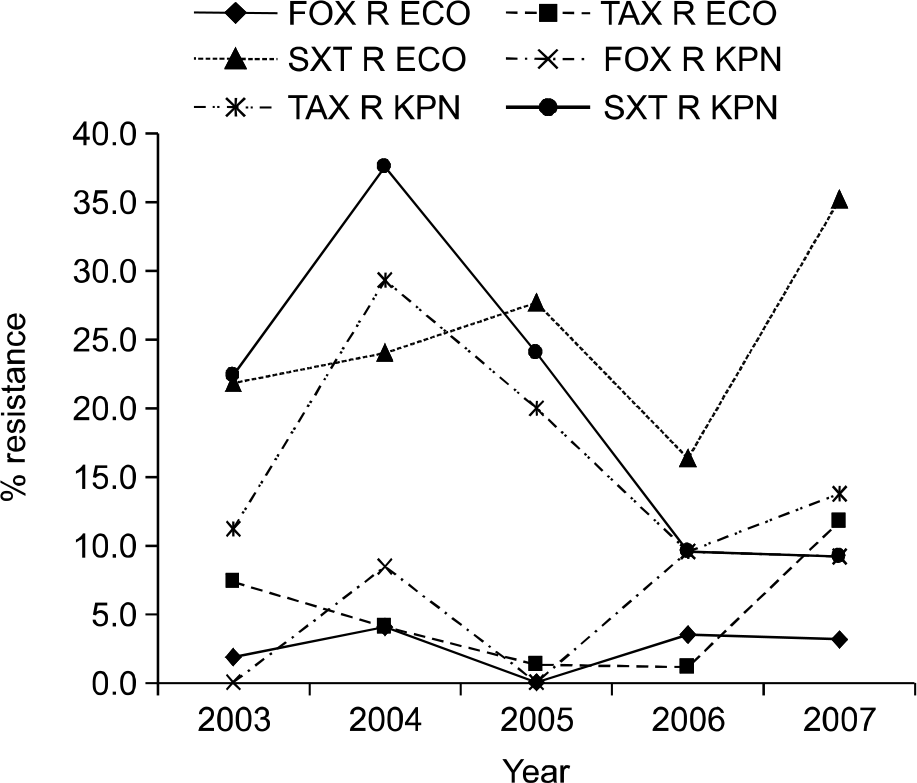
Fig. 2.
Trend of antimicrobial resistance of E. coli and K. pneumoniae by year. Abbreviations: FOX R ECO, cefoxitin-resistant E. coli; TAX R ECO, cefotaxime-resistant E. coli; SXT R ECO, trimethoprim-sulfamethoxazole-resistant E. coli; FOX R KPN, cefoxitin-resistant K. pneumoniae; TAX R KPN, cefotaxime-resistant K. pneumoniae; SXT R KPN, trimethoprim-sulfamethoxazole-resistant K. pneumoniae.
kjcm-11-11f2.tif
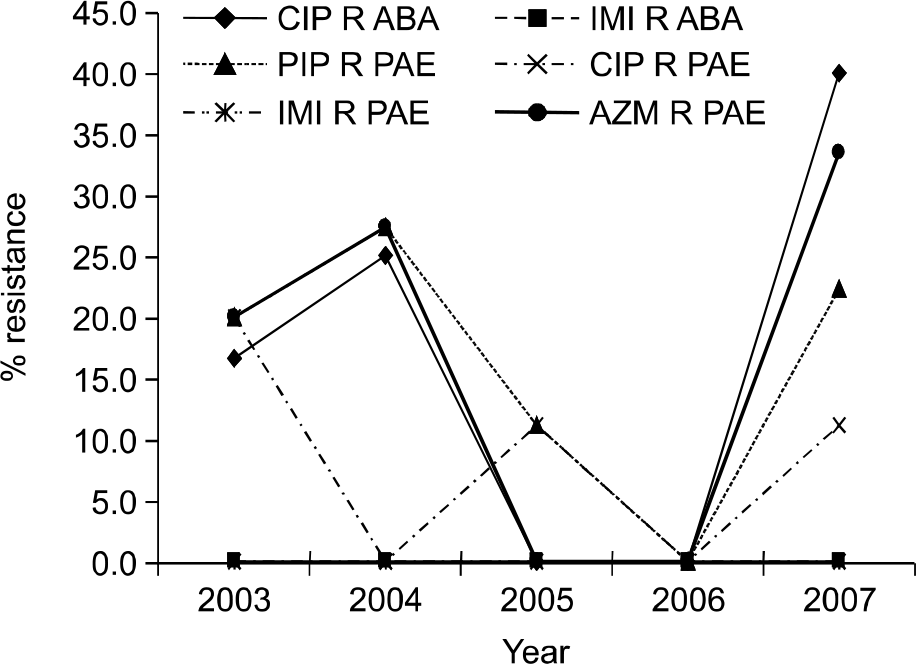
Fig. 3.
Trend of antimicrobial resistance of A. baumannii and P. aeruginosa by year. Abbreviations: CIP R ABA, ciprofloxacin-resistant A. baumannii; IMI R ABA, imipenem-resistant A. baumannii; PIP R PAE, piperacillin-resistant P. aeruginosa; CIP R PAE, ciprofloxacin-resistant P. aeruginosa; IMI R PAE, imipenem-resistant P. aeruginosa; AZM R PAE, aztreonam-resistant P. aeruginosa.
kjcm-11-11f3.tif
Table 1.
Microorganisms isolated from blood in an island region during 2003∼2007
Organisms Yr N of positive isolates and patients by year
2003  2004 2005 2006 2007 Total
  I P I P I P I P I P I P
Aerobic and facultative
Gram-positive cocci 135 103 249 192 242 188 369 273 373 256 1,368 1,012
Staphylococcus aureus 36 25 61 29 50 27 68 33 97 40 312 154
CNS 67 57 146 133 146 124 218 189 198 164 775 667
Others 32 21 42 30 46 37 83 51 78 52 281 191
Gram-positive bacilli NE NE NE NE NE NE NE NE NE NE NE NE
Gram-negative cocci NE NE NE NE NE NE NE NE NE NE NE NE
Gram-negative bacilli 152 101 180 122 242 156 295 179 296 174 1,165 732
Enterobacteriaceae 129 85 131 89 202 128 226 137 246 143 934 582
Glucose-nonfermenting 15 11 43 29 34 24 59 36 44 28 195 128
Others 8 5 6 4 6 4 10 6 6 3 36 22
Subtotal 287 204 429 314 484 344 664 452 669 430 2,533 1,744
Anaerobic NT NT NT NT NT NT 0 0 0 0 0 0
Fungi NT NT NT NT NT NT 4 3 16 8 20 11
Total 287 204  429 314 484 344 668 455 685 438 2,553 1,755

Abbreviations: Yr, year; I, isolates; P, patients; CNS, Coagulase Negative Staphylococci; NE, not estimated; NT, not tested.

Table 2.
Species of aerobic gram-positive cocci, bacilli and gram-negative cocci from blood in an island region during 2003∼2007
Organisms N (%) of positive results
Isolates Patients
N (%) N (%)
Gram-positive cocci
Staphylococcus aureus 312 (22.8) 154 (15.2)
Coagulase negative staphylococci 775 (56.7) 667 (65.9)
Streptococcus pneumoniae 70 (5.1) 45 (4.4)
Streptococcus agalactiae 20 (1.5) 18 (1.8)
Streptococcus pyogenes 10 (0.7) 7 (0.7)
Viridans streptococci 5 (0.4) 5 (0.5)
Other Streptococcus spp. 46 (3.4) 33 (3.3)
Enterococcus faecalis 60 (4.4) 34 (3.4)
Enterococcus faecium 42 (3.1) 28 (2.8)
Other Enterococcus spp. 26 (1.9) 19 (1.9)
Micrococcus spp. 2 (0.1) 2 (0.2)
Other gram-positive cocci 0 (0.0) 0 (0.0)
Subtotal 1,368 (100.0) 1,012 (100.0)
Gram-positive bacilli NE (NE) NE (NE)
Gram-negative cocci NE (NE) NE (NE)
Total 1,368 (100.0)  1,012 (100.0)

Abbreviations: See Table 1.

Table 3.
Species of aerobic and facultative anaerobic gram-negative bacilli from blood in an island region during 2003∼2007
Organisms N (%) of positive results
Isolates Patients
N (%) N (%)
Enterobacteriaceae    
Escherichia coli 581 (59.9) 363 (60.1)
Citrobacter spp. 21 (2.2) 16 (2.6)
Enterobacter aerogenes 12 (1.2) 8 (1.3)
Enterobacter cloacae 37 (3.8) 22 (3.6)
Other Enterobacter spp. 1 (0.1) 1 (0.2)
Klebsiella oxytoca 20 (2.1) 15 (2.5)
Klebsiella pneumoniae 186 (19.2) 103 (17.1)
Other Klebsiella spp. 5 (0.5) 4 (0.7)
Morganella spp. 6 (0.6) 4 (0.7)
Proteus spp. 8 (0.8) 6 (1.0)
Salmonella typhi 4 (0.4) 3 (0.5)
Other Salmonella spp. 10 (1.0)) 7 (1.2)
Serratia spp. 34 (3.5) 23 (3.8)
Others 9 (0.9) 7 (1.2)
Subtotal 934 (96.3) 582 (96.4)
Other gram-negative bacilli    
Aeromonas hydrophilia 22 (2.3) 13 (2.2)
Other Aeromonas spp. 4 (0.4) 2 (0.3)
Haemophilus influenzae 3 (0.3) 1 (0.2)
Other Haemophilus spp. 0 (0.0) 0 (0.0)
Vibrio parahaemolyticus 1 (0.1) 1 (0.2)
Vibrio vulnificus 0 (0.0) 0 (0.0)
Others 6 (0.6) 5 (0.8)
Subtotal 36 (3.7) 22 (3.6)
Total 970 (100.0) 604 (100.0)
Table 4.
Species of glucose-nonfermenting gram-negative bacilli solated from blood in an island region during 2003∼2007
Organisms N (%) of positi ve results
Isolates Patients
N (%) N (%)
Acinetobacter baumannii 51 (26.2) 35 (27.3)
Other Acinetobacter spp. 14 (7.2) 12 (9.4)
Alcaligenes spp. 0 (0.0) 0 (0.0)
Burkholderia cepacia 17 (8.7) 11 (8.6)
Other Burkholderia spp. 4 (2.1) 3 (2.3)
Flavobacterium spp. 0 (0.0) 0 (0.0)
Moraxella spp. 0 (0.0) 0 (0.0)
Pseudomonas aeruginosa 72 (36.9) 42 (32.8)
Other Pseudomonas spp. 31 (15.9) 21 (16.4)
Others 6 (3.1) 4 (3.1)
Total 195 (100.0) 128 (100.0)
Table 5.
Species of fungi isolated from blood in an island region during 2003∼2007
Fungi N (%) of positive results
Total isolates Total patients
N (%) N (%)
Candida albicans 1 (5.0) 1 (9.1)
Candida glabrata 1 (5.0) 1 (9.1)
Candida krusei 2 (10.0) 1 (9.1)
Candia lusitaniae 1 (5.0) 1 (9.1)
Candida parapsilosis 15 (75.0) 7 (63.6)
Other yeast 0 (0.0) 0 (0.0)
Other mold 0 (0.0) 0 (0.0)
Total 20 (100.0) 11 (100.0)
Table 6.
Annual isolation rate of relatively common bacteria isolated from blood in an island region during 2003∼2007
Organisms Yr N (%) of positive patients by year
2003 2004 2005 2006 2007 Total
N (%) N (%) N (%) N (%) N (%) N (%)
Staphylococcus aureus 25 (13.9) 29 (10.7) 27 (9.1) 33 (8.1) 40 (10.4) 154 (10.0)
CNS 57 (31.7) 133 (49.1) 124 (41.8) 189 (46.4) 164 (42.5) 667 (43.3)
Streptococcus pneumoniae 3 (1.7) 4 (1.5) 10 (3.4) 14 (3.4) 14 (3.6) 45 (2.9)
Enterococcus faecalis 5 (2.8) 2 (0.7) 5 (1.7) 11 (2.7) 11 (2.8) 34 (2.2)
Enterococcus faecium 4 (2.2) 3 (1.1) 1 (0.3) 9 (2.2) 11 (2.8) 28 (1.8)
Bacillus spp. 0 (0.0) 0 (0.0) 0 (0.0) 0 (0.0) 0 (0.0) 0 (0.0)
Neisseria spp. 0 (0.0) 0 (0.0) 0 (0.0) 0 (0.0) 0 (0.0) 0 (0.0)
Escherichia coli 56 (31.1) 50 (18.5) 76 (25.6) 86 (21.1) 95 (24.6) 363 (23.6)
Klebsiella pneumoniae 11 (6.1) 24 (8.9) 25 (8.4) 21 (5.2) 22 (5.7) 103 (6.7)
Enterobacter spp. 5 (2.8) 4 (1.5) 5 (1.7) 12 (2.9) 5 (1.3) 31 (2.0)
Proteus spp. 0 (0.0) 1 (0.4) 2 (0.7) 2 (0.5) 1 (0.3) 6 (0.4)
Salmonella spp. 2 (1.1) 1 (0.4) 1 (0.3) 1 (0.2) 5 (1.3) 10 (0.6)
Serratia spp. 1 (0.6) 5 (1.8) 10 (3.4) 4 (1.0) 3 (0.8) 23 (1.5)
Acinetobacter baumannii 6 (3.3) 4 (1.5) 2 (0.7) 17 (4.2) 6 (1.6) 35 (2.3)
Pseudomonas aeruginosa 5 (2.8) 11 (4.1) 9 (3.0) 8 (2.0) 9 (2.3) 42 (2.7)
Total 180 (100.0) 271 (100.0) 297 (100.0) 407 (100.0) 386 (100.0) 1,541 (100.0)

Abbreviations: See Table 1.

Table 7.
Distribution of relatively common bacteria isolated from blood in an island region by age group of patients
Organisms Yo N (%) of patients by age group
<1/12 1/12∼1 2∼5 6∼9 10∼19 20∼29 30∼39 40∼49 50∼59 60∼69 >70 Total
Staphylococcus aureus N 4 3 0 2 5 3 3 20 22 42 50 154
(%) (2.6) (1.9) 0.0 (1.3) (3.2) (1.9) (1.9) (13.0) (14.3) (27.3) (32.5) (100.0)
CNS N 74 35 25 3 7 23 23 53 79 119 226 667
(%) (11.1) (5.2) (3.7) (0.4) (1.0) (3.4) (3.4) (7.9) (11.8) (17.8) (33.9) (100.0)
Streptococcus pneumoniae N 0 8 2 1 0 0 2 4 5 13 10 45
(%) (0.0) (17.8) (4.4) (2.2) (0.0) (0.0) (4.4) (8.9) (11.1) (28.9) (22.2) (100.0)
Enterococcus faecalis N 2 0 0 0 0 0 1 1 6 7 17 34
(%) (5.9) (0.0) (0.0) (0.0) (0.0) (0.0) (2.9) (2.9) (17.6) (20.6) (50.0) (100.0)
Enterococcus faecium N 0 0 0 0 1 0 1 3 0 11 12 28
(%) (0.0) (0.0) (0.0) (0.0) (3.6) (0.0) (3.6) (10.7) (0.0) (39.3) (42.9) (100.0)
Escherichia coli N 10 0 0 1 6 11 16 35 42 78 164 363
(%) (2.8) (0.0) (0.0) (0.3) (1.7) (3.0) (4.4) (9.6) (11.6) (21.5) (45.2) (100.0)
Klebsiella pneumoniae N 2 3 1 0 0 1 1 10 18 24 43 103
(%) (1.9) (2.9) (1.0) (0.0) (0.0) (1.0) (1.0) (9.7) (17.5) (23.3) (41.7) (100.0)
Enterobacter spp. N 1 1 1 0 0 1 1 5 7 8 6 31
(%) (3.2) (3.2) (3.2) (0.0) (0.0) (3.2) (3.2) (16.1) (22.6) (25.8) (19.4) (100.0)
Proteus spp. N 0 0 0 0 0 0 0 0 1 2 3 6
(%) (0.0) (0.0) (0.0) (0.0) (0.0) (0.0) (0.0) (0.0) (16.7) (33.3) (50.0) (100.0)
Salmonella spp. N 0 0 2 1 2 2 0 1 0 2 0 10
(%) (0.0) (0.0) (20.0) (10.0) (20.0) (20.0) (0.0) (10.0) (0.0) (20.0) (0.0) (100.0)
Serratia spp. N 3 1 1 1 1 1 1 3 1 5 5 23
(%) (13.0) (4.3) (4.3) (4.3) (4.3) (4.3) (4.3) (13.0) (4.3) (21.7) (21.7) (100.0)
Acinetobacter baumannii N 1 2 0 0 1 1 2 4 3 10 11 35
(%) (2.9) (5.7) (0.0) (0.0) (2.9) (2.9) (5.7) (11.4) (8.6) (28.6) (31.4) (100.0)
Pseudomonas aeruginosa N 1 1 0 0 0 0 2 0 5 15 18 42
(%) (2.4) (2.4) (0.0) (0.0) (0.0) (0.0) (4.8) (0.0) (11.9) (35.7) (42.9) (100.0)

Abbreviations: Yo, years old; see Table 1.

Table 8.
Association between the number of blood culture and blood culture-positive patients and CNS and BCP isolated from blood
Year N of blood culture N (%) of positive patients N (%) of CNS and BCP
N (%) N (%)
2003 1,886 204 (10.8) 57 (3.0)
2004 3,437 314 (9.1) 133 (3.9)
2005 3,687 344 (9.3) 124 (3.4)
2006 4,455 455 (10.2) 189 (4.2)
2007 4,879 438 (9.0) 164 (3.4)
Total 18,344 1,755 (9.6) 667 (3.6)

Abbreviations: CNS, Coagulase Negative Staphylococcus; BCP, Bacillus spp., Corynebacterium spp. and Propionibacterium spp.

TOOLS
Similar articles