

 PDF
PDF ePub
ePub Citation
 Print
Print


INTRODUCTION
Breast cancer is the second most common neoplasm in women in Korea [1]. Breast cancer is a heterogeneous and complex genetic disease with different molecular bases. Despite recent advances in early detection and multimodality therapies, triple-negative breast cancers (TNBC) and human epidermal growth factor receptor 2 (HER2)-positive breast cancers show aggressive behaviors and poor clinical outcomes [2 3 4]. For this reason, the identification of new biomarkers that are associated with potential therapeutic agents and prognostic markers is clinically important.
Transducin-like enhancer of split 1 (TLE1) is a transcriptional corepressor located at chromosome 9q21.32. It is a member of the TLE gene family, and has been implicated in embryogenesis, hematopoiesis, and neuronal and terminal epithelial differentiation [567]. TLE1 is involved in the Wnt/β-catenin signaling pathway, which is important in synovial sarcomas, and in the nuclear factor κB (NF-κB) pathway that regulates inflammation [891011]. TLE1 is a highly sensitive immunohistochemical marker for the diagnosis of synovial sarcoma; however, TLE1 expression is not specific for synovial sarcoma, as it is expressed in other tumor types [1213]. Knockdown of TLE1 in fibroblasts and synovial cells enhances the cytotoxic effect of chemotherapy, which suggests that TLE1 could be a promising therapeutic target for selectively treating synovial sarcoma without damaging healthy tissue [14]. A recent study used a proximity ligation assay to show that class I histone deacetylases inhibitors, which are cytotoxic, disrupt the oncogenic association of SS18-SSX and TLE1 in synovial sarcoma [15]. More information is needed to determine the biological and potential therapeutic roles of TLE1.
TLE1 overexpression has been documented in some epithelial cancers, including gastric cancer, breast cancer, lung cancer, hepatocellular carcinoma, and pancreatic ductal adenocarcinoma [1617181920212223]. Conflicting results have been published on the function of TLE1 in some carcinomas. To date, no studies have showed an association between TLE1 expression and clinicopathological parameters and intrinsic subtype in breast cancer, nor has anyone examined its prognostic value.
Here, we performed TLE1 immunohistochemistry (IHC) analysis on a cohort of 456 invasive breast cancers (IBCs) and evaluated the findings of clinicopathological variables, including clinical outcome. The correlation between intrinsic subtype and TLE1 expression was also addressed. Finally, we analyzed the relationship between TLE1 protein expression in normal breast specimens and ductal carcinoma in situ (DCIS).
METHODS
Patient and tissue specimens
We used tissue microarrays (TMAs) composed of 520 breast cancer tissue punches and 29 matched normal breast tissue samples from formalin-fixed and paraffin-embedded tissues collected from patients treated at the Department of Pathology of Soonchunhyang University Cheonan Hospital from 2001 to 2012. Of these 520 tissue punches, 456 IBC and 27 DCIS samples were evaluable for this study. Clinicopathological characteristics including patient age, histologic subtype, T-stage, nodal status, histologic grade, date of recurrence or death, and date of last follow-up were obtained by reviewing the medical records and hematoxylin and eosin-stained slides. All cases were independently reviewed by two pathologists (J.H.L. and H.J.L.), according to the 2012 World Health Organization classification [24]. This study was approved by the Institutional Review Board of Soonchunhyang University Cheonan Hospital (SCHCA 2016-09-016).
Immunohistochemical analyses and scoring
TLE1 expression was analyzed by IHC using 4-µm thick TMA tissue sections. IHC staining of the TMA samples was performed using a Bond-Max automated immunostainer (Leica Microsystems, Bannockburn, USA) and Bond Polymer Refine Detection kit (Leica Microsystems) according to the manufacturer's recommendations. The primary anti-TLE1 mouse monoclonal antibody (1F5; Cell Marque, Rocklin, USA) was used at a dilution of 1:50. Staining was optimized using positive and negative controls. Cells positive for TLE1 were established as those with clear brown granules in the nucleus. Two pathologists blinded to the patient data (H.J.L. and J.H.L.) independently read the slides. Any samples on which the pathologists did not agree were reviewed jointly at a multihead microscope and a consensus was reached. Percentages of TLE1 positive tumor cells and staining intensity were calculated for each sample as follows, using a modified scoring method [16]: 0, no staining or staining in <1% of the tumor cells; 1, staining in 1% to 10% of the cells (weak); 2, staining in 11% to 50% of the cells (moderate); and 3, staining in >50% of tumor cells (strong). TLE1 expression was categorized as low or no TLE1 expression (scores of 0–1) and high TLE1 expression (scores of 2–3).
Expression of standard biomarkers, including HER2, Ki-67, estrogen receptor (ER), and progesterone receptor (PR), was assessed in TMA sections for missing data during the study or in full sections at the time of diagnosis. Epidermal growth factor receptor (EGFR), cytokeratin 5/6 (CK5/6), and p53 expression were evaluated using TMAs. ER and PR were regarded as positive with an Allred score ≥3 [25]. Expression of HER2 was scored according to the recommendations set by the American Society of Clinical Oncology/College of American Pathologists. For the HER2 equivocal cases, HER2 positivity was determined using fluorescence in situ hybridization. For the Ki-67 proliferation index, cases with ≥14% positive staining were defined as having high indices. For CK5/6 and EGFR, cases with any positive membranous staining were considered positive. For p53, specimens with ≥10% positive tumor cells were categorized as positive.
Definition of breast cancer intrinsic subty
Intrinsic subtypes were defined as previously described [26] and categorized as follows: luminal A (ER+ and/or PR+, HER2−, Ki-67 <14%), luminal B (ER+ and/or PR+, HER2− and Ki-67 ≥14%, or HER2+ and any Ki-67), HER2+ (ER−, PR−, HER2+), and TNBC (ER−, PR−, HER2−).
Statistical analyses
Statistical significance was calculated using Statistical Package, SPSS version 19.0 for Windows (IBM Corp., Armonk, USA). The chi-square test or Fisher exact test (when the number of cases in a category was <10) was used to analyze clinicopathological characteristics between TLE1 high and low expression. Kaplan-Meier survival curves for disease-free survival (DFS) and overall survival (OS) were constructed, and differences were determined using the log-rank test. Survivors were recorded at the date of last contact. A p-value <0.05 was considered statistically significant.
RESULTS
Patient characteristics and TLE1 expression
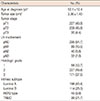
The baseline characteristics of the 456 IBC cases are summarized in Table 1. The mean tumor size was 2.36±1.40 cm (range, 0.3–12 cm). The mean patient age was 52.1±12.4 years (range, 24–81 years). The histologic types included invasive ductal carcinoma not otherwise specified (n=413, 90.6%), invasive lobular carcinoma (n=20, 4.4%), and others (n=23, 5.0%). The primary tumor stages included pT1 (227, 49.8%), pT2 (209, 45.8%), and pT3 (20, 4.4%). Over half of the patients had lymph node (LN) involvement of pN0 (n=295, 64.7%), but pN1 (n=89, 19.5%), pN2 (n=40, 8.8%), and pN3 (n=32, 7.0%) were also observed. Of the 456 patients, 161 (35.3%) had LN positivity at the time of diagnosis. Fifty-eight patients (12.7%) had histological grade 1 tumors, 227 (49.8%) had grade 2, and 171 (37.5%) had grade 3. Of the 456 patients, 167 (36.6%), 212 (46.5%), and 77 (16.9%) were classified as TNM stages I, II, and III, respectively. The frequencies of the different intrinsic subtypes were as follows: luminal A, 43.4% (n=198); luminal B, 25.0% (n=114); HER2+, 9.9% (n=45); and TNBC, 21.7% (n=99).
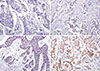
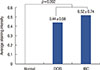
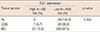
TLE1 expression was mainly nuclear (Figure 1). We evaluated TLE1 expression in 29 normal breast samples, 27 DCIS specimens, and 456 IBC specimens. TLE1 expression was negative in all of the normal breast tissues (0% positive), and positive in one DCIS sample (3.7%) and 57 IBC samples (12.5%). This was statistically significant (p=0.002) (Table 2). The average staining intensity of TLE1 expression was 0 in normal breast tissue, 0.44±0.58 in DCIS specimens, and 0.52±0.74 in IBC specimens (Figure 2). TLE1 expression was significantly higher in DCIS and IBC specimens than in normal breast tissue (p=0.002). Of the 456 breast cancers, six (1.3%) had a TLE1 expression score of 3, 51 (11.2%) of 2, and 117 (25.7%) of 1. The remaining 282 samples (61.8%) had a score of 0. For statistical analysis, we coded TLE1 expression data into a high expression group (scores 2 and 3; n=57, 12.5%) and a low expression group (scores 0 and 1; n=399, 87.5%).
Association between TLE1 expression and clinicopathological features
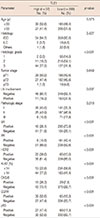
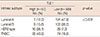
High TLE1 expression was significantly correlated with negative LN involvement (p=0.007) and high histologic grade (p<0.001) (Table 3). The expression of TLE1 was negatively associated with ER expression (p<0.001) and PR expression (p<0.001), and positively associated with HER2 expression (p<0.001), Ki-67 proliferation index (p<0.001), CK5/6 expression (p<0.001), EGFR expression (p<0.001), and p53 expression (p<0.001). Other clinicopathological variables, including age (p=0.573), histology (p=0.427), tumor stage (p=0.649), and pathologic stage (p=0.218), did not correlate with TLE1 expression. TLE1 expression was significantly higher in the HER2+ (28.1%) and TNBC (43.9%) subtypes compared to the luminal A (12.3%) and luminal B (15.8%) subtypes (p<0.001) (Table 4).
Correlation between TLE1 expression and prognosis
The median follow-up period was 37 months (range, 1–158 months), during which there were 89 recurrences (19.5%) and 45 deaths (9.9%). The OS rates for IBC patients with high and low TLE1 expression were 94.7% and 89.5%, respectively. The follow-up period was too short to accurately determine long-term survival, so patients who were followed up for more than 36 months were selected and analyzed.
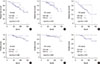
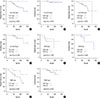
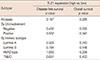
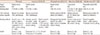
In the survival analysis, no correlation was found between TLE1 expression and DFS or OS in all cases (p=0.167 and p=0.286, respectively) (Table 5, Figure 3A and B). The TLE1-high group included more LN-negative patients. For an adjusted analysis, we separately analyzed the LN-negative and LN-positive groups. In the LN-negative group, no correlation was found between TLE1 expression and DFS or OS (p=0.432 and p=0.632, respectively) (Table 5, Figure 3C and D). Similarly, in the LN-positive group, no correlation was found between TLE1 expression and DFS or OS (p=0.552 and p=0.341, respectively) (Table 5, Figure 3E and F). Additionally, no correlation was found between TLE1 expression and DFS or OS with regards to intrinsic subtype (Table 5, Figure 4).
DISCUSSION
To the best of our knowledge, this is the first study documenting immunohistochemical expression of TLE1 in IBC and examining its association with clinicopathological parameters and intrinsic subtype, with a particular focus on potential prognostic value.
We found that TLE1 expression was increased in DCIS and IBC compared to matching normal breast tissue. This suggests an oncogenic effect of TLE1 in breast carcinogenesis. These findings are similar to those reported previously in gastric, breast, and lung cancer [161718].
We have previously reported that in tissue from 291 gastric cancer patients, 121 (41.6%) were positive for TLE1. Normal gastric mucosa has no TLE1 expression. We suggested that TLE1 had an oncogenic effect in gastric cancer [16]. In a study analyzing breast tissue by IHC, TLE1 was significantly overexpressed in IBC tissues (67.4%) compared to normal breast tissue and DCIS samples [17]. TLE1 has been shown to be a regulator of anoikis in breast carcinoma cells. It is significantly overexpressed following loss of extracellular matrix interaction, and promotes anoikis resistance and anchorage-independent growth. These findings indicate a function for TLE1 in anoikis resistance in breast cancer cells [17]. Another study reported TLE1 overexpression in 5 of 46 (10.9%) squamous cell carcinomas and 14 of 71 (19.7%) adenocarcinomas on a human lung cancer tissue array [18]. The authors concluded that TLE1 could act as an oncoprotein in the lung through upregulated erbB2 receptor tyrosine kinase 1/2 signaling.
Not all studies have shown pro-oncogenic properties for TLE1. A previous study observed decreased TLE1 protein in 11 of 12 (91.7%) hepatocellular carcinomas. The authors also determined that TLE1 mRNA decreased gradually in the progression from normal liver to dysplastic cells to hepatocellular carcinoma. Their findings indicated that TLE1 expression promotes tumor suppression in hepatocarcinogenesis through interaction with the NF-κB pathway as a tumor suppressor [19]. Further research is required to elucidate whether TLE1 acts as an oncogene or a tumor suppressor.
We observed high expression of TLE1 in 12.5% of IBCs. As described above, the reported frequency of TLE1 expression in carcinoma cells varies considerably between studies (8.7%–67.4%) (Table 6) [16171820]. Differences in the organ and carcinoma types, sample size, different antibody clones, scoring methods, and cutoff criteria may account for this discrepancy.
We also found that high expression of TLE1 is associated with high histologic grade, ER negativity, PR negativity, HER2 positivity, high Ki-67 labeling index, CK5/6 positivity, EGFR positivity, and positive p53 expression, which are poor prognostic clinicopathological features in breast cancer. However, high expression of TLE1 was also significantly correlated with negative LN metastasis, which is the most important positive prognostic factor in breast cancer. These results suggest that LN metastasis of IBC might be associated with loss of TLE1 activity. The question then becomes how the loss of TLE1 activity is related to LN metastasis in IBC. One possibility is the role of TLE1 in the NF-κB pathway, where it acts as a tumor suppressor through the regulation of microRNA-657 [19]. This hypothesis could account for the results of our study, which showed that high expression of TLE1 correlated with negative LN metastasis in IBC. These findings are comparable to those reported in a previous study of gastric cancer [16]. We recently reported that the expression of TLE1 in gastric cancer is associated with better clinicopathological features, such as good histologic grade, less frequent lymphatic or perineural invasion, intestinal type histology, early tumor stage, negative LN metastasis, and early pathologic stage. Interestingly, we also found that expression of TLE1 in gastric cancer was significantly correlated with longer DFS and OS in univariate analysis, but not multivariate analysis. This suggests that TLE1 expressed by tumor cells leads to attenuation of their aggressiveness. The functional mechanisms of TLE1 in human epithelial cancers are not yet known, and further studies will be needed to confirm our findings.
We observed that the expression of TLE1 was significantly higher in both the HER2+ and TNBC subtypes. To our knowledge, no published reports have proven an association between TLE1 expression and intrinsic subtype, particularly the HER2+ and TNBC subtypes. Our study is the first to evaluate TLE1 expression in breast cancer patients according to intrinsic subtype.
In this study, no significant association between TLE1 expression and DFS or OS was evident. A study analyzing 115 pancreatic ductal adenocarcinomas by IHC showed high expression of TLE1 in 8.7% (n=10) of the samples in TMAs [20]. No significant correlation between clinicopathological parameters and TLE1 protein expression could be demonstrated, and TLE1 showed no prognostic relevance [20].
Our analysis has a number of limitations. First, the sample size was small and from a single institution, and the retrospective design resulted in selection bias. Second, mature survival information was limited as the follow-up period was not long enough to examine 5-year survival rates. Despite these challenges and limitations, this is the first study to assess TLE1 expression in breast cancer patients.
In summary, we investigated clinicopathological parameters, intrinsic subtype, and prognostic significance of TLE1 expression by IHC in primary IBC. This is the first study to document the prognostic significance of TLE1 expression in breast cancer patients, especially examining intrinsic subtype. High TLE1 expression is significantly associated with the HER2+ and TNBC subtypes. The exact role of the TLE1 in breast cancer is not yet known. Further studies are needed to determine the mechanism of the TLE1 in the carcinogenesis and progression of breast cancer.
 XML Download