

 PDF
PDF ePub
ePub Citation
 Print
Print


INTRODUCTION
Breast cancer has a high incidence in many countries, including Korea. Treatment options for breast cancer have been steadily developing and improving. Many clinical trials have been conducted to develop new treatment modalities. Currently, breast cancer has relatively high rates of disease-free outcomes and overall survival [1]. Ironically, improved prognosis makes it difficult to conduct clinical trials or develop new biomarkers, because it causes a low event rate. To obtain statistically meaningful results, a large number of patients and long-term follow-up are needed. To achieve personalized treatment, biomarkers need to be developed. There are many advantages of using formalin-fixed paraffin-embedded (FFPE) tissues to develop biomarkers. Proteins, DNA, and RNA can be extracted from FFPE tissues and used for more ancillary molecular tests compared to samples from fresh frozen (FF) tissues [2]. Protein, DNA, and RNA are preserved better and for a longer period in FFPE tissues than in FF tissues [3]. Processing and storing FFPE tissue is simpler than that of FF tissue. The cost of storage is also less for FFPE tissue than for FF tissue [4], because processing and preserving FF tissue for long periods requires enormous effort and steady financial support [5], without guaranteeing good quality samples. However, using FFPE tissues in medical research and molecular diagnostics is challenging owing to degradation of protein and fragmentation of DNA and RNA [367]. If optimal protocols can be developed for using FFPE tissue, FFPE samples within the archives of every pathology department will become available for valuable clinical research.
In accordance with the central dogma, measurement of RNA expression is important to predict cellular biological functions. RNA was first extracted from FFPE samples in 1988 by Rupp and Locker [8]. Since then, several clinical tests using different measurement technologies, such as real-time polymerase chain reaction (RT-PCR) and nCounter assay, have been developed and commercialized as Oncotype Dx® [910] and PAM50® [1112]. These tests are applied to decide treatment options for breast cancer patients. However, many researchers still believe that FFPE tissue is inappropriate for RNA expression studies.
With the development of next-generation sequencing (NGS), many studies have attempted to use this technology to measure RNA expression, because it supports multigene analysis using a small quantity of RNA. In addition, it can save time when performing a large number of tests and has a lower assay cost and high assay sensitivity [2]. However, there is currently no standardized protocol for using NGS technology to measure RNA expression, owing to RNA quality control issues and the existence of multiple data interpretation methods.
Optimization of an RNA extraction protocol using FFPE tissue is a crucial step in the clinical application of NGS. Many studies have optimized RT-PCR methods using samples from FFPE blocks [13]. However, few studies have developed a standard protocol for NGS of samples from FFPE tissue. Therefore, the objective of this study was to optimize the processing and handling of FFPE tissues for RNA expression studies using NGS technology.
Go to : 
METHODS
Extraction of RNA from FFPE and FF tissue
A total of 148 blocks of FFPE and FF tissue from the archives of the Department of Pathology at Seoul National University Hospital, Korea University Guro Hospital, and Asan Medical Center were used for RNA extraction. The characteristics and purposes of the samples used are presented in Table 1. This study was approved by the Institutional Review Boards (IRB) of Seoul National University Hospital (H1410-150-623), Korea University Guro Hospital (16010-001), and Asan Medical Center (S2014-1828-0011). All participants provided written informed consent. A skilled pathologist examined the hematoxylin and eosin (H&E)-stained slides to select blocks that definitely had tumor tissue. The tumor portion of six shaved cuts (10 µm thickness) from each selected block was deparaffinized (~20 minutes) and digested with protease (30 minutes to 16 hours). Nucleic acid was then isolated using RecoverAll™ Total Nucleic Acid Isolation Kit (Thermo Fisher Scientific Inc., Waltham, USA) following the manufacturer's protocol. The final volume of extracted RNA was 40 µL. RNA concentration and purity were assessed using a NanoDrop instrument (NanoDrop Technologies Inc., Wilmington, USA). Sample absorbance was measured at 260 nm and 280 nm and the ratio of optical density (OD)260/OD280 was used to test for protein or phenol contamination [14]. The RNA integrity number (RIN), an indicator of the intactness of two ribosomal RNAs [15], was determined to assess RNA quality using an Agilent RNA 6000 Nano Kit (Agilent Technologies, Palo Alto, USA).
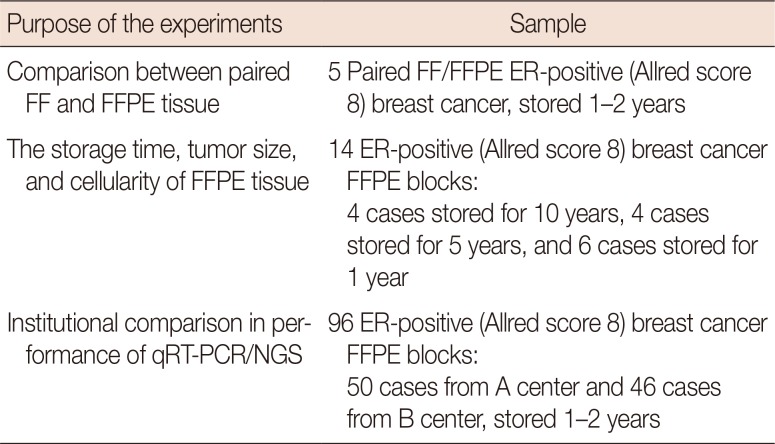
Table 1
Experiments and samples
![]()
Measurement of cancer cellularity
To determine the minimum amount of RNA needed from FFPE tissue for the NGS study, carcinoma cellularity was determined based on the number of cancer cells on slides immunohistochemically stained for estrogen receptor (ER). Cancer area was measured using an image analyzer. Cellularity was defined as the number of cancer cells in the tumor area counted in the image from ER-stained slides divided by the entire number of cells counted in the image from H&E-stained slides (Figure 1).
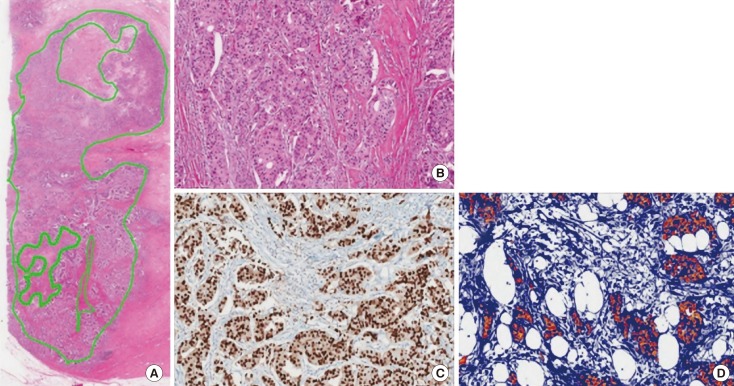 | Figure 1Measurement of tumor cellularity in sample 10_2. (A) Tumor size was measured at 180.1 mm2 using hematoxylin and eosin (H&E) stained sections (×12.5). (B) The total number of cells was determined using an image analyzer (H&E stain, ×100). (C) More than 95% of tumor cells were positive for estrogen receptor (ER)-immunohistochemical (IHC) stain (×100). (D) The number of tumor cells on ER-IHC-stained slides were counted with an image analyzer.
|
Quantitative real-time polymerase chain reaction
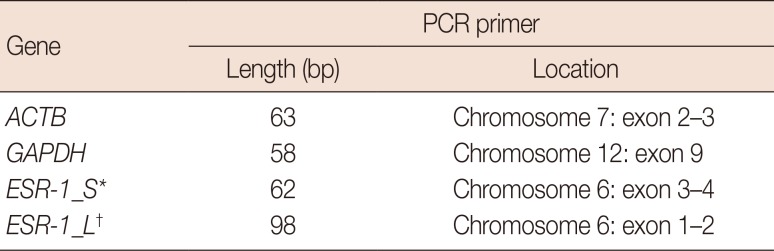
The current standard mRNA quantification method is quantitative RT-PCR (qRT-PCR). We performed qRT-PCR for two housekeeping genes (ACTB and GAPDH) and the ESR-1 gene, which is highly expressed in all ER-positive breast cancers (Allred score 8). Those genes were used as references to compare NGS quality and quantity. In qRT-PCR, the threshold cycle (CT), which is the intersection between an amplification curve and a threshold line, was measured to determine the relative concentration of the target gene. Previous studies have shown that mRNAs extracted from FFPE tissues are highly degraded and fragmented. We designed two different sets of PCR primers to determine which set was more suitable for mRNA measurement in FFPE samples. To compare the performance according to amplicon length, two sets of primers of 62 base pair (bp) (short-amplicon) and 92 bp (long-amplicon) were chosen for ESR-1. Primer details are shown in Tables 2 and 3.
Targeted sequencing using NGS
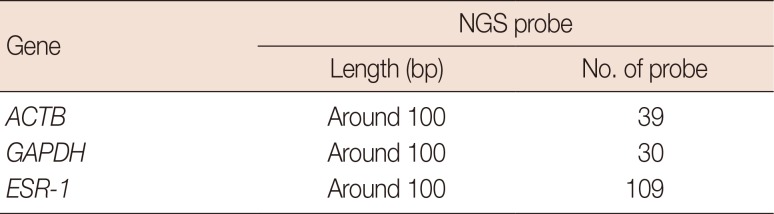
Targeted NGS was performed for ACTB, GAPDH, and ESR-1 genes. Probes used for sequencing were designed to be around 100 bp long to account for RNA fragmentation in FFPE blocks (Table 3). The first step of NGS was library preparation. Libraries were constructed using the KAPA Library Preparation Kit (KAPA Biosystems Inc., Boston, USA). Extracted RNA was converted to cDNA and then fragmented into small pieces (200–300 bp). Fluorescent adapters were then attached to both ends of the fragmented DNA. The next step was cluster generation. The library was loaded onto a flow cell where fragments were captured with complementary oligos. Each DNA fragment was then amplified by binding to complementary oligos. The final step was sequencing. These two steps were performed by Celemics, Inc. (Seoul, Korea). Data analysis was performed using Trimmomatic (Usadellab, Jülich, Germany), STAR aligner (https://code.google.com/archive/p/rna-star/downloads), and SAMtools (http://samtools.sourceforge.net).
Analysis of NGS results
To measure mRNA expression level, quantitative expression values were calculated for each sample based on the number of fragments per kilobase of exon per million fragments mapped (FPKM) [16], using Scikit. These were compared to qRT-PCR CT values for ACTB, GAPDH, and ESR-1 genes.
Statistical analysis
RNA samples from FF and FFPE tissues were compared by paired t-test. The relationship between RNA quantity/quality and archiving time was assessed by analysis of variance. A two-tailed probability p-value of less than 0.05 was considered to indicate statistically significant data.
Statistical analysis was performed using IBM SPSS software version 20.0 (IBM, Armonk, USA).
Go to :
RESULTS
Comparison of the quality of RNA from FF and FFPE tissues
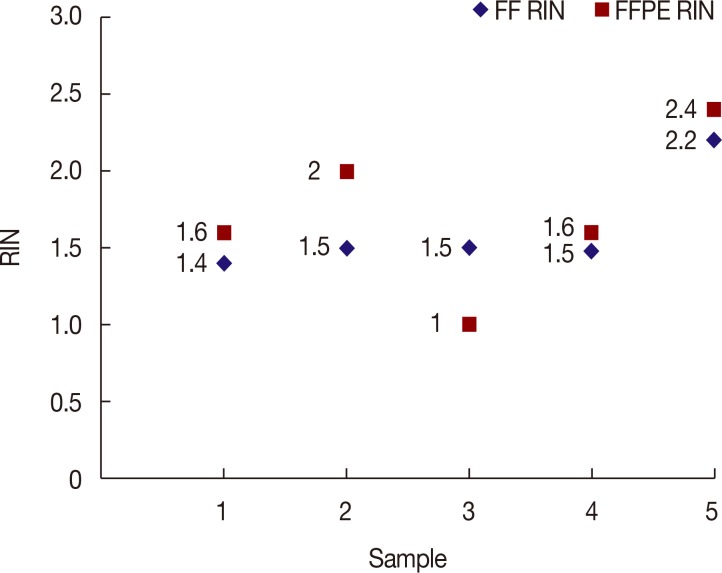
RINs of paired RNAs extracted from FF and FFPE tissues are shown in Figure 2. Average RINs of RNA from FF and FFPE were 1.62 (minimum, 1) and 1.72 (minimum, 1.4), respectively. The disparity between the two was not statistically significant, based on a paired t-test (p=0.49).
Measurement of total RNA quantity per unit area of cancer
Cancer size in each block varied widely (minimum, 40.9 mm2; maximum, 255.1 mm2). Cellularity in each cancer had a wide range, varying from 11% to 71%. Cancers were usually comprised of cancer cells, inflammatory cells, and stroma (Figure 1). Therefore, cancer cellularity was calculated to measure RNA amount per unit of true cancer area. Cancer area and cellularity results for each case are summarized in Table 4.
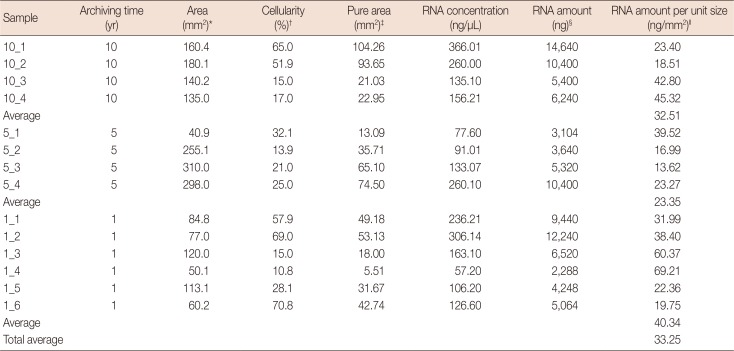
Table 4
Tumor size, cellularity, and RNA amount per unit size
![]()
RNA quantity/quality in relation to archiving time
Quantity
Average amounts of RNA per unit area of 10-, 5-, and 1-year-old FFPE tissues were 32.51, 23.35, and 40.34 ng/mm2, respectively. Total amount of RNA was not related to the age of the FFPE tissue, based on analysis of variance (F-value=1.27, F-critical value=3.98, p-value=0.32).
OD ratio and RIN value
OD ratios of 260/280 for extracted RNAs were not significantly different among 10-year-old (mean, 1.89), 5-year-old (mean, 1.89), and 1-year-old (mean, 1.93) samples (Table 5). Based on RINs, there was a negative correlation between archiving time and RNA quality (average RIN: 10-year old sample, 1.50; 5-year old sample, 1.25; 1-year old sample, 3.43; correlation coefficient=−0.49).
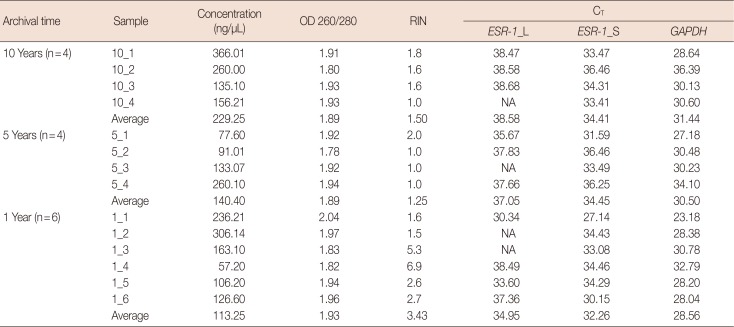
Table 5
RNA concentration, purity, and CT value
![]()
RNA quality measured by qRT-PCR
For both ESR-1 and GAPDH genes, CT values were two to three cycles lower for 1-year-old samples than for 10-year-old samples when input RNA amounts were the same. The average CT value for both genes was 38.58 for ESR-1_L (the longer primer) and 34.41 for ESR-1_S (the shorter primer). It was 31.44 for GAPDH in 10-year-old samples; 37.05 for ESR-1_L, 34.45 for ESR-1_S, and 30.05 for GAPDH in 5-year-old samples; and 34.95 for ESR-1_L, 32.36 for ESR-1_S, and 28.56 for GAPDH in 1-year-old samples (Table 5). All CT values showed a positive relationship with archiving time (correlation coefficient=0.58 for ESR-1_L, 0.38 for ESR-1_S, and 0.39 for GAPDH). This indicates that the archiving time affects RNA quality.
Effect of amplicon size on qRT-PCR performance
The short amplicon primer design for the ESR-1 gene showed lower CT values (10-year, 34.41; 5-year, 34.45; 1-year, 32.26) and a 100% success rate, while the long amplicon primer design showed higher CT values (10-year, 38.58; 5-year, 37.05; 1-year, 34.95) and a relatively low success rate (71.4%) (Table 5). As expected, the short amplicon primer design is more efficient for qRT-PCR when using RNA extracted from old FFPE samples.
Comparison of RNA quality of FFPE samples between two different institutions, using qRT-PCR
Under the same qRT-PCR assay conditions, FFPE samples from two different institutions showed significantly different qRT-PCR performance. A total of 50 and 46 samples from center A and center B were tested, respectively. In samples from center A, mean CT values for ACTB, GAPDH, and ESR-1 genes were 31.90, 32.21, and 31.3, respectively, with assay success rates of 84.0%, 88.0%, and 78.0%, respectively. In samples from center B, mean CT values for ACTB, GAPDH, and ESR-1 were 36.55, 36.91, and 36.02, respectively, with assay success rates of 41.3%, 47.8%, and 41.3%, respectively. Overall, qRT-PCR assays using RNA extracted from center B FFPE blocks showed lower assay success rates and higher CT values compared to those using RNA from center A FFPE blocks. The average CT value difference was 4.69 cycles (Table 6). This result indicates that RNA quality in FFPE blocks from center B was significantly lower than that in blocks from center A.
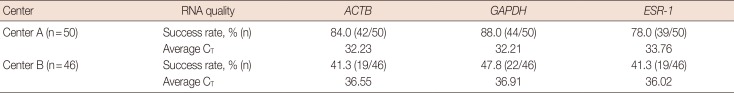
Table 6
Comparison of RNA quality of FFPE samples between center A and center B using qRT-PCR.
![]()
Comparison of RNA quality of FFPE samples between two different institutions, using NGS
RNA quantification with NGS was successful in 100% (50/50 cases) of samples from center A. However, the success rate was only 93.5% (43/46 cases) for samples from center B. For three cases, sequencing was impossible owing to insufficient total RNA. Samples from center A had average FPKM values of 31,313.31, 16,300.13, and 4,802.48 for ACTB, GAPDH, ESR-1, respectively. For samples from center B, average FPKM values were 51,369.42, 6,114.09, and 5,569.75 for ACTB, GAPDH, and ESR-1, respectively. The overall assay success rate for samples from both center A and center B was 93.4%. These results show that the RNA quality in samples from center B was lower than that in samples from center A, as indicated by the lower assay success rate. However, NGS technology appeared to be able to overcome the quality gap between samples from center A and center B. These results are summarized in Table 7.
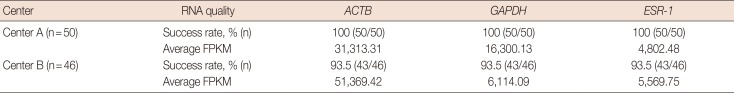
Table 7
Comparison of RNA quality of FFPE samples between center A and center B using NGS
![]()
Go to :
DISCUSSION
We expected that RNAs extracted from FF tissues would be of higher quality than those from FFPE tissues. However, based on RIN values of RNAs extracted from FF and FFPE tissues, although the sample number was small, there was no significant difference in RNA quality between FF and FFPE samples. Even when the tumor area was the same, the actual number of cancer cells varied owing to other compartments of the area, such as inflammatory cells, stromal cells, and necrotic tissue [17]. Therefore, the amount of RNA also varied. It depended not only on tumor size, but also on tumor cellularity. Through these evaluations of tumor size and cellularity using an image analyzer, the expected RNA amount per unit size was calculated to be 33.25 ng/mm2. By multiplying tumor size (mm2) and cellularity (%), researchers can calculate the expected amount of RNA from FFPE samples per 10 µm section so that they can decide how many sections should be obtained from FFPE blocks. Based on failed NGS cases due to insufficient amount of mRNA, more than 2,000 ng of mRNA was deemed necessary for NGS.
Although 10-year-old FFPE samples could not be maintained for RNA studies, a duration of storage up to 10 years did not influence qRT-PCR experiments. We had a 100% success rate in qRT-PCR assays of both 10-year-old and recently archived 1-year-old samples, using short primers for the ESR-1 gene. However, amplification was successful in 75% of 10-year-old samples and 66% of 1-year-old samples when long amplicon primers were used. Therefore, when using highly degraded RNA for quantification by RT-PCR, primer design is very important for assay success.
General performance of RNA quantification by NGS was better than that by qRT-PCR. This was because qRT-PCR used only one site for quantification of one gene, while NGS used more than 30 sites at once for each gene. This means that NGS has a better chance of capturing mRNA than qRT-PCR under the same conditions, especially in FFPE samples where the RNA is highly fragmented. Therefore, qRT-PCR primers may have lost the chance to amplify mRNA, whereas NGS still had a chance to capture mRNA using other intact sites within the same gene.
We noticed that the success rates and results between center A and center B samples were different. To identify the reason, we performed a simple survey at center A and center B. There was no significant difference in the preparation processes for FFPE samples between the two institutions, except at one step. At center A, most surgical specimens were sliced before fixation in formalin. However, at center B, specimens were sometimes stored in the refrigerator for more than 6 hours before fixation. They were then fixed without slicing the lump.
By comparison of qRT-PCR and NGS results using samples from the two centers, we confirmed that proper formalin fixation and minimizing refrigerated storage time is critical. Longer refrigerated storage time or cold ischemic time is known to have adverse effects on biochemical reactions, including immunohistochemical staining. The American Society of Clinical Oncology/College of American Pathologists has recommended that breast cancer samples should be fixed in formalin within 6 hours after surgery. Standardized specimen processing is expected to contribute to successful implementation of NGS protocols.
In summary, the results of this study suggest that targeted NGS sequencing has improved assay success rate and reliability compared with qRT-PCR for RNA quantification studies of old archived FFPE tissues or relatively poor-quality RNA samples. Short amplicon primer design is essential for quantification of RNA from long-term archived FFPE blocks by RT-PCR. The expected amount of RNA per unit size was calculated in this study. This metric can be used by other researchers to calculate the amount of RNA to isolate from FFPE specimens. Additionally, proper tissue processing before fixation is essential to obtain reliable qRT-PCR and NGS results.
Go to :
 XML Download