

 PDF
PDF ePub
ePub Citation
 Print
Print


INTRODUCTION
Genetic mutations (including BRCA1 and BRCA2), family history, and the use of estrogen plus progestin are well known risk factors for breast cancer development [12345]. Additionally, mammographic breast density is an independent risk factor for breast cancer, increasing three to six times in patients with dense compared to fatty breasts [67891011].
Background parenchymal enhancement (BPE) depends on tissue vascularity and contrast agent permeability, and may be affected by endogenous hormones and hormone replacement therapies. Recent studies have reported that BPE on magnetic resonance imaging (MRI) is a significant risk factor for breast cancer [1213].
There are many studies reporting the clinical implications of BPE, associated with recurrence-free survival and patients' outcomes [1415]. High parenchymal enhancement around tumors is associated with worse ipsilateral breast cancer recurrence-free survival in patients following breast-conserving surgery for ductal carcinoma in situ (DCIS) [16]. BPE decreases after neoadjuvant chemotherapy, and the degree of BPE reduction correlates with tumor response [17] and recurrence-free survival after neoadjuvant chemotherapy [18]. Compared to minimal or mild BPE, moderate or marked BPE causes inaccurate estimation of cancer extent [19], along with more frequent positive resection margins, after breast-conserving surgery [20].
Positron emission tomography/computed tomography (PET/CT) using the radiotracer 18F-fluorodeoxyglucose (18F-FDG) enables imaging of the metabolic activity of breast tissue, whilst BPE reflects tissue vascularity and vessel permeability. There are few studies reporting the imaging findings of 18F-FDG PET/CT in normal breast parenchyma [2122]. The metabolic activity of normal breast parenchyma could provide a susceptible microenvironment for cancer development. It is intuitive that increased vascularity and vessel permeability are important for increased FDG uptake in normal glandular tissues. However, in previous studies, only moderate correlations were observed between BPE and FDG uptake [2122].
Therefore, the purposes of our study were to investigate the degree of glucose metabolism in the normal breast parenchyma of patients with breast cancer, in order to correlate the degree of standardized uptake value (SUV) uptake with qualitative BPE values on MRI, and to investigate changes in SUV uptake in accordance with the menstrual cycle.
Go to : 
METHODS
Patients
This retrospective study was approved by Ajou University Hospital Institutional Review Board (AJIRB-MED-MDB-17-230). Neither patient approval nor informed consent were required for the review of medical records or images.
From January 2013 to December 2015, 1,087 consecutive patients newly diagnosed with breast cancer underwent breast MRI in our hospital. Of the 1,087 patients, we excluded 515 postmenopausal patients, 144 patients who underwent 18F-FDG PET/CT more than 4 days after MRI or did not undergo initial 18F-FDG PET/CT, 11 patients with bilateral breast cancer, and 119 patients who did not know their last normal menstrual period or who had extremely irregular menstrual cycles. Finally, we included 298 premenopausal patients newly diagnosed with breast cancer, who underwent both breast MRI and 18F-FDG PET/CT, and who knew their last normal menstrual period. The mean time interval between breast MRI and 18F-FDG PET/CT was 2 days. The mean age of 298 patients was 43 years (43±6 years). Histopathologic results included: invasive ductal carcinoma, not otherwise specified (n=232), DCIS (n=16), invasive lobular carcinoma (n=21), mucinous carcinoma (n=15), metaplastic carcinoma (n=4), tubular carcinoma (n=3), invasive micropapillary carcinoma (n=6), and invasive cribriform carcinoma (n=1). Histologic and nuclear grade data were not available in six patients, and hormone receptor and human epidermal growth factor receptor 2 (HER2) data were not available in three patients. Of the 298 patients, 220 underwent surgery after initial diagnosis, and 78 underwent neoadjuvant chemotherapy after MRI.
Magnetic resonance imaging acquisition
Breast MRI was performed with patients in the prone position using a 1.5T magnet (SignaHDxt; GE Healthcare, Milwaukee, USA) with an 8-channel array breast coil.
The imaging sequence included a fat-suppressed axial T2-weighted sequence (repetition time [TR]=3,500–4,000 ms; echo time [TE]=98–108 ms; flip angle of 90°; matrix=320×256; field of view [FOV]=320×320 mm; slice thickness=3 mm) and axial T1-weighted fat suppressed three-dimensional (3D) volumetric scan (TR=5.1 ms; TE=2.4 ms; flip angle of 10°; matrix=300×300; FOV=300×300 mm; slice thickness=1.5 mm; phase acquisition time=90 seconds) that was obtained before and at five time points after intravenous injection of 0.1 mmol/L gadolinium chelate/kg body weight (Gadovist; Bayer Schering Pharma, Berlin, Germany). After the examination, postprocessing was performed including subtraction images and maximum intensity projection images.
18F-fluorodeoxyglucose positron emission tomography/computed tomography examination
Whole-body 18F-FDG PET/CT was performed in the supine position on a Discovery ST scanner (GE Healthcare). Patients fasted for at least 6 hours before each received 5 MBq/kg of FDG intravenously with a blood glucose level <150 mg/dL. Non-enhanced, low-dose CT scans were obtained from the base of the skull to the upper thigh (120 kV, 30–100 mA in the Automa mode, section width=3.75 mm). After CT scanning, seven or eight frames (3 minutes/frame) of emission PET data were acquired in the 3D mode. PET images were reconstructed using an iterative method (ordered-subsets expectation maximization with two iterations and 20 subsets; FOV=600 mm; slice thickness=3.27 mm) with attenuation correction using nonenhanced CT.
Image analysis
For MRI analysis, two breast radiologists with 8 and 15 years of experience in breast imaging reviewed the MR images in consensus. BPE was evaluated in the contralateral breast of cancer patients and categorized as minimal, mild, moderate, or marked based on Breast Imaging Reporting and Data System (BI-RADS) criteria [23]. A combination of contrast enhanced images at 90 seconds, subtraction, and maximum-intensity projection images were used to analyze BPE.
For PET/CT analysis, a specialist in nuclear medicine with 11 years of PET experience reviewed 18FDG PET/CT images on a dedicated workstation (GE Advantage Workstation 4.4; GE Healthcare). The volumetric region of interest was carefully placed in the whole glandular tissue of the contralateral normal breast. The SUVmax and SUVmean values of normal glandular tissue were calculated automatically. All SUVs were estimated based on injected dose and body weight. Patients who had minimal BPE and SUVmean values of more than 1.0 were classified as the high metabolic group, patients who had moderate or marked BPE and SUVmean values of less than 1.0 were classified as the low metabolic group, and others were classified as the average metabolic group. We compared the clinical and pathologic characteristics of these groups.
Histopathological data
Surgical specimens were evaluated according to the following histopathologic features: tumor size, histological type of carcinoma, Black nuclear grade (grade 1, poorly differentiated; grade 2, moderately differentiated; grade 3, well differentiated), modified Bloom-Richardson histological grade (grade 1, well differentiated; grade 2, moderately differentiated; grade 3, poorly differentiated), and expression of estrogen receptor (ER), progesterone receptor (PR), and HER2. ER and PR positivity were determined using a cutoff value of 10% positively stained nuclei. Tumors with HER2 scores of 3+ were considered positive. In tumors with a 2+ score, gene amplification by fluorescence in situ hybridization was used to determine HER2 status. For dichotomous analysis, nuclear grade was classified as high (grade 1) or low (grades 2 and 3), and histologic grade as low (grade 1 and 2) or high (grade 3).
Statistical analysis
We used independent t-tests to compare mean SUVmax and SUVmean values according to the dichotomized BPE group. One-way analysis of variance and post hoc Tukey range tests were used to compare mean SUVmax and SUVmean values according to the qualitative BPE grades and patients' menstrual cycles. Spearman's correlation coefficients were calculated to evaluate the correlation between BPE grade and SUVmax or SUVmean. A correlation coefficient of 0.00 to 0.39 was considered weak, 0.40 to 0.59 moderate, 0.60 to 0.79 strong, and 0.80 to 1.00 very strong. To compare the clinical and pathological data between patients with high and low metabolic parenchyma, independent t-tests, chi-square tests, and Fisher exact tests were used.
All analyses were performed using the SPSS version 23.0 statistical software package (IBM Corp., Armonk, USA), with a value of p<0.05 considered statistically significant.
Go to :
RESULTS
The mean SUVmax and SUVmean values according to four qualitative BPE grades are summarized in Table 1 and Figure 1. The mean±standard deviation (SD) SUVmax values differed significantly (p<0.001) across the minimal (1.42±0.34), mild (1.59±0.47), moderate (1.82±0.40), and marked (2.06±0.31) groups; post hoc analyses revealed statistically significant differences between the minimal and moderate (p<0.001), minimal and marked (p<0.001), mild and marked (p<0.001), and moderate and marked (p=0.026) groups, but not between the minimal and mild groups (p=0.065).
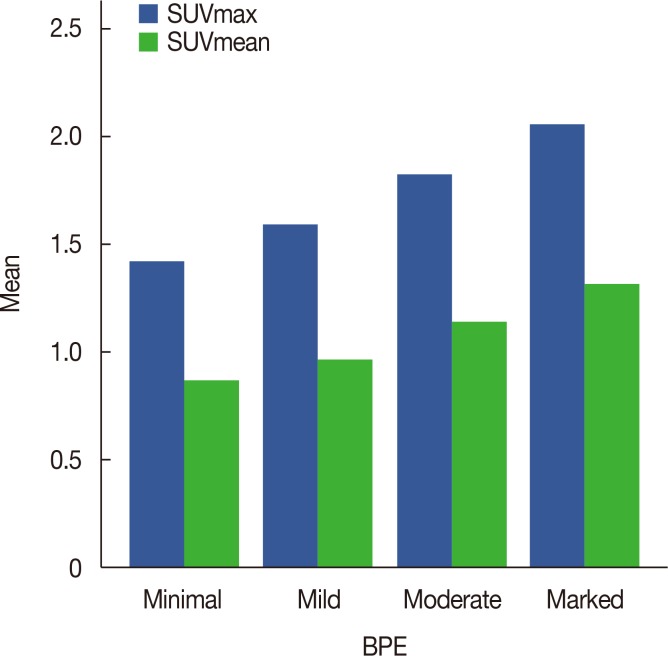 | Figure 1Mean values of maximum standardized uptake value (SUVmax) and SUVmean according to the background parenchymal enhancement (BPE) grade on magnetic resonance imaging.
|
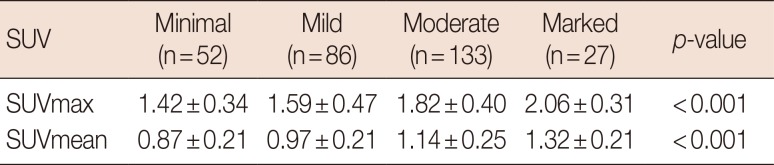
The mean±SD SUVmean values differed significant (p<0.001) across the minimal (0.87±0.21), mild (0.97±0.21), moderate (1.14±0.25), and marked (1.32±0.21) groups; post hoc analyses revealed statistically significant differences between the minimal and moderate (p<0.001), minimal and marked (p<0.001), mild and moderate (p<0.001), mild and marked (p<0.001) and moderate and marked (p=0.001) groups, but not between the minimal and mild groups (p=0.087).
Spearman's correlation coefficients revealed moderate significant correlations between BPE grade and SUVmax (r=0.472, p<0.001) and BPE grade and SUVmean (r=0.498, p<0.001).
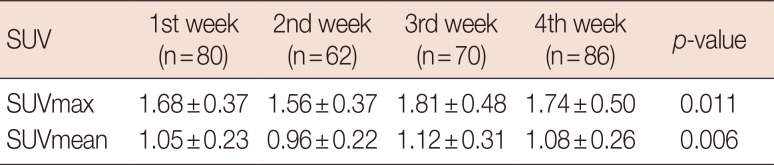
The mean SUVmax and SUVmean values according to the menstrual cycle are summarized in Table 2 and Figure 2. The mean±SD SUVmax values differed significantly (p=0.011) across the 1st (1.68±0.37), 2nd (1.56±0.37), 3rd (1.81±0.48), and 4th (1.74±0.50) weeks; post hoc analyses revealed statistically significant differences between the 2nd and 3rd weeks (p=0.007). The mean±SD SUVmean values differed significantly (p=0.006) across the 1st (1.05±0.23), 2nd (0.96±0.23), 3rd (1.12±0.31), and 4th (1.08±0.26) weeks; post hoc analyses revealed statistically significant differences between the 2nd and 3rd (p=0.003) and 2nd and 4th weeks (p=0.045).
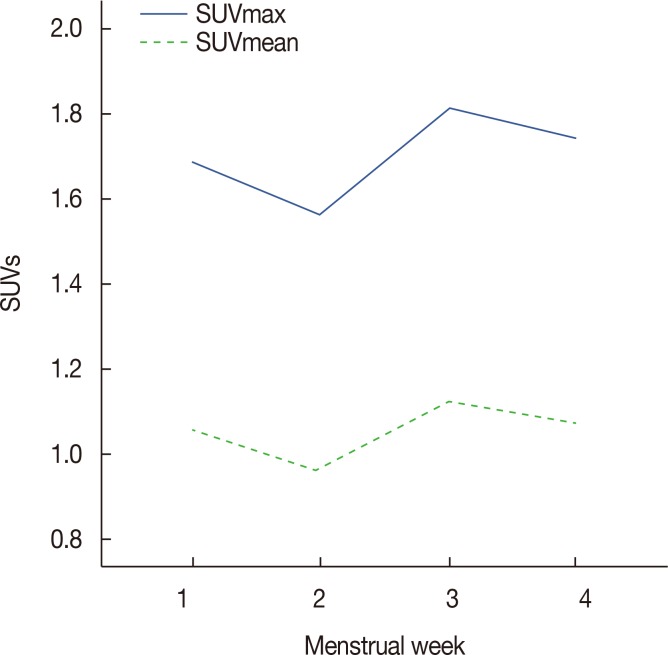 | Figure 2Mean values of maximum standardized uptake value (SUVmax) and SUVmean according to the patients' menstrual cycles.
|
Comparisons between patients with high, low, and average metabolic parenchyma (Table 3) revealed significantly different mean±SD ages between those with high and low metabolic parenchyma (40 years vs. 44 years, respectively, p=0.043). Significant differences were observed in the menstrual cycles of patients with high versus low metabolic parenchyma (p=0.002) and patients from all three groups (p=0.001); the 4th week of the menstrual cycle was more frequently observed in the low metabolic group. Other clinical and pathologic factors, including patients' heights, weights, body mass indices, histologic and nuclear grades, ER and PR, and HER2 statuses of primary breast cancer, did not differ significantly between the two groups.
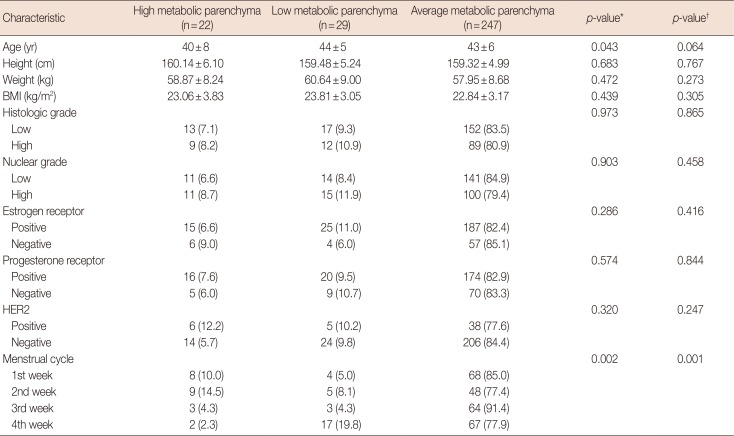
Table 3
Comparison of clinical and pathologic factors between patients with high, low, and average metabolic parenchyma
![]()
Representative cases are shown in Figures 3 and 4.
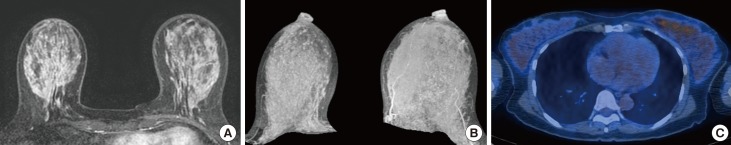 | Figure 3A 47-year-old female who has been diagnosed as breast cancer in her left breast. The patient underwent breast magnetic resonance imaging at the 3rd week of menstrual cycle. (A, B) Contrast-enhanced axial image and maximum intensity projection image show marked background parenchymal enhancement in the contralateral normal breast. (C) 18F-FDG PET/CT shows high values of SUVmax (2.6) and SUVmean (1.6).SUV=standardized uptake value; 18F-FDG PET/CT=18F-fluorodeoxyglucose positron emission tomography/computed tomography.
|
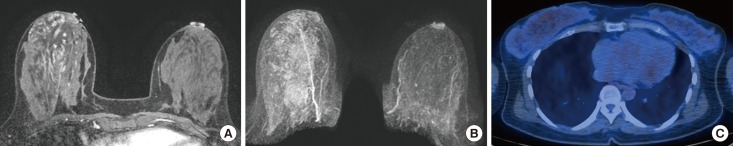 | Figure 4A 42-year-old female who has been diagnosed as breast cancer in her right breast. The patient underwent breast magnetic resonance imaging at the 2nd week of menstrual cycle. (A, B) Contrast-enhanced axial image and maximum intensity projection image show minimal background parenchymal enhancement in the contralateral normal breast. (C) 18F-FDG PET/CT shows high values of SUVmax (2.0) and SUVmean (1.3).SUV=standardized uptake value; 18F-FDG PET/CT=18F-fluorodeoxyglucose positron emission tomography/computed tomography.
|
Go to :
DISCUSSION
Our results revealed that the mean SUVmax and SUVmean values in normal glandular tissue were significantly different in terms of BPE grade, with the highest values in the marked BPE group and the lowest values in the minimal BPE group. Glucose metabolism in normal breast parenchyma was highest and lowest in the 3rd and 2nd weeks of the menstrual cycle, respectively.
A recent study by Mema et al. [22] reported similar results to our study; mean SUVmax was significantly higher in the high versus low BPE group (1.90 vs. 1.17, p<0.001), and SUVmax values significantly correlated with qualitative and quantitative measurements of BPE on MRI (p<0.001, r=0.59 and r=0.54, respectively). Our results also revealed that SUVmax values were significantly correlated with qualitative measurements of BPE on MRI, but the degree of correlation was higher in the SUVmean compared to SUVmax values (r=0.472, p<0.001 for SUVmax; r=0.498, p<0.001 for SUVmean). Mema et al. [22] concluded that the increased risk of breast cancer development in patients with high BPE could be associated with the increased metabolism of normal breast parenchyma, providing a suitable environment for cancer development.
BPE on MRI has been reported as a risk factor for breast cancer development in several studies [12132425]. In a study by Wu et al. [24], the odds ratio of malignancy was 3.5 per 20% point increases in percent of BPE in multivariate analysis controlling for menopausal status, family history of breast cancer, parenchymal density on mammography, and the amount of fibroglandular tissue on MRI. The odds ratios were similar for three subtracted images scanned at 1 minute 30 seconds, 4 minutes 30 seconds, and 7 minutes 30 seconds after contrast material injection (OR=3.5, 2.9, and 2.5, respectively). Dontchos et al. [12] reported that high risk women with mild, moderate, or marked BPE had a nine times higher probability of developing breast cancer compared to women with minimal BPE. However, some of these studies failed to analyze the effects of patients' menstrual cycles on BPE. The degree of BPE is dependent upon patients' menstrual cycles, and more precise analysis is required to determine the effect of BPE on cancer development according to the menstrual cycle.
BPE on MRI is also associated with patients' outcomes. Multivariate Cox proportional hazard analysis revealed that high BPEs were associated with worse recurrence-free survival after curative surgery in postmenopausal women (reader 1: hazard ratio=3.086, p=0.003; reader 2: hazard ratio=2.22, p=0.075) [15]. In a study by van der Velden et al. [14], parenchymal enhancement on late phase MRI was significantly associated with patients' outcomes in terms of ER-positive and HER2-negative subtypes (p=0.001). In our study, lower values for mean top 10% enhancement of the parenchyma were predictive of worse outcomes in patients who underwent endocrine therapy.
In patients with DCIS who underwent breast-conserving surgery, higher parenchymal enhancement ratios around tumors were independent factors associated with worse ipsilateral breast tumor recurrence-free survival (reader 1: hazard ratio=2.028, p<0.001; reader 2: hazard ratio=1.652, p<0.001) [16].
Breast tissue is well known to be hormonally sensitive, especially to estrogen. During the first half of the menstrual cycle, estrogen activates the proliferation of epithelial cells, differentiation of acini, thickening of basal lamina, and stimulation of collagen tissue. During the latter half of the menstrual cycle, it stimulates ballooning of the basal cell layer and dilation of the lumen of acini with secretions [26]. Estrogen also causes vacuolization of epithelial cells and vascular dilatation with increased permeability [27]. BPE is affected by estrogen, and several previous studies reported that BPE was lowest in the 2nd week of the menstrual cycle and highest in the 1st, 3rd and 4th weeks [2829]. Our study revealed that the metabolic activity of normal breast parenchyma is lowest in the 2nd week and highest in the 3rd week, with moderate correlation with BPE on MRI (r=0.472, p<0.001 for SUVmax; r=0.498, p<0.001 for SUVmean). Similarly, previous studies reported that there were moderate correlations between SUV and BPE, with correlation coefficients ranging from 0.492 to 0.59 [2122].
However, the correlation were only moderate, indicating there are some discrepancies between metabolic activity and the blood flow/vascular permeability of normal breast parenchyma in some patients. When we performed subgroup analyses, there were 29 patients with high BPE and low metabolic activity; 17 (58.6%) of these patients were in their 4th week of their menstrual cycle. Thus, the metabolic activity of breast glandular tissue is relatively low compared to the high blood flow and permeability of vessels. By contrast, of the 22 patients with high metabolic parenchyma, eight (36.4%) were in the 1st and nine (40.9%) were in the 2nd weeks of their menstrual cycles, indicating that metabolic activity was relatively high compared to blood flow or vessel permeability.
There are several limitations to our study. First, this is a retrospective study from a single institution and larger studies are required to validate the results. Second, BPE was analyzed qualitatively, based on the BI-RADS criteria. Although quantitative analysis could be more objective and reproducible, many studies have shown that qualitative BPE grading accurately reflects clinical implications. Third, we could not analyze the clinical implications of low or high metabolic parenchyma in patients with breast cancer, given the small number of patients and short duration of follow-up. A larger study with a long follow-up period is needed to evaluate the effect on patients and other clinical outcomes.
In conclusion, the metabolic activity of normal breast parenchyma is highest and lowest in the 3rd and 2nd weeks of the menstrual cycle, respectively, with moderate correlations with BPE on MRI. Metabolic activity tends to be lower than blood flow or vessel permeability in the 4th week of the menstrual cycle.
Go to :
 XML Download