

 PDF
PDF ePub
ePub Citation
 Print
Print


INTRODUCTION
METHODS
Data collection
ER, PR, HER2, and Ki-67 evaluation
Statistical analysis
RESULTS
Patient characteristics
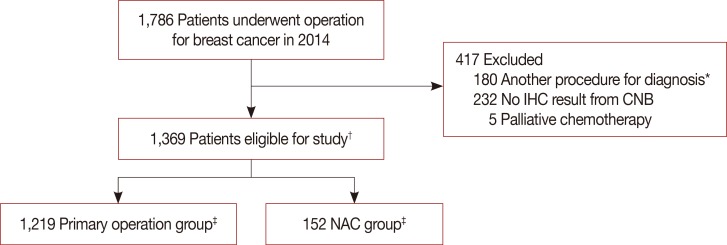 | Figure 1Flow chart of patients selection for analysis.CNB=core needle biopsy; IHC=immunohistochemistry; NAC=neoadjuvant chemotherapy. *Underwent vacuum-assisted biopsy, excisional biopsy or had previous breast surgery; †Two patients diagnosed both breast cancer; ‡Each 1 patients who had both breast cancer underwent operation and NAC prior to surgery.
|
Table 1
Patient characteristics and clinicopathological results
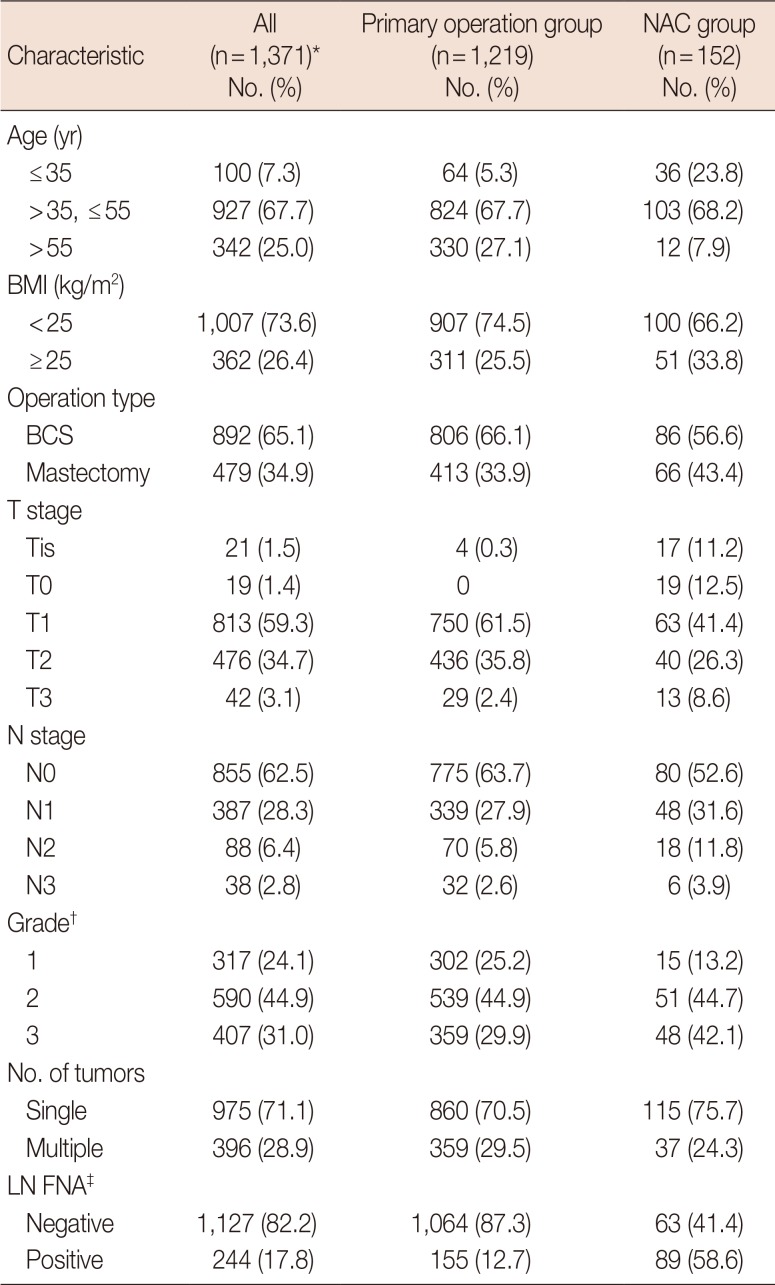
NAC=neoadjuvant chemotherapy; BMI=body mass index; BCS=breastconserving surgery; LN FNA=lymph node fine needle aspiration.
*Some mismatches were caused by two patients who underwent surgery on both breasts. See Figure 1; †Grade and number of tumors evaluated by surgical specimen; ‡Preoperative LN metastasis was determined by FNA.
![]()
Tumor pathology and IHC results
Table 2
Tumor pathology and IHC test results between the primary operation group and NAC group
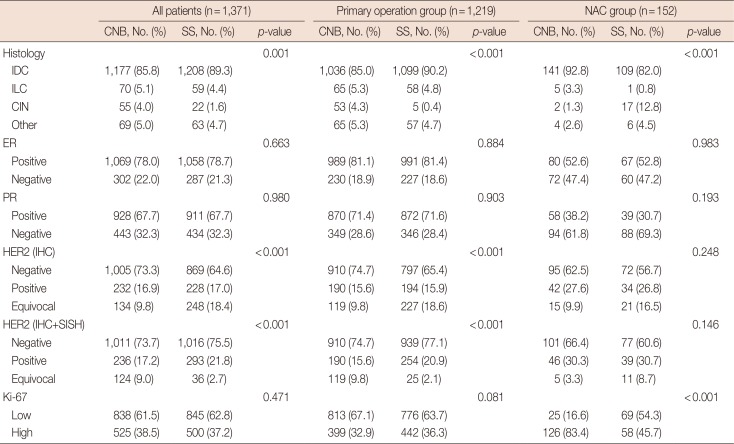
IHC=immunohistochemistry; NAC=neoadjuvant chemotherapy; CNB=core needle biopsy; SS=surgical specimens; IDC=invasive ductal carcinoma; ILC=invasive lobular carcinoma; CIN=carcinoma in situ; ER=estrogen receptor; PR=progesterone receptor; HER2=human epidermal growth factor receptor 2; SISH=silver in situ hybridization.
![]()
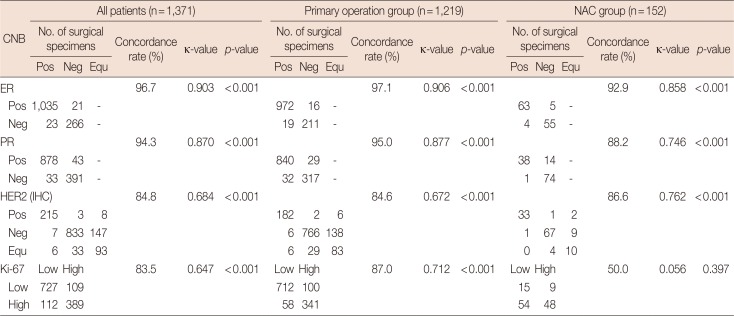
Concordance of IHC results
Table 3
Agreement analysis of ER, PR, HER2, and Ki-67 between CNB and surgical specimens
![]()
Concordance among intrinsic biological subtypes
Table 4
Agreement analysis between CNB and surgical specimens for intrinsic biological subtypes
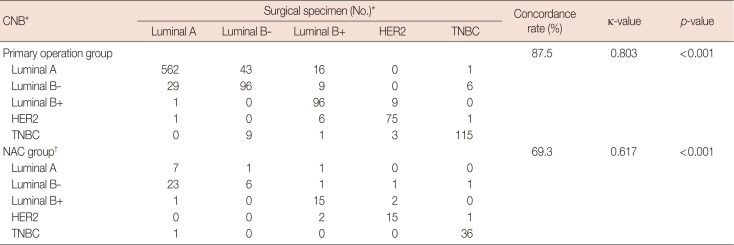
CNB=core needle biopsy; NAC=neoadjuvant chemotherapy; HER2=human epidermal growth factor receptor 2; TNBC=triple-negative breast cancer.
*Luminal A (ER+ and/or PR+, HER2-, Ki-67 low); luminal B- (ER+ and/or PR+, HER2-, Ki-67 high); luminal B+ (ER+ and/or PR+, any Ki-67, HER2+); HER2 (ER-, PR-, HER2+); and TNBC (ER-, PR-, HER2-); †Total 114 patients after excluding 38 from 152 NAC group. Thirty-eight patients were group who were HER2 2+ and did not have silver in situ hybridization results, or pathologic complete response group who did not have immunohistochemistry results after NAC. Overall concordance rate 85.8%, κ-value of 0.786 and p-value < 0.001.
![]()
pCR rate according to the intrinsic biological subtypes in NAC patients
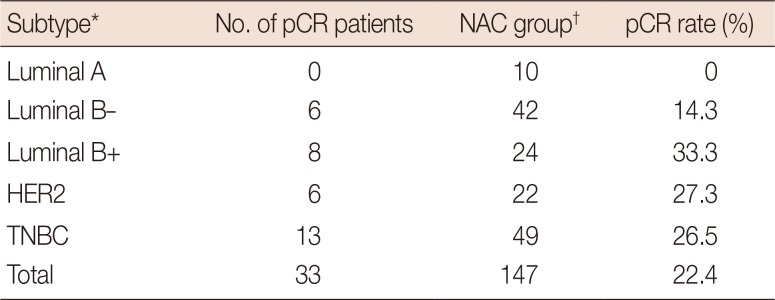
Table 5
pCR rate according to the intrinsic biological subtypes from CNB in NAC patients
| Subtype* | No. of pCR patients | NAC group† | pCR rate (%) |
|---|---|---|---|
| Luminal A | 0 | 10 | 0 |
| Luminal B– | 6 | 42 | 14.3 |
| Luminal B+ | 8 | 24 | 33.3 |
| HER2 | 6 | 22 | 27.3 |
| TNBC | 13 | 49 | 26.5 |
| Total | 33 | 147 | 22.4 |
pCR=pathologic complete response; CNB=core needle biopsy; NAC=neoadjuvant chemotherapy; HER2=human epidermal growth factor receptor 2; TNBC=triple-negative breast cancer.
*Classified from CNB result. luminal A (ER+ and/or PR+, HER2-, Ki-67 low); luminal B- (ER+ and/or PR+, HER2-, Ki-67 high); luminal B+ (ER+ and/or PR+, any Ki-67, HER2+); HER2 (ER-, PR-, HER2+); and TNBC (ER-, PR-, HER2-); †Five patients were equivocal HER2 result and cannot classified subtype.
![]()
DISCUSSION
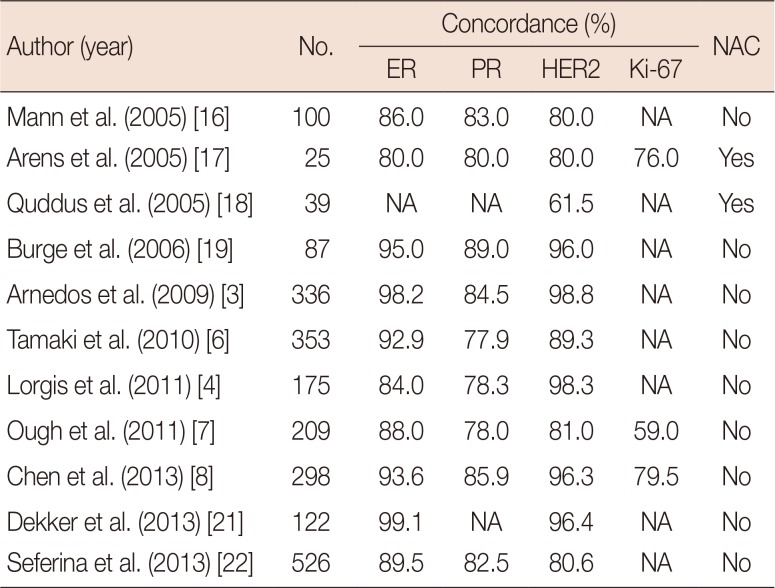
Table 6
Concordance rate between CNB and surgical specimens in previous studies
| Author (year) | No. | Concordance (%) | NAC | |||
|---|---|---|---|---|---|---|
| ER | PR | HER2 | Ki-67 | |||
| Mann et al. (2005) [16] | 100 | 86.0 | 83.0 | 80.0 | NA | No |
| Arens et al. (2005) [17] | 25 | 80.0 | 80.0 | 80.0 | 76.0 | Yes |
| Quddus et al. (2005) [18] | 39 | NA | NA | 61.5 | NA | Yes |
| Burge et al. (2006) [19] | 87 | 95.0 | 89.0 | 96.0 | NA | No |
| Arnedos et al. (2009) [3] | 336 | 98.2 | 84.5 | 98.8 | NA | No |
| Tamaki et al. (2010) [6] | 353 | 92.9 | 77.9 | 89.3 | NA | No |
| Lorgis et al. (2011) [4] | 175 | 84.0 | 78.3 | 98.3 | NA | No |
| Ough et al. (2011) [7] | 209 | 88.0 | 78.0 | 81.0 | 59.0 | No |
| Chen et al. (2013) [8] | 298 | 93.6 | 85.9 | 96.3 | 79.5 | No |
| Dekker et al. (2013) [21] | 122 | 99.1 | NA | 96.4 | NA | No |
| Seferina et al. (2013) [22] | 526 | 89.5 | 82.5 | 80.6 | NA | No |
![]()
 XML Download