

 PDF
PDF ePub
ePub Citation
 Print
Print


INTRODUCTION
Inflammation plays a crucial role in carcinogenesis, tumor progression, and metastasis of various cancers [123]; therefore, many researchers have investigated the prognostic roles of systemic inflammatory markers on various cancers. The systemic inflammatory markers investigated include single markers such as C-reactive protein [4], albumin [5], neutrophils [6], platelets [7], lymphocytes [8], and fibrinogen [9], and also combinations of several single markers in the forms of ratios or scoring systems such as the Glasgow prognostic score [10], neutrophil to lymphocyte ratio [11], platelet to lymphocyte ratio [12], and lymphocyte to monocyte ratio [13]. The prognostic influence of systemic inflammatory markers have been reported for various cancers such as colorectal cancer, gastric cancer, ovarian cancer, prostate cancer, renal cell carcinoma, esophageal cancer, pancreas cancer, hepatocellular carcinoma, gall bladder cancer, bladder cancer, thymic cancer, and squamous cell carcinoma [1415].
Recently, systemic inflammatory markers have also been reported to have a prognostic association with breast cancer. Most of these studies reported the prognostic roles of the neutrophil to lymphocyte ratio [16], platelet to lymphocyte ratio [17], or the Glasgow prognostic score [18] in breast cancer. Little information has been unveiled about the prognostic roles of fibrinogen [19] or albumin [20] as single markers or in combination for breast cancer.
Our hypothesis is that if the single markers fibrinogen and albumin have significant prognostic value for breast cancer, the fibrinogen to albumin ratio (FAR) could be a more significant prognostic marker than each single marker itself. Since elevated serum concentrations of fibrinogen and decreased serum concentrations of albumin have been reported to be markers of elevated systemic inflammation [59], elevated FAR might be associated with a worse prognosis. In our institution, laboratory tests are routinely performed for fibrinogen and albumin before curative surgery for all primary breast cancer patients. If fibrinogen and albumin have prognostic roles, especially FAR, they could be easily utilized to predict the outcomes of breast cancer patients in the clinical setting. To our best knowledge, this is the first study that proposes FAR as a prognosticator in breast cancer.
In this study, we investigated the prognostic roles of preoperative systemic inflammatory markers, fibrinogen and albumin, especially FAR, in breast cancer in terms of overall survival. We further analyzed the effect of FAR on each molecular subgroup of breast cancer using a breast cancer database from Seoul National University Boramae Medical Center.
METHODS
Patients
Consecutive primary invasive breast cancer patients who underwent curative surgery at Seoul National University Boramae Medical Center were enrolled for this study. Patients who received neoadjuvant therapy were excluded. The total number of patients who were registered in our database at the time of this study was 1,300. We excluded 40 patients who were diagnosed as stage IV and 152 patients who were diagnosed as carcinoma in situ at initial diagnosis. We further excluded 34 patients with stages unknown. After further excluding 270 patients without data for necessary laboratory values and 11 patients who received neoadjuvant chemotherapy, finally data for 793 patients were analyzed. The Institutional Review Boards of Seoul National University Boramae Medical Center approved this study (26-2016-116).
Clinicopathologic parameters
Patients' ages were defined as age at the time of diagnosis of primary breast cancer. TNM staging was determined according to the seventh edition of the American Joint Committee on Cancer. Hormonal receptor status was defined as positive when immunohistochemistry tests for either estrogen or progesterone receptors were positive. It was defined as negative when both tests were negative. Human epidermal growth factor receptor 2 (HER2) was defined as negative when immunohistochemistry results were negative or 1+. It was defined as positive when the results were 3+. When the results were 2+, we defined the positivity of HER2 according to the results of fluorescence in situ hybridization. Histologic grade was defined according to the modified Scarff-Bloom-Richardson grading system. Lymphovascular invasion was defined as positive when either lymphatic invasion or vascular invasion was present. It was defined as negative when both were absent. Body mass index (BMI) was defined as the ratio of body weight in kilograms to the square of height in meters. All operations with curative intent for breast cancer patients were classified into lumpectomy or mastectomy according to the extent of surgery. Molecular subtypes were classified into the following four categories: luminal A-like (hormone receptor positive and HER2 negative), luminal B-like (hormone receptor positive and HER2 positive), HER2 (hormone receptor negative and HER2 positive), and triple negative (hormone receptor negative and HER2 negative).
Definitions of fibrinogen to albumin ratio
After the diagnosis of primary breast cancer, peripheral blood samples were obtained and tested for each patient during the 2 weeks before surgery. FAR was defined as the concentration ratio of fibrinogen (mg/dL) to albumin (mg/dL) multiplied by 100: (fibrinogen in mg/dL/albumin in mg/dL)×100. Receiver operating characteristic (ROC) curve analysis was used to determine the optimal cutoff values for fibrinogen, albumin, and FAR in terms of overall survival. The optimal cutoff value was selected as the maximal point of the sum of sensitivity and specificity. In this study, the optimal cutoff value for FAR was 7.1. Accordingly, subjects were classified into two groups: the high FAR group (FAR>7.1) and the low FAR group (FAR≤7.1). The optimal cutoff values for fibrinogen and albumin were 299.0 and 4.1 mg/dL, respectively.
Statistical analyses
Two sample t-test and Pearson chi-square test were used for determining the differences in clinicopathologic characteristics between groups. All survival analyses were carried out in terms of overall survival. Time duration of overall survival was defined as the time from operation to death from any cause. The Kaplan-Meier estimator was used to analyze survival rates and the log-rank test was used to determine the significance of differences between the two survival curves. The Cox proportional hazards model was used for univariate and multivariate analyses. The hazard ratio (HR) was estimated with 95% confidence interval (CI). A biological model, treatment model, and combined model were designed for multivariate analyses. In the biological model, nine factors including age, tumor size, node positivity, hormone receptor, HER2, histologic grade, lymphovascular invasion, Ki-67, and BMI were used to adjust for FAR. In the treatment model, four factors including operation, radiation therapy, chemotherapy, and hormonal therapy were used. In the combined model, all thirteen factors described above were used. All statistical analyses except forest plots were carried out using IBM SPSS version 20.0 (IBM Corp., Armonk, USA) and R program (version 3.3.2). The forest plot was drawn using Microsoft Excel, Microsoft Office Professional Plus 2010 (Microsoft Corp., Redmond, USA). All tests were two-sided. Statistical significance was defined as when the p-value was less than 0.05.
RESULTS
Clinicopathologic characteristics
The total number of subjects was 793. Their mean age was 54.1±12.3 years. Surgery dates were between January 2000 and June 2016. The mean follow-up period was 57.2±44.5 months (median, 44.0 months; range, 0–197 months). The total number of deaths during this period was 64 (8.1%). The number of subjects classified into the high FAR group and the low FAR group were 255 (32.2%) and 538 (67.8%), respectively. Clinicopathologic characteristics according to FAR are summarized in Table 1. Those in the high FAR group had a higher mean age with higher proportions of age >50 years, tumor size >2 cm, positive lymph nodes, stage II/III, and BMI >25 compared to those in the low FAR group. There was no statistically significant difference in other parameters including hormonal receptor, HER2, histologic grade, lymphovascular invasion, Ki-67, operation, radiation therapy, chemotherapy, or hormonal therapy between the two groups.
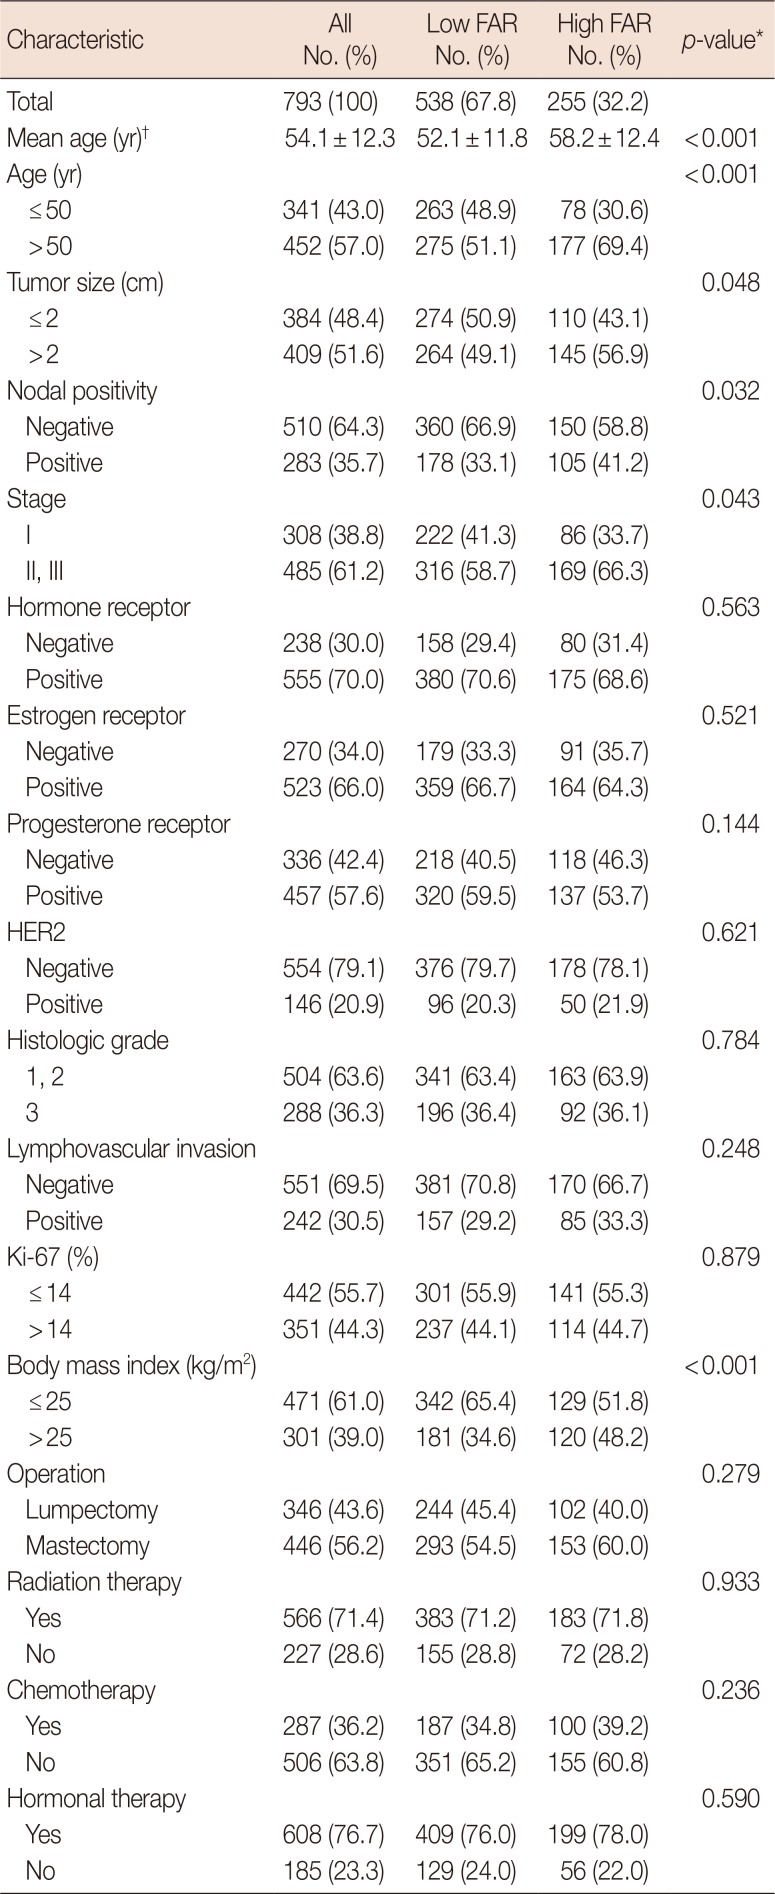
Table 1
Clinicopathologic characteristics according to fibrinogen to albumin ratio
![]()
Results for fibrinogen, albumin, and fibrinogen to albumin ratio
Means, standard deviations, and ranges of laboratory results for fibrinogen, albumin, and FAR were 284.6±61.9 mg/dL (range, 149.8–686.6 mg/dL), 4.2±0.2 mg/dL (range, 3.0–5.0 mg/dL), and 6.8±1.6 (range, 3.3–17.6), respectively. Box plots for fibrinogen, albumin, and FAR are depicted in Supplementary Figure 1 (available online). The optimal cutoff values for fibrinogen, albumin, and FAR were 299.0 mg/dL, 4.1 mg/dL, and 7.1, respectively.
Survival analyses and ROC curve analysis
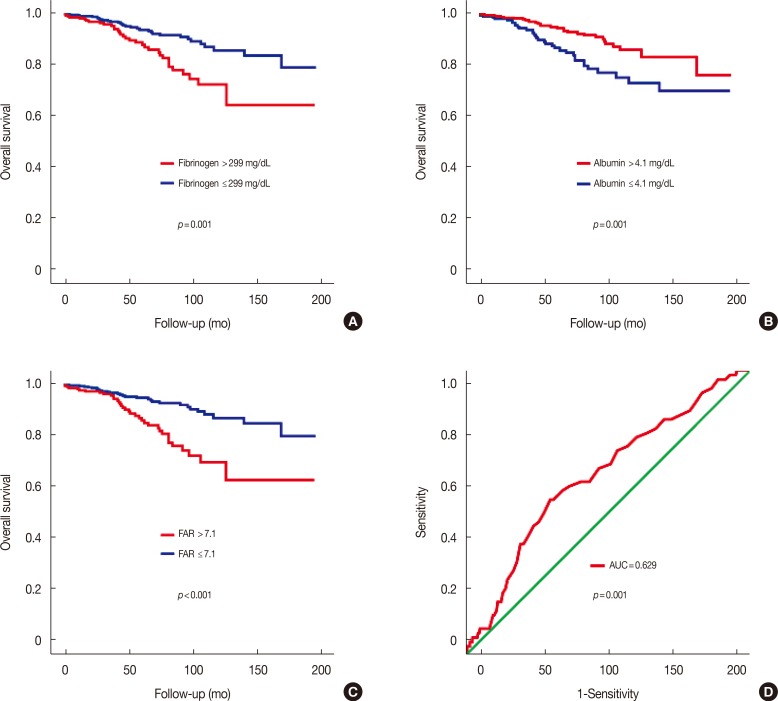
Subjects were divided into two groups according to the optimal cutoff values of fibrinogen (299.0 mg/dL), albumin (4.1 mg/dL), and FAR (7.1). The log-rank test revealed better overall survival rates in the low fibrinogen group (log-rank test, p=0.001) (Figure 1A), high albumin group (log-rank test, p=0.001) (Figure 1B), and low FAR group (log-rank test, p<0.001) (Figure 1C). Among these groups, the p-value was the lowest (the most significant) in the survival curve according to FAR. ROC curve analysis for FAR showed that the area under the curve was 0.629 (p=0.001) (Figure 1D). With a cutoff value of 7.1 for FAR, its sensitivity and specificity were 0.574 and 0.691, respectively.
Subgroup analyses
The Cox proportional hazards model showed a worse prognosis for the high FAR group compared to the low FAR group (HR, 2.722; 95% CI, 1.659–4.468; p<0.001) (Figure 2). Although the high FAR group showed worse prognoses in most subgroups, there was no significant survival difference among subgroups with tumor size ≤2 cm, negative lymph nodes, stage I, negative hormonal receptor, histologic grade 3, or lumpectomy.
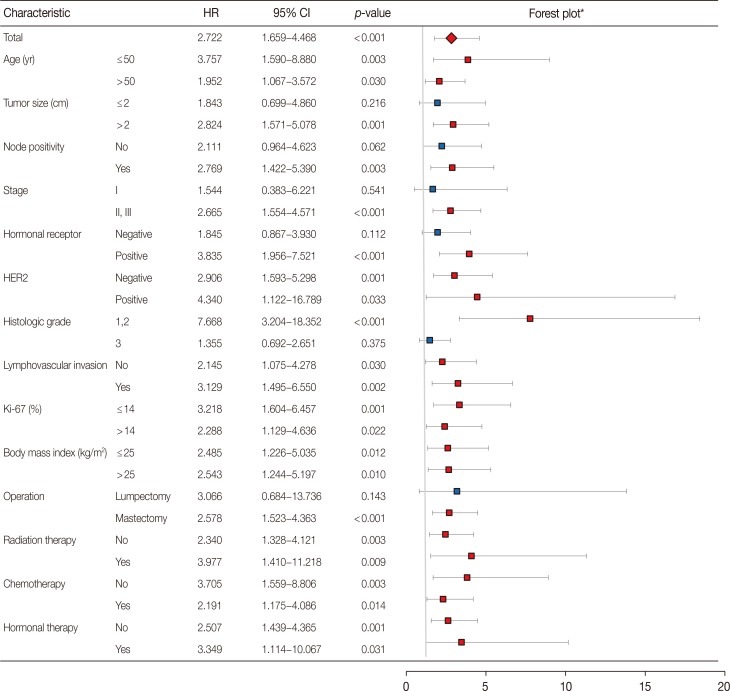
Figure 2
Subgroup analyses with a forest plot for the effect of the fibrinogen to albumin ratio with respect to overall survival according to clinicopathologic characteristics.
HR=hazard ratio; CI=confidence interval; HER2=human epidermal growth factor receptor 2.
*In the forest plot, a HR value more than 1 favors low fibrinogen to albumin ratio against high fibrinogen to albumin ratio. Red color means a statistical significance and blue color means no statistical significance.
![]()
Univariate and multivariate analyses
Univariate analyses revealed that the following 11 variables were statistically significant prognostic factors: age, tumor size, node positivity, stage, hormone receptor, histologic grade, lymphovascular invasion, operation, radiation therapy, and chemotherapy (Table 2). Multivariate analyses showed that FAR was a statistically significant independent factor in the following models: the biological model (HR, 2.614; 95% CI, 1.468–4.653; p=0.001), the treatment model (HR, 2.566; 95% CI, 1.557–4.230; p<0.001), and the combined model (HR, 2.622; 95% CI, 1.455–4.724; p=0.001). Although age, node positivity, histologic grade, lymphovascular invasion, and radiation therapy were significant factors in univariate analyses, they lost their significance in multivariate analyses.
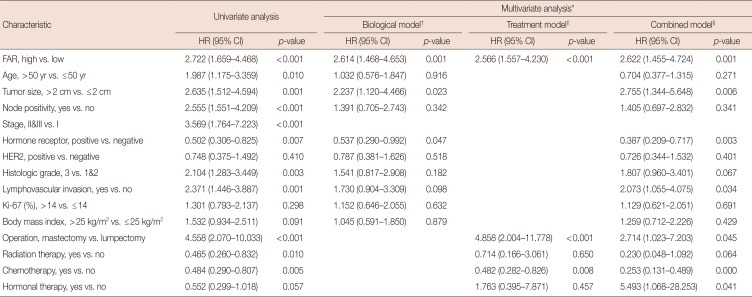
Table 2
Univariate and multivariate analyses with respect to overall survival
HR=hazard ratio; CI=confidence interval; FAR=fibrinogen to albumin ratio; HER2=human epidermal growth factor receptor 2.
*Three models including the biological model, treatment model, and combined model were used for multivariate analyses; †FAR was adjusted with nine factors including age, tumor size, node positivity, hormonal receptor, HER2, histologic grade, lymphovascular invasion, Ki-67 and body mass index; ‡FAR was adjusted with four factors including operation, radiation therapy, chemotherapy and hormonal therapy; §FAR was adjusted with all 13 factors described above.
![]()
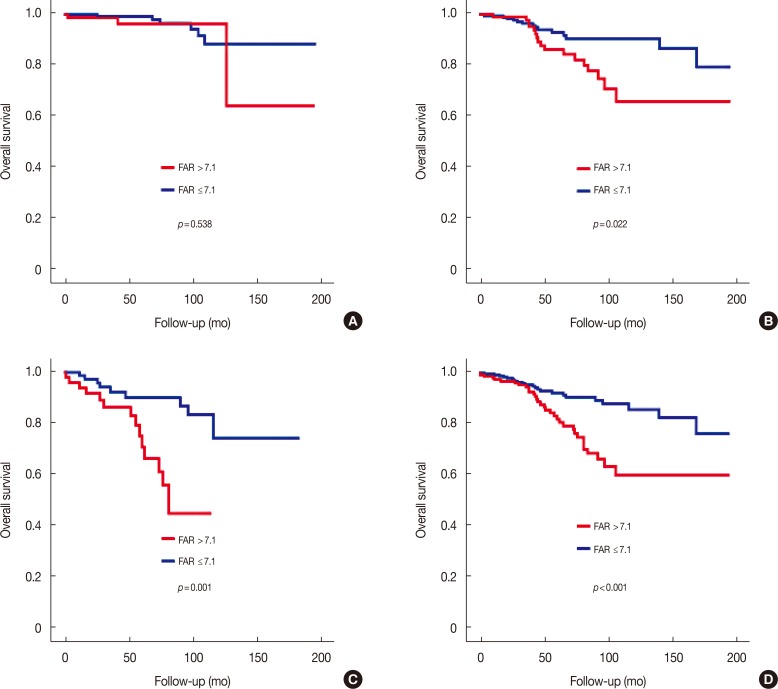
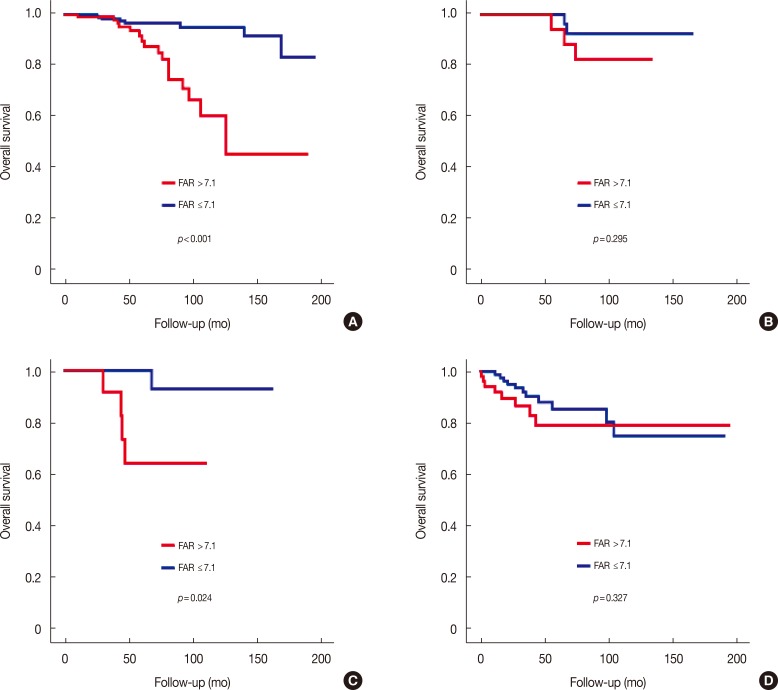
Survival analyses according to stages and molecular subtypes of breast cancer
The prognostic influence of FAR for breast cancer was different according to stage and molecular subtype. Although FAR was not a prognosticator in stage I (log-rank test, p=0.538) (Figure 3A), it became a significant prognosticator in stage II (log-rank test, p=0.022) (Figure 3B). FAR was also a strong prognosticator in stage III (log-rank test, p=0.001) (Figure 3C) and stage II/III (log-rank test, p<0.001) (Figure 3D). Regarding molecular subtypes, the prognostic influence of FAR was most significant in the luminal A-like subtype (log-rank test, p<0.001) (Figure 4A). Although FAR showed marginal significance in the HER2 subtype (log-rank test, p=0.024), it did not show any significance in the luminal B-like or triple negative subtypes (Figure 4).
DISCUSSION
This study showed that FAR was a significant and powerful independent prognostic factor in breast cancer. This study is the first to report the prognostic usefulness of FAR in the field of cancer research. Although both serum fibrinogen and serum albumin were significant prognostic factors in this study, FAR was a more powerful prognosticator compared to single marker fibrinogen or albumin. In this study, the log-rank test showed that the p-value of FAR was lower (more significant) than the p-value of fibrinogen or albumin alone. Because both serum fibrinogen and serum albumin are measured as a unit of concentration, we could use their ratio as a new marker. Since fibrinogen is directly correlated with systemic inflammation while albumin is inversely correlated with systemic inflammation, the correlation of FAR with inflammation could be predicted. As a result, FAR could improve the prognostic effect of each single marker. Furthermore, clinical application of FAR could be more useful because using a single marker (FAR) is often more convenient than using two markers (fibrinogen, albumin) in a clinical setting.
A few papers have reported the prognostic significance of preoperative serum fibrinogen concentration for breast cancer. One paper reported that elevated preoperative plasma fibrinogen was independently associated with poor prognosis in breast cancer patients (HR, 1.475; 95% CI, 1.177–1.848; p=0.001) [21]. Another paper reported that elevated preoperative plasma fibrinogen levels were independently associated with poor prognosis in patients with operable breast cancer (HR, 10.1; 95% CI, 2.3–44.6; p=0.002) [19], and one reported that elevated preoperative plasma fibrinogen level had a marginal prognostic correlation with disease specific survival (HR, 1.71; 95% CI, 1.02–2.85; p=0.042) and overall survival (HR, 1.62; 95% CI, 1.01–2.61; p=0.048) [22]. Several studies have reported that preoperative serum albumin levels were associated with the prognosis of breast cancer. One paper reported that low levels of serum albumin were adversely associated with survival of all stages of breast cancer (HR, 3.53; p=0.0033) [20]. Another paper reported that patients with higher albumin level had a 45% reduced risk of death (HR, 0.55; 95% CI, 0.40–0.75; p<0.001) compared to those with lower albumin levels [23]. Other papers have reported the prognostic usefulness of a combination of serum albumin with other markers such as nutritional index (serum albumin with lymphocyte count) [24], Glasgow prognostic score (serum albumin with C-reactive protein) [18], and albumin to globulin ratio (serum albumin with globulin) [25] in breast cancer.
To the best of our knowledge, there has been only one published paper regarding FAR and it reported that FAR was significantly related to the SYNTAX score in predicting the severity of coronary artery disease in patients with ST-elevation myocardial infarction [26]. The use of FAR has never previously been reported in the field of cancers including breast cancer. This study is the first to report FAR as a prognosticator in cancer.
Univariate and multivariate analyses showed that FAR was a strong significant independent prognostic factor in breast cancer. FAR was not only a significant factor in univariate analyses, but also a significant factor in multivariate analyses. FAR remained a significant factor in all three models (biological model, treatment model, and combined model). Clinicopathologic features according to FAR showed that the higher FAR group showed higher proportions of age >50 years, tumor size >2 cm, positive lymph node, and stage II/III compared to the lower FAR group. In the biological model, FAR remained significant after being adjusted for other factors. The results of the combined model showed that FAR was a powerful prognosticator even after being adjusted for 13 important clinicopathologic parameters of breast cancer.
In this study, the prognostic effect of FAR was more prominent as the stage of cancer advanced. In earlier stages, as the prognostic effect of stage itself might be stronger, the prognostic influence of FAR might be less prominent. With the same hypothesis, the prognostic role of FAR could be more prominent in advanced stages of breast cancer. Subgroup analyses revealed similar findings. FAR was a significant prognosticator in subgroups with tumor size >2 cm, positive lymph nodes, and stage II/III. However, it was not a significant factor in subgroups with tumor size ≤2 cm, negative lymph nodes, and stage I. There was a paper reporting that preoperative plasma fibrinogen levels were significantly higher in more advanced stages [19]. Another paper reported that the HRs of groups with elevated fibrinogen levels were significantly higher in more advanced stages [21].
In this study, the prognostic association of FAR was the most prominent in the luminal A-like subtype. Although FAR had a marginal association in the HER2 subtype, it had no association in the luminal B-like or triple negative subtype. Subgroup analyses showed that the prognostic association of FAR was only significant in subgroups positive for hormone receptors. FAR was also more significant in subgroups with negative HER2 status. These findings could partly explain the different prognostic associations of FAR across the various molecular subtypes of breast cancer.
Because this study is the first to explore the use of FAR in cancer research, the prognostic effect of FAR across molecular subtypes of breast cancer remains unclear. However, several papers have reported the prognostic influence of serum fibrinogen on molecular subtypes of breast cancer. They might provide indirect information on the relationship between FAR and molecular subtypes. Although some papers have reported that elevated fibrinogen level is an unfavorable prognostic parameter in luminal subtypes and triple-negative subtypes [21], other papers have reported that preoperative plasma fibrinogen level is not a significant prognostic factor in all molecular subtypes in terms of disease-free survival and overall survival [19]. There was also a paper reporting that while elevated preoperative plasma fibrinogen level is a significant prognostic factor in luminal A-like subtype in terms of disease specific survival (HR, 3.63; 95% CI, 1.37–9.64; p=0.010), it was not a significant prognostic factor in terms of overall survival [22].
Although this study showed that FAR was a powerful prognosticator in breast cancer for the first time in the field of cancer research, it had several limitations. First, because the number of the subjects was relatively small, the statistical power might be limited, especially in subgroup analyses. Second, because the results of this study were not validated externally, further study is needed, including external validation. Third, because the serum concentration level for fibrinogen was only tested preoperatively, we could not analyze the prognostic role of postoperative FAR. Based the main results of this study, more active treatments may be effective to improve the outcomes of the high FAR group, especially in the subgroups with stage II/III and/or luminal A-like subtypes. Although more active treatment modalities such as chemotherapy and hormonal therapy might be utilized in clinical settings, further studies need to performed to validate these findings.
In conclusion, preoperative FAR was a strong and significant independent unfavorable prognosticator of breast cancer, especially in stage II/III and luminal A-like subgroups. FAR can easily be utilized in a clinic setting with routine preoperative laboratory tests for fibrinogen and albumin to predict the outcomes of breast cancer patients. Further studies are needed to validate the clinical application of FAR in breast cancer.
 XML Download