

 PDF
PDF ePub
ePub Citation
 Print
Print


INTRODUCTION
Breast cancer is one of the most commonly diagnosed cancers in women worldwide and one of the leading causes of cancer-related death among women [1234]. Because of its heterogeneity, breast cancer recurs in some patients but not in others [5]. Clinically, this heterogeneous disease is categorized based on three basic breast cancer biomarkers defined by immunohistochemistry of estrogen rector (ER), progesterone receptor (PR), and human epidermal growth factor receptor 2 (HER2) [67].
A number of whole genome/exome and transcriptome profiling studies have identified different genes involved in breast cancer progression [8]. For instance, insulin growth factors have been implicated in breast tumorigenesis because of their ability to stimulate mitogenesis and promote differentiation [9]. Amplification and overexpression of ERBB2 and EGFR genes were shown to be associated with increased tumor growth in breast cancer [10]. In addition, copy number variations (CNVs) in other genes, including AKT2, MAP3K1, MAP3K13, NCOR1, and SMARCD1, were also found to be associated with breast carcinogenesis [1112].
Transcriptome profiling studies led to the identification of gene signatures for the early-stage diagnosis of breast cancer patients [13]. For instance, Oncotype DX® (24 genes), MammaPrint™ (70 genes), and Genomic Grade Index (97 genes) are first-generation gene signatures in breast cancer that predict the early recurrence of cancer (i.e., within 5 years) [14]. Additionally, gene signatures including Prosigna, EndoPredict®, and Breast Cancer IndexSM can predict the late recurrence of breast cancer [14]. However, no studies have identified gene signatures specifically using information at the copy number level. A previous study showed that CNVs play pivotal roles in the progression and prognosis of breast cancer patients [15].
Therefore, our main goal was to evaluate whether CNV-level information can be used to develop new breast cancer biomarkers. As a test study, we analyzed the MammaPrint™ gene signature. The well-known, 70-gene MammaPrint™ assay was developed as a prognostic tool for predicting the recurrence of breast cancer [16] and measures the mRNA expression of 70 genes to classify patients as having a lower risk or higher risk of metastasis. According to a previous study, the biological functions of all 70 MammaPrint™ genes are associated with the six hallmarks of cancer [1]. In this study, we evaluated CNV-level information of the MammaPrint™ genes in 59 breast cancer cell lines available from the Cancer Cell Line Encyclopedia database (CCLE) [17] and 650 breast cancer patients available in The Cancer Genome Atlas (TCGA) database [3]. We also analyzed the association of CNVs with different clinical features of breast cancer patients.
METHODS
Study design
The overall study design is presented in Supplementary Figure 1 (available online). Complete genomic and functional information was available for 62 genes of the 70 MammaPrint™ (Agilent, Santa Clara, USA) genes.
For data analysis of 59 breast cancer cell lines, we downloaded logR values generated by the CCLE database (https://portals.broadinstitute.org/ccle). Because the study was CNV-based, we selected stringent criteria to minimize the false-positive rate (i.e., logR values ≥1 were considered as amplifications, while logR values ≤-0.7 were considered as deletions). Additionally, CNV values of breast cancer data for 773 patients was downloaded from TCGA database [3]. The platform used in the cell line and TCGA studies was the Affymetrix SNP 6.0 array (Santa Clara, USA). Clinical information of TCGA dataset was available for only 650 patients, and thus we excluded an additional 123 tumor samples. Clinical information included age, ethnicity, ER status, HER2 status, PR status, TNM staging, recurrence, and overall survival (Table 1).
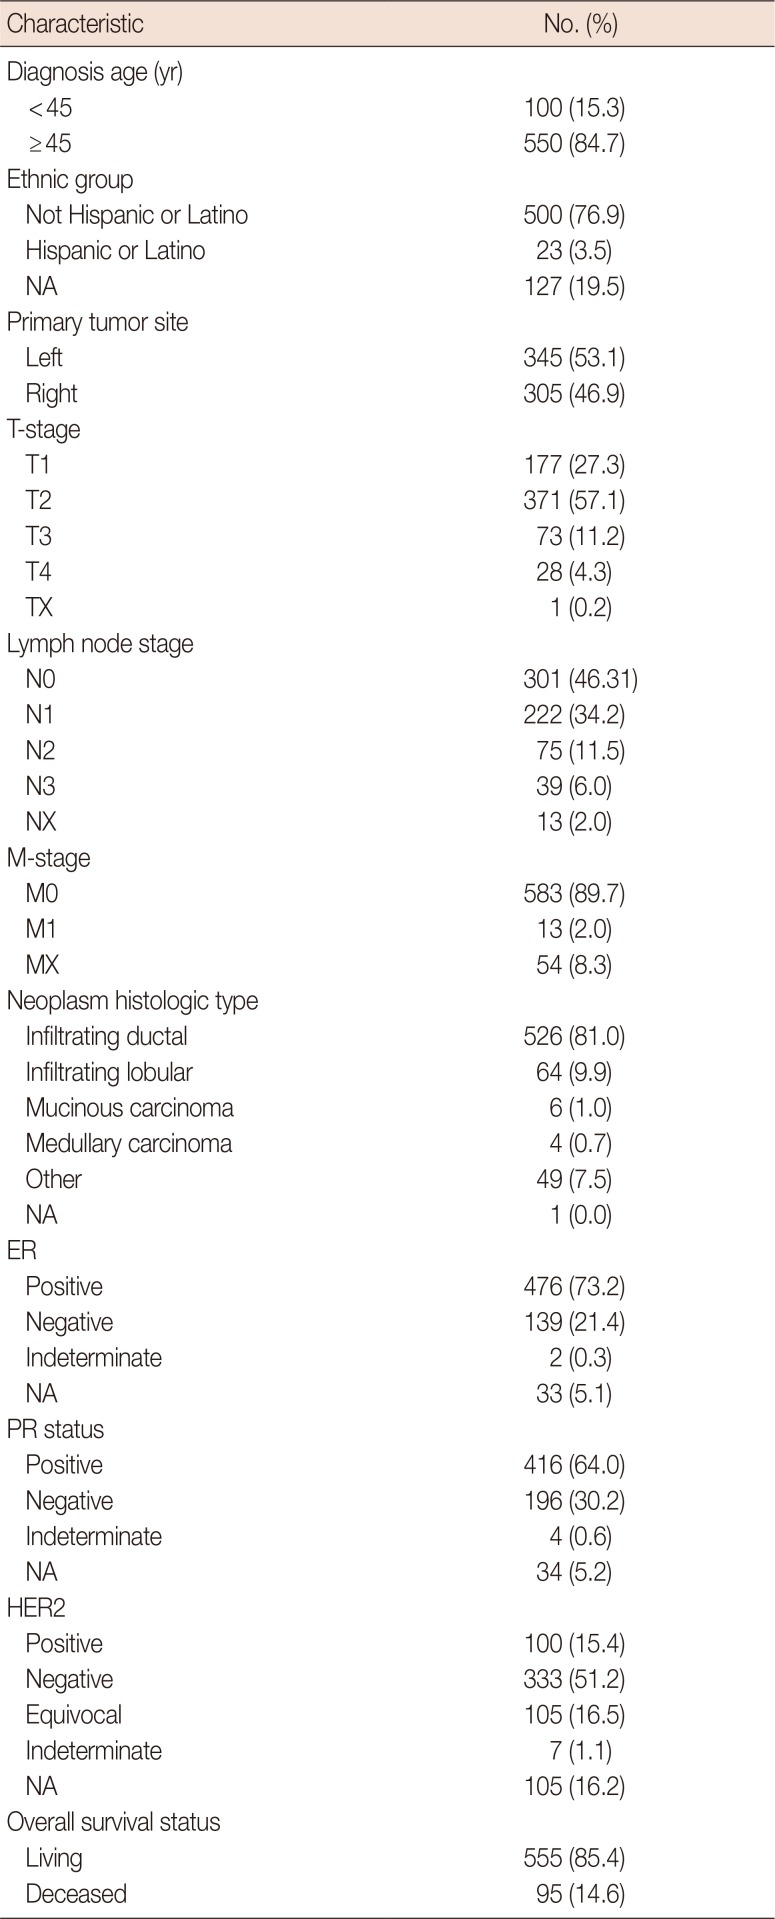
Table 1
Clinicopathological characteristics of 650 breast cancer patients
![]()
Statistical analysis
All statistical tests were performed using SPSS version 20.0 (IBM Corp., Armonk, USA), including Fisher exact test, chi-square test, and Kaplan-Meier overall survival and disease-free survival analyses. p-values were two-sided and p<0.05 was considered statistically significant.
RESULTS
Copy number variations of MammaPrint™ genes in 59 breast cancer cell lines
By cell line data analysis, numerous recurrent amplifications and deletions were observed (Supplementary Figure 2, available online). Genes present in the 1q31.2-1q42.2, 3q26.31-3q29, 5p13.1-5p15.33, 8q22.1-8q24.22, 17q25.1, and 20q13.12 chromosomal regions showed amplifications in >5% of breast cancer cell lines. In addition, genes present in the 1p13.3-1p36.13, 4p16.2, 6p25.2, 6q24.1, 11p15.5-11p15.4, 11q12.2, 12p13.31, 13q12.2-13q34, 16q11.2-16q23.2, 17p13.3, 17q12-17q21.31, 18p11.32, and 20p13 chromosomal regions showed deletions in >5% of breast cancer cell lines (Supplementary Figure 2, available online). The most recurrently amplified gene was EXT1, which was present in the 8q24 region, with amplification in 23% of cell lines. The most commonly deleted gene was DIAPH3, which was present in the 13q21 region, with deletions in 20% of cell lines (Supplementary Figure 2, available online).
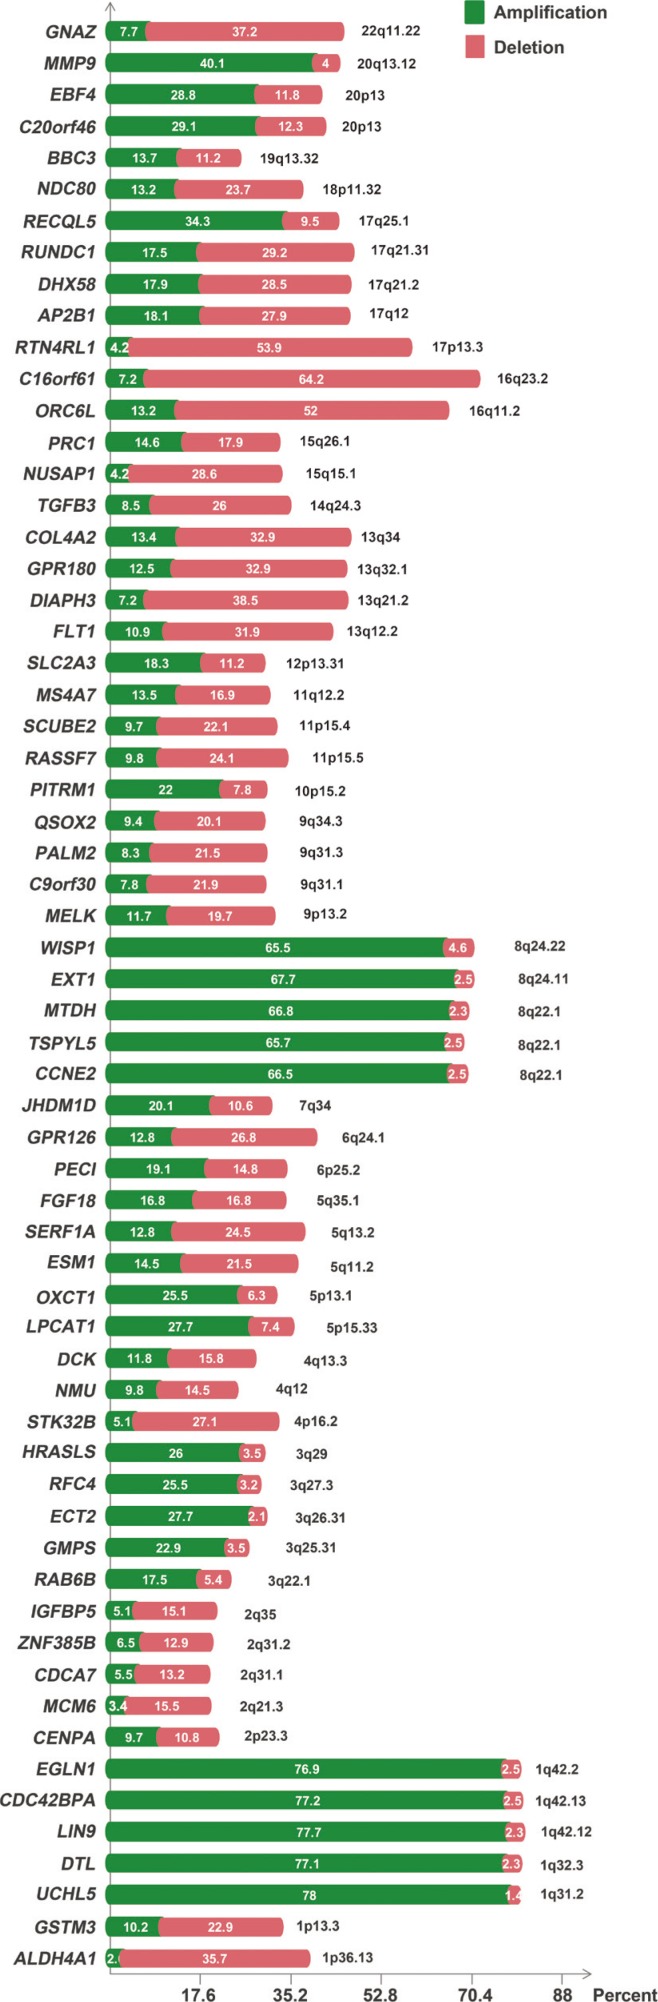
Copy number variations of MammaPrint™ genes in 650 breast cancer patients
Interestingly, compared to cell line data, tumor data showed significant differences in the frequencies of amplifications and deletions (Figure 1). According to the results of TCGA data, genes present in the 1q31.2-1q42.2, 3q22.1-3q29, 5p13.1-5p15.33, 6p25.2, 7q34, 8q22.1-8q24.22, 10p15.2, 12p13.31, 17q25.1, 19q13.32, 20p13, and 20q13.12 chromosomal regions showed recurrent amplifications (Figure 1). In addition, genes present in the 1p13.3-1p36.13, 2p23.3, 2q21.3-2q35, 4p16.2, 4q12-4q13.3, 5q11.2-5q13.2, 6q24.1, 9p13.2, 9q31.1-9q34.3, 11p15.5-11p15.4, 11q12.2, 13q12.2-13q34, 14q24.3, 15q15.1-15q26.1, 16q11.2-16q23.2, 17p13.3, 17q12-17q21.31, 18p11.32, and 22q11.22 chromosomal regions showed recurrent deletions. The 8q region containing WISP1, EXT1, MTDH, TSPYL5, and CCNE2 was the most recurrently amplified region, while the 16q region containing C16orf61 and ORC6L was the most recurrently deleted region. DIAPH3 showed the highest number of deletions in the cell line data and a significant number of deletions (38.5%) in TCGA data.
Genetic alterations of MammaPrint™ genes and clinicopathological features
Next, the association of CNVs of MammaPrint™ genes was evaluated against multiple clinical and pathological factors, including age, hormone receptors, tumor stages, recurrence, and survival. The median age of the 650 breast cancer patients was 59 years (range, 26–90 years) and all patients were female. Of the 650 patients, 476 (73.2%) were ER positive, 139 (21.4%) were ER negative, 100 (15.4%) were HER2 positive, 333 (51.2%) were HER2 negative, 416 (64.0%) were PR positive, and 196 were PR negative (30.2%). A total of 583 (89.7%) had M0 stage breast cancer and 13 (2.0%) had M1 stage breast cancer. In addition, 177 patients (27.3%) had T1 stage, 371 (57.1%) had T2 stage, 73 (11.2%) had T3 stage, and 28 (4.3%) had T4 stage. Five hundred patients (76.9%) were not of Hispanic or Latino origin, while 23 (3.5%) were of Hispanic or Latino origin. According to survival data, 555 patients (85.4%) were alive and 95 (14.6%) were dead at the time of the last follow-up (Table 1).
According to the analysis, PR positive status and ER positive status were associated with 32 and 36 MammaPrint™ genes, respectively (Table 2). Deletions in 20 genes were associated with PR positive and amplification of 12 genes were associated with PR positive status. Similarly, deletion of 25 genes showed an association with ER positive and amplification of 11 genes showed an association with ER positive status. No gene was associated with HER2 positive status. In addition, PR negative, ER negative, and HER2 negative statuses were associated with only four, two, and three genes, respectively (Table 2).
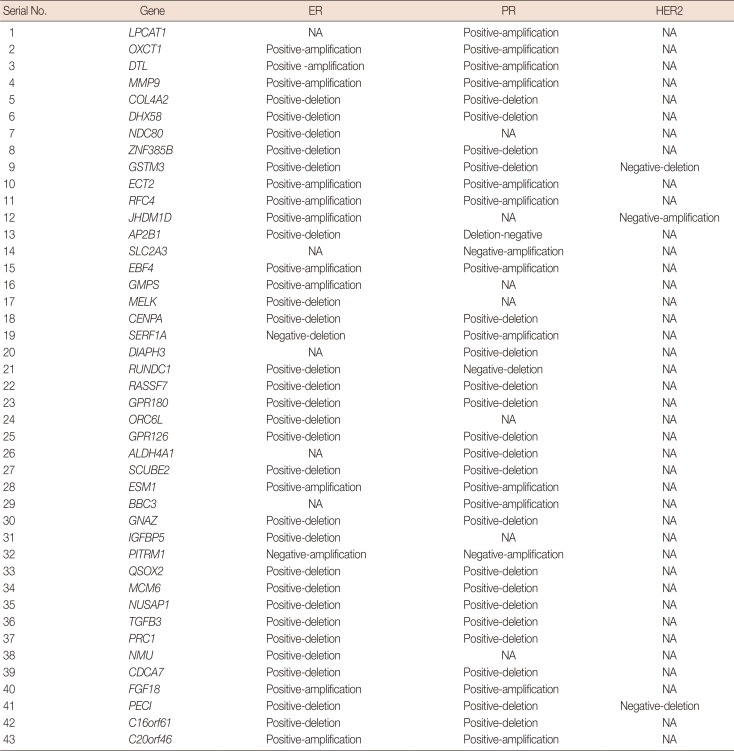
Table 2
Association of copy number variations with biomarkers
![]()
According to TNM staging results, deletions in ZNF385B (p=0.011), CDCA7 (p=0.002), CENPA (p=0.035), COL4A2 (p=0.006), GPR180 (p=0.013), and DIAPH3 (p=0.041) were associated with T2 stage, and deletions in CDCA7 (p=0.009) and COL4A2 (p=0.043) were associated with N1 stage. In addition, a deletion in NDC80 was associated with the M0 stage of breast cancer (p=0.027) (Supplementary Figure 3, available online). According to the tumor primary site, deletions in FLT1 (p=0.019) and amplifications in LPCAT1 (p=0.034), PITRM1 (p=0.023), C20orf46 (p=0.042), and MMP9 (p=0.003) were associated with the left tumor site of breast cancer (Supplementary Figure 3, available online).
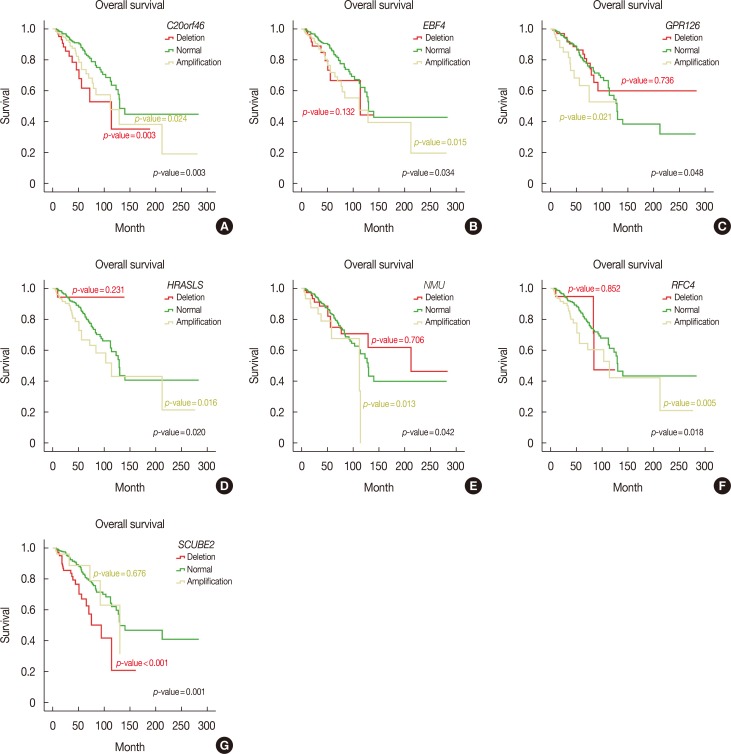
Overall survival and disease-free survival
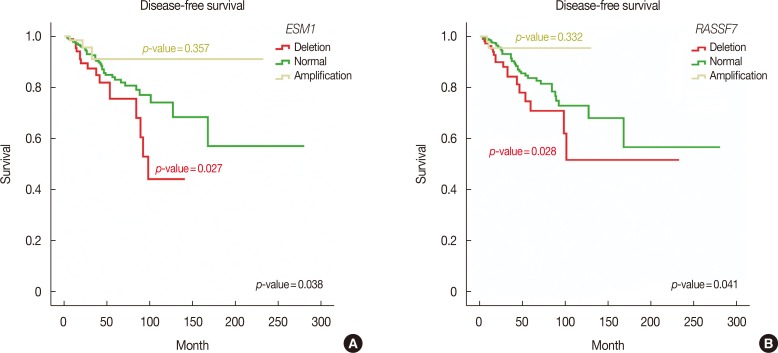
Furthermore, we performed Kaplan-Meier survival analysis of all MammaPrint™ genes to calculate overall and disease-free survival. Interestingly, amplifications in RFC4, HRASLS, NMU, EBF4, and GPR126 genes indicated poor overall survival, with Mantel-Cox p-values of 0.018, 0.020, 0.042, and 0.048, respectively. Deletion of SCUBE2, C20orf46, and EBF4 was associated with poor survival, with Mantel-Cox p-values of 0.001, 0.003, and 0.034, respectively (Figure 2). In addition, deletions in RASSF7 and ESM1 were associated with poor disease-free survival of breast cancer patients, with Mantel-Cox p-values of 0.041 and 0.038, respectively (Figure 3).
These analyses revealed that the CNV profiles of all MammaPrint™ genes contained recurrent amplifications and deletions. In addition, MammaPrint™ genes were associated with hormone receptor status, recurrence, and survival of breast cancer patients.
DISCUSSION
To understand breast cancer tumor heterogeneity, routinely used clinical and pathological markers are gradually being replaced with genetic assays. Based on these genomic tests, consensus regarding the classification of breast cancer subtypes, prognosis, and therapeutic strategies were also rationalized at the 14th St Gallen International Breast Cancer Conference [1819]. The Breast Cancer IndexSM, MammaPrint™, and Oncotype DX® kits were developed to predict breast cancer patient prognosis. The MammaPrint™ is the only Food and Drug Administration approved kit used to assess chances of disease recurrence [1]. Based on differential expressional profiling of 70 genes, prospective estimation of relapse, chemotherapy response, and optional treatment plans may also be devised. A probable concordance of genomic rearrangements (amplification/deletion) for these 70 genes with their clinicopathological features was assessed. CNVs have emerged as major contributors to cancer progression [19].
According to high-throughput sequencing data of recent cancer genomes, CNVs are associated with many clinicopathological factors [20]. However, no CNV-related gene signatures have been identified in cancer. The major reason for this is that copy number segments are independent of gene length (ranging from a few kilobases to several megabases). Therefore, it is very challenging to identify driver genes among the many genes in a CNV segment [21]. Thus, we selected a set of genes shown to be associated with the prognosis of breast cancer at the RNA level and evaluated their association between their CNV information and different clinicopathological factors.
CNV analysis of these MammaPrint™ genes suggested that copy number information can be used to develop new cancerrelated gene signatures. Interestingly, in TCGA dataset, all genes showed recurrent genetic alterations (at least 10% amplifications/deletions). The most recurrently amplified genes were present in the 8q and 1q regions, while the most recurrently deleted genes were present in the 16q and 17p regions (Figure 1). Notably, more than 50% of genes were found to be associated with ER positive and PR positive status, but not a single gene was associated with HER2 positive status.
Kaplan-Meier analysis revealed numerous genes associated with reduced survival and recurrence of breast cancer. For instance, EBF4 and HRASLS were associated with reduced overall survival. Previously, involvement of EBF4 and HRASLS in oncogenic transformation and self-sufficiency for primary tumor proliferation was established [2223]. Data related to molecular cross-talk involving EBF4 remains limited. However, based on sequence homology (90%–95%) with the EBF family, an influence on cell differentiation during embryogenesis was reported [24]. RFC4 overexpression with advanced tumor stage and grade and poor prognosis was also established in colorectal cancer patients. As a multimeric protein, RFC4 is responsible for loading the clamp during DNA replication and cell proliferation. Increased CNV values of RCF4 indicate its dysregulated expression in breast cancer patients [25]. Similarly, in human dermal microvascular endothelial cells, conditional GPR126 expression mediates angiogenesis via VEGF2 activation [26]. Interestingly, GPR126 upregulation was also reported in acute myeloid leukemia-affected patients suffering from variable mixed-lineage leukemia translocation, indicating its subtyping-specific tumorigenic role [27]. Furthermore, these results are consistent with our finding that inactivation of SCUBE2 is associated with poor prognosis of breast and colorectal carcinoma [28].
Similarly, deletion of ESM1 with early recurrence has also been observed in prostate cancer [29]. RASSFF contains the conserved motif RalGDS/AF6 Ras association domain and is responsible for the suppression of guanosine-5´-triphosphate-Ras-induced cell proliferation [30]. Thus, the deletion observed in the given cohort supports the notion of disease recurrence.
Based on these findings, a concordance in CNV based genomic rearrangement with expression profiling of these genes and their putative roles in disease tumorigenesis was established. Therefore, the CNV profiles of RNA expression gene signatures can reveal cancer driver chromosomal regions at the DNA level. This approach will ultimately lead to the development of different therapeutic strategies against these cancer driver regions.
 XML Download