

 PDF
PDF ePub
ePub Citation
 Print
Print


INTRODUCTION
Breast cancer is a serious disease among women and has become increasingly prevalent worldwide [1]. Triple-negative breast neoplasm (TNBN) account for 15% to 20% of breast cancers, and is intractable to treatment owing to its poor prognosis and high recurrence rate [23]. Over the years, a great deal of effort has been expended to enhance the efficacy of TNBN treatments using the angiogenesis inhibitors bevacizumab and paclitaxel; however, this remains only in the developmental stage [4]. Therefore, it is very important to better understand the physiology of TNBN. There are many methods available to identify and understand the physiology of cancers from the gene viewpoint, such as differentially expressed gene (DEG) analysis, and gene clustering and classification. However, these methods have limitations in identifying gene-gene interactions and connections. In addition, gene clustering and classification do not detect important genes in formed clusters.
Given these limitations, we attempted to construct a TNBN gene regulatory network using gene expression data. Previously, de Matos Simoes and Emmert-Streib [5] proved the utility of gene expression data for constructing a gene regulatory network of breast cancer via the BC3Net method, and found significant pathways enriched for the cell cycle and immune response [6]. However, in contrast to their method, we used conditional independence graphs with least absolute shrinkage and selection operator (LASSO) regression to exclude falsely detected gene regulatory networks. By doing this, we created a more precise network to identify gene-gene interactions and hub genes. In addition, we used triple-positive breast neoplasm (TPBN) gene expression data to compare with the TNBN gene regulatory network data, although TPBN is not a definitive entity of breast cancer.
METHODS
We retrieved RNA-Seq expression data for breast cancer from The Cancer Genome Atlas (TCGA) [7]. By definition, in terms of immunohistochemistry, TNBN is negative for the estrogen receptor (ER), progesterone receptor (PR), and human epidermal growth factor receptor 2 (HER2), whereas TPBN is positive for all three receptors [7].
Data characteristics
Of the 1,088 patients with breast cancer logged in TCGA, 115 (10.6%) had TNBN and 97 (8.9%) had TPBN (Table 1). The mean age of the patients with TNBN was 54.73 years (range, 42.94–66.52 years), being statistically significantly lower than that of the patients with TPBN, which was 59.98 years (range, 45.88–74.08 years) (p=0.004, Student t-test). Of the combined TNBN and TPBN groups, 190 patients were alive and 22 patients were deceased at the time of study. The proportions of pathologic tumor stages were similar in both groups, with stage II being the most frequent followed by stages III and I. Most patients did not receive neoadjuvant chemotherapy, but they also did not have a surgical margin status. Differences in neoadjuvant chemotherapy and surgical margin status were not statistically significant between the two groups (p>0.05, generalized Fisher exact test). RNA-Seq V2 expression levels (log2-transformed and normalized RNASeq by expectation–maximization values) were retrieved from the TCGA portal.
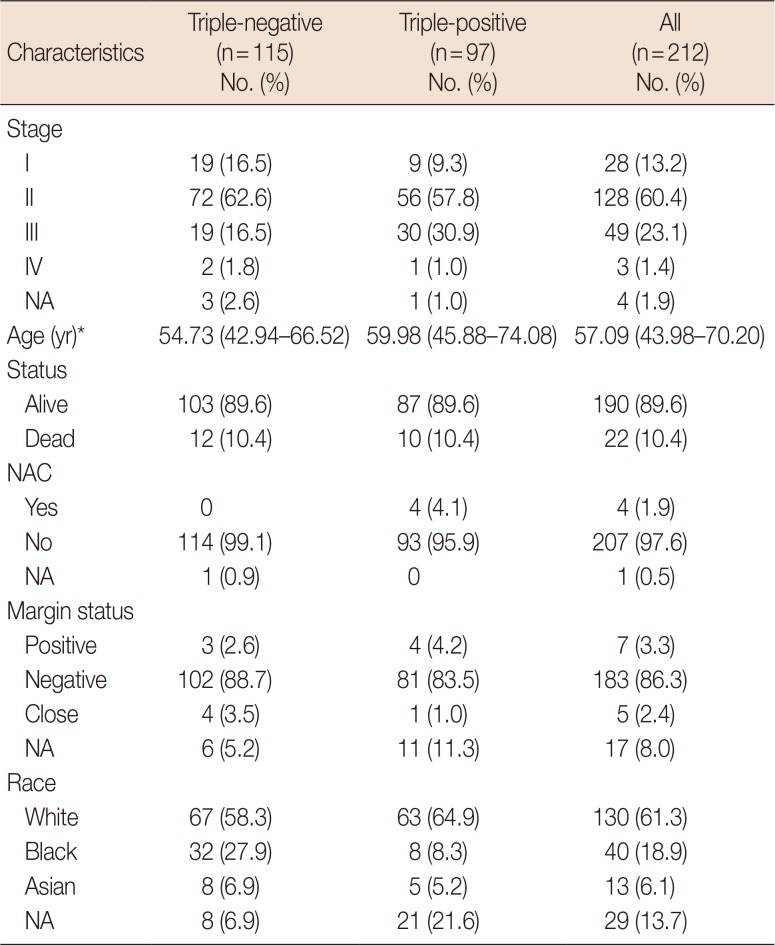
Table 1
Demographics of the triple-positive and triple-negative breast neoplasm patients
![]()
Statistical analyses
The statistical analyses involved a two-stage analytical scheme: (1) regression-based network inference and (2) post hoc analysis. In the first stage, we estimated probabilistic neighbors (typically called a conditional independence graph) on the basis of gene expression in the triple-positive and triple-negative patients, respectively. We used LASSO regression to estimate the probabilistic neighbors, applying the optimal penalty parameter to control the probability of including falsely estimated neighbors [89]. The LASSO-based approach estimates a network by finding probabilistic neighbors around each node, and is computationally efficient and requires only a small amount of memory in computing systems. Thus, this approach is very applicable to such high-dimensional data. The estimated neighbors indicate functional interactions between genes. After that, we calculated the degree of each gene (called the hub gene) and the number of neighboring genes around the hub genes. Subsequently, we sorted the hub genes by degree from large to small, and performed a post hoc analysis to understand their biological functions. In the second stage, both univariate and multivariate Cox proportional hazard models were used to assess survival rates related to hubgene expression. The age, pathologic tumor stage, and ER, PR, and HER2 status were used as covariates to adjust the univariate factor in the survival model. In addition, DEGs between TNBN and TPBN were selected by performing empirical Bayes moderated t-statistics on the log2-transformed RNA-Seq data, with cutoff thresholds of Bonferroni corrected p-values of <0.05 and log fold changes of >|1|, using the Bioconductor ‘limma’ R-package (http://bioconductor.org/packages/release/bioc/html/limma.html) [1011]. For the network statistical analyses, NodeXL version 1.0.1.361 (The Social Media Research Foundation, Belmont, USA) was used.
RESULTS
In the TNBN gene regulatory network, a total of 10,237 vertices and 17,773 edges were observed. The graph density was 0.0003, the maximum vertex-to-vertex distance was 28, and the average vertex-to-vertex distance was 8.6, which means that if one were to go through eight vertices, all would be connected. Statistical results for the TPBN gene regulatory network were similar (Table 2).
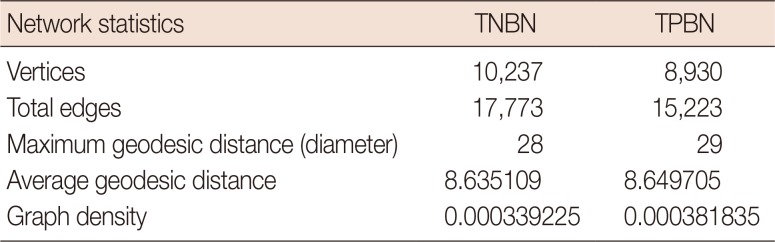
Table 2
Gene regulatory network statistics of triple-negative and triple-positive breast neoplasms
![]()
In the network centrality analysis, the TNBN gene regulatory network revealed the genes RAPGEF6, GTF2A1, and ASXL2 to have the highest hub vertex degree with 38 edges (Tables 3, 4, 5). In addition, we conducted a hub vertex analysis with the betweenness centrality and eigenvector centrality. ZDHHC20 had the highest value (2593718.407) for the betweenness centrality, whereas ASXL2 had the highest value (0.019) for the eigenvector centrality.
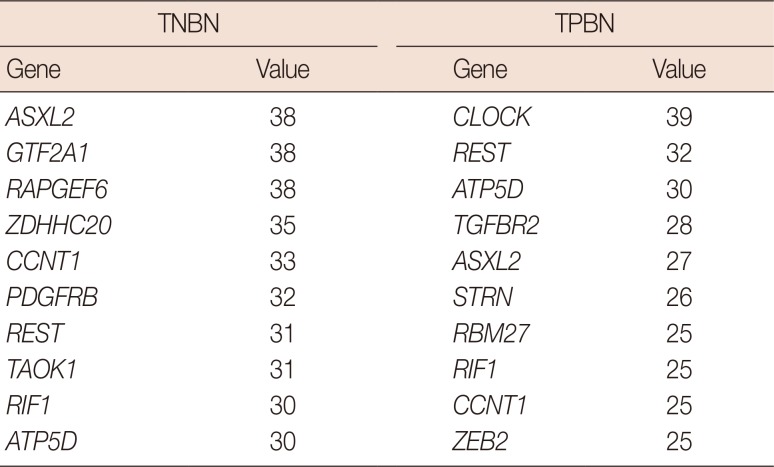
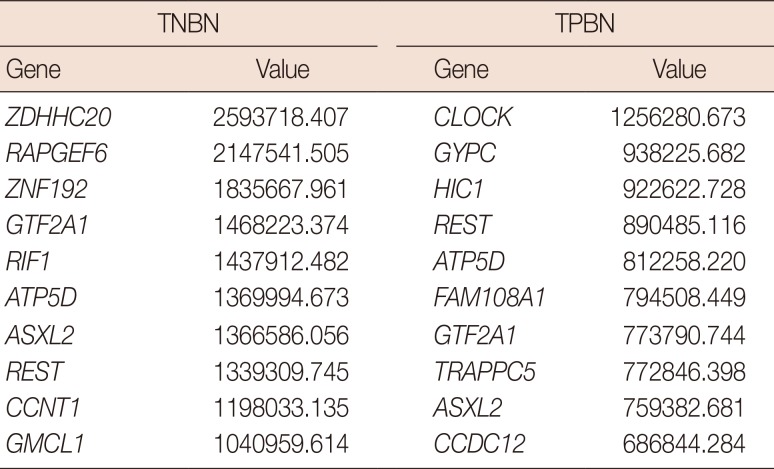
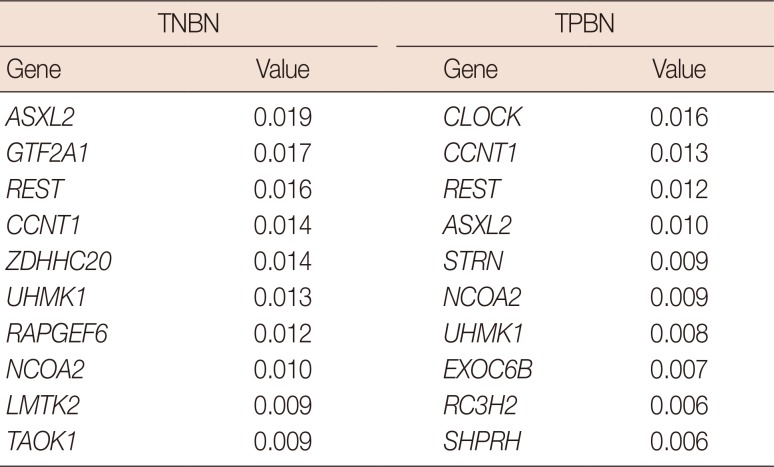
Table 3
Degree centrality results for triple-negative and triple-positive breast neoplasms
![]()
Table 4
Betweenness centrality results for triple-negative and triple-positive breast neoplasms
![]()
Table 5
Eigenvector centrality results for triple-negative and triple-positive breast neoplasms
![]()
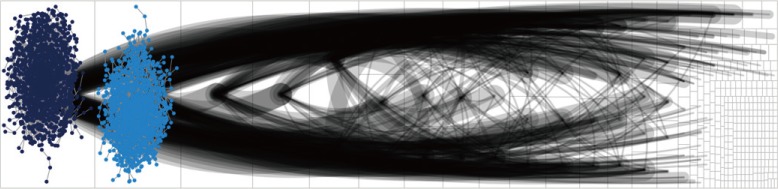
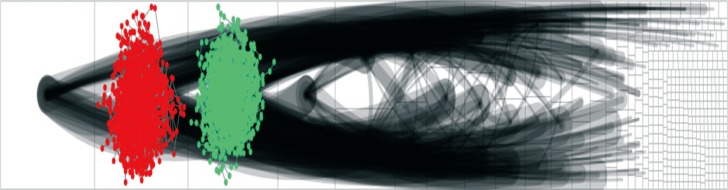
For the network clustering analysis, we used the Clauset-Newman-Moore algorithm to divide the network into groups. In the TNBN gene regulatory network, there were 352 groups showing a modularity value of 0.825, and the largest group contained 1,241 vertices and 2,421 edges. On the other hand, there were 456 groups showing a modularity value of 0.820 in the TPBN gene regulatory network, with the largest group containing 1,153 vertices and 2,377 edges. In the TNBN gene regulatory network, the largest and second largest groups were connected most frequently (Figure 1), whereas the second and third largest groups were connected most frequently in the TPBN gene regulatory network (Figure 2).
It is known that gene regulatory networks in nature generally satisfy the power law. The distributions of vertex degrees were expected to follow the power law precisely, as defined by P(k) ~ k–r, where r is an exponential factor. Using log-transformed values, we performed a regression analysis on the observed vertex degree and density values of the two gene regulatory networks (Figure 3, Supplementary Table 1, available online). The slopes in Supplementary Table 1 are the estimated -r values. We noted that the results adequately satisfied the power-law distribution.
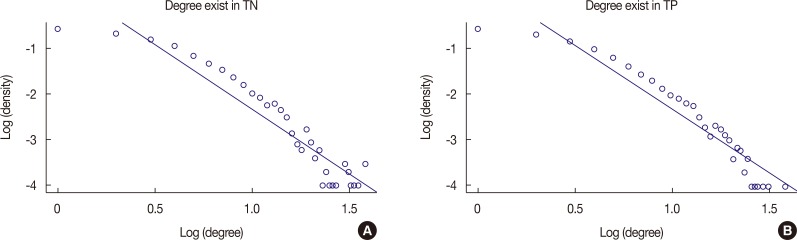
Figure 3
Regression analysis of the observed vertex degree and density values. (A) Regression analysis of degree exist in TN has slope -2.823, adjusted R2 0.882, and p<0.001 which satisfy the power-law distribution. (B) Regression analysis of degree exist in TP has slope -2.727, adjusted R2 0.897, and p<0.001 which satisfy the power-law distribution.
Degree exist in TN=triple-negative breast neoplasm group; Degree exist in TP=triple-positive breast neoplasm group.
![]()
In addition, to confirm the subtype-specific clinical relevance, the subset of patients was selected by the status of ER, PR, and HER2 for analysis by Cox proportional hazard regression. Survival analyses were performed on three genes (CLOCK, RAPGEF6, and ZDHHC20), and the hazard ratio and p-value are shown in Supplementary Table 2 (available online). The analysis on the three genes revealed that the HER2-negative, ER-positive, and PR-positive groups had meaningful hazard ratios in both univariate and multivariate analyses. In the multivariate survival analysis, the survival rate tended to decrease with a higher expression of CLOCK, ZDHHC20, and RAPGEF6, with hazard ratios of 1.76, 1.54, and 1.51, respectively (Table 6).
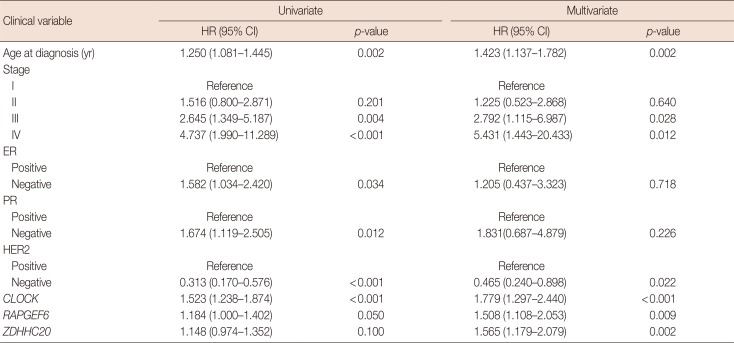
Table 6
Cox regression based on clinical variables and hub genes
![]()
DISCUSSION
In network analysis, the most important feature is the hub vertex distribution. The TNBN and TPBN gene regulatory networks both showed a scale-free characteristic. This means that, unlike a random network, the TNBN gene regulatory network could be easily destroyed if the hub vertices were attacked. Among the TNBN gene regulatory network hub vertices, the most interesting genes were RAPGEF6 and ZDHHC20. Because these genes are cancer related, they were consistently observed in TNBNs only in the centrality analysis. Draper and Smith [12] have reported that ZDHHC20 was associated with cellular transformation and cell proliferation, but to the best of our knowledge, its relationship to breast cancer has thus far not been fully elucidated. In this situation, ZDHHC20 may be a targetable hub vertex in TNBNs. In addition, RAPGEF6 is known to convert GDP into GTP in the Ras-related proteins Rap1 and Rap2, which are cell-junction related proteins [13]. Activated Rap1 interacts with JamA, Bag3, Afadin, Riam, and RapL to regulate cadherin and integrin, which are connected to the cell junction and extracellular matrix [14]. Thus, if we want to identify changes in cell-to-cell interactions in TNBNs, it is essential to study RAPGEF6.
CLOCK was at the top of all three centrality analyses of TPBN. Interestingly, in TNBNs, CLOCK had 5 degrees, with an eigenvector and betweenness centrality values of 0.003 and 215085.373, respectively. These results show that even though TNBN may not be affected by hormonal dysregulation, its oncogenic property may affect its genesis. The result that higher expression of CLOCK, ZDHHC20 and RAPGEG6 related to lower survival rate also support the importance of the CLOCK, ZDHHC20, and RAPGEF6 genes in each network group. In addition, the ASXL2, CCNT1, and NCOA2 genes were also frequently observed in the centrality analysis in both groups. These genes are well-known in tumorigenesis [151617]. Thus, by conducting a thorough network analysis, we can find not only well-known genes but also genes that are not as well known in cancers. In fact, in the DEG analysis, except for RAPGEF6, we could find no other genes showing a meaningful p-value (Bonferroni) between the two groups (Supplementary Table 3, available online). In addition, we compared these genes using 100 normal and 1,084 cancer samples. The genes CCNT1 and ASXL2 showed a p-value of less than 0.001 (Bonferroni), whereas the other genes showed a p-value of 1. Therefore, the DEG analysis using cancer and normal samples suggests that the important genes found from the network analysis cannot be found in the DEG analysis (Supplementary Table 4, available online).
Through network analysis, we have attempted to understand the physiology of TNBNs. The TNBN and TPBN gene regulatory networks showed similar network statistics, with both having similar network densities, diameters, average vertex-to-vertex distance values, and scale-free network characteristics. However, the TNBN gene regulatory network was less clustered than the TPBN gene regulatory network, albeit showing a similar modularity. In addition, the hub vertices were different in both groups. Although we could not conduct specific analyses on each cluster in the TNBN gene regulatory network, we were able to find some oncogenes through the centrality analyses.
 XML Download