

 PDF
PDF ePub
ePub Citation
 Print
Print


INTRODUCTION
The Singaporean population is a multiethnic mixture of 74% Chinese, 13% Malays, and 9% Indians. This admixture of races resulted from the integration of descendants of Chinese and Indian migrants from South China and the Indian subcontinent into the indigenous population of Malays. As well as the indigenous Malays, the Malays diaspora was also due to immigration from the neighboring Malay Peninsula, Java, Sumatra, and the Celebes [1]. Despite the disparate origins of these races, breast cancer is the most common cancer among women in Singapore, regardless of race.
The Singapore Cancer Registry reported 9,283 breast cancers diagnosed from 2010 to 2014, with an average age-standardized incidence rate of 64.7. However, this differs markedly between ethnic groups, at 66.0, 60.4, and 58.8 for Chinese, Malays, and Indians, respectively. Furthermore, in spite of a universal healthcare system affording equal access to all women, the 5-year age-standardized observed survival also differs for Chinese, Malay, and Indian women at 82.8, 69.7, and 77.8, respectively [2]. Malays also have the lowest 5-year observed survival [3]. A separate study using a Singapore-Malaysia hospital-based breast cancer registry found that Malay women presented at a younger age, with larger tumors, at later disease stages, and with more unfavorable histology subtypes. After correcting for these factors, all-cause mortality in Malay women was still higher than that of their Chinese counterparts.
This incidence of invasive ductal carcinoma (IDC) and ductal carcinoma in situ (DCIS) is increasing year on year; this is partly attributable to more early stage cancers detected through the national breast cancer screening program. Screening can result in lead and length time biases, and differences in screening uptake between ethnic groups may account for these observed differences between ethnic groups [45]. In this study, we examined the impact of screening and race on breast cancer outcomes.
METHODS
Nonidentifiable records of patients treated with curative intent at the National Cancer Center Singapore between May 1976 and June 2014 were obtained from an institutional database after obtaining approval from the Institutional Review Board (approval number: 2013/353/B). IDC and DCIS data were analyzed separately.
Subjects were analyzed for differences in demographics (age, breastfeeding history, family history, and menopausal status), breast cancer stage, histopathological features, mode of presentation, and survival outcomes between the ethnic groups. Survival outcomes were then compared separately for clinically and screen-detected cancers.
Overall survival (OS) was defined as the time from diagnosis to death from any cause, disease-free survival (DFS) was defined as the time from diagnosis to cancer recurrence at any site, including contralateral recurrence, and cancer-specific survival (CSS) was defined as the time from diagnosis to death from breast cancer.
Endocrine-responsive tumors defined as both estrogen receptor (ER) and progesterone receptor (PR)-positive, as recorded on pathological reports. Incompletely responsive tumors were defined as either ER-positive or PR-positive. Endocrine nonresponsive tumors are defined as neither ER-positive nor PR-positive. Human epidermal growth factor receptor 2 (HER2) positive tumors were defined as those with a score of 3+ on immunohistochemical stains, or those that tested positive for the receptor using fluorescence in situ hybridization (FISH). HER2 negative tumors were either FISH-negative or only scored 1+ with immunohistochemical stains. HER2 equivocal tumors had a staining score of 2+ but were not subject to FISH analysis.
SAS® version 9.4 (SAS Institute Inc., Cary, USA) was used for the analysis. The chi-square test (or Fisher exact test if expected frequencies were less than 5) was used to test for associations between ethnic groups and patient characteristics. A two-sided p-value of <0.05 was considered significant. Pairwise comparisons were performed when the omnibus test was significant, with Sidak's adjustment applied to account for multiple testing. The Kruskal-Wallis test was used to compare differences in location for continuous characteristics. The Mann-Whitney U-test was performed when the omnibus test was significant. The Cochran-Mantel-Haenszel (CMH) test was used to test the hypothesis of conditional independence between race and treatment choice (breast conservation therapy vs. mastectomy) in relation to disease stage (TNM stage).
The Kaplan-Meier method was used to estimate survival functions and probabilities, with the log-rank test used to assess differences in survival curves. The Cox proportional hazards model was used to model the association between survival endpoints and patient characteristics, with the resulting hazard ratios (HRs) assessed using the Wald test. The Akaike information criterion (AIC) was used to evaluate the multivariable models (models with and without race included) in terms of their fit.
RESULTS
The total study population was 7,211, comprising 6,180 patients with IDC and 1,031 patients with DCIS. The median follow-up time for the cohort was 50.0 months (interquartile range, 20.0–94.0 months). The results of IDC and DCIS will be presented separately.
Invasive ductal carcinoma
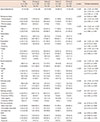
The demographic, tumor, clinical characteristics, and treatment of the study population with IDC are summarized in Table 1.
About 75% of the patient cohort was of Chinese race, while Malay and Indian subjects made up 11% and 5% of the cohort, respectively. The remaining 7% consisted of other minority races and non-Singaporean nationals.
The median age at diagnosis was the lowest for Malay women at 49 years (range, 19–85 years) compared with 51 years (range, 20–93 years) and 52 years (range, 28–81 years) for Chinese and Indian women, respectively (p<0.001). More Malay women were premenopausal at diagnosis than Chinese and Indian subjects (p<0.001). Chinese patients were less likely to have breastfed than Malay and Indian women (p<0.001). There was no difference in the proportion of subjects with a family history of breast cancer (p=0.188). Significantly more Chinese and Indian patients presented for a screening mammogram than Malay patients (p<0.001).
Malay women were more likely to present with advanced stage disease. They had the highest proportion of T3 and T4 tumors at 14.2% (p<0.001), while the proportions in Chinese and Indian women did not differ at 8.7% and 9.6%, respectively (pairwise p=0.162). Malay women (58.3%) also had the highest proportion of node-positive disease compared with Chinese (46.4%) and Indian subjects (54.9%) (p<0.001).
Malay women were more likely to have biologically aggressive disease. They also had the highest proportion of grade 3 tumors (61.8%), compared with Chinese (45.8%, pairwise p<0.001) and Indian women (52%, pairwise p=0.083). A greater proportion of Chinese patients had luminal A/B breast cancers than Malay women and Indian (p<0.001); the difference between Chinese and Indian subjects was not significant (pairwise p=0.151). Moreover, Chinese were more likely to have endocrine-sensitive tumors than Malays (pairwise p=0.001) and Indians (pairwise p=0.182). Malays (30.7%) had the highest HER2 positivity rate compared with Chinese (23.9%) and Indian subjects (20.6%) (p=0.006).
There was no significant association between race and type of surgery (mastectomy or breast conservation) once disease stage was taken into consideration (CMH p=0.403).
Malay patients were more likely to receive systemic treatment. Of all Malay patients, 72.2% received chemotherapy compared to 55.8% of Chinese and 61.5% of Indian patients (p<0.001). Among Malay subjects, 16.7% received targeted therapy, compared with 10.5% of Chinese (pairwise p<0.001) and 10.9% of Indian subjects (pairwise p=0.083).
Survival outcomes for IDC subjects
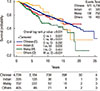
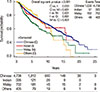
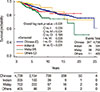
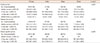
There was a significant difference between ethnic groups for all three survival endpoints analyzed, which were OS, DFS, and CSS (p<0.001). Malay women had the lowest 5- and 10-year rates across all analyses compared with Chinese and Indian women (Table 2, Figures 1,2,3).
Multivariable models for OS, DFS, and CSS were evaluated with and without the race variable. The difference in AIC between models with and without race ranged from 5 to 6, suggesting that there is considerably less empirical support for a model with race excluded.
Using a multivariate model incorporating race, age at diagnosis, T stage, number of positive nodes, hormone sensitivity, and differentiation, race remained an independent significant factor for OS (p=0.002), DFS (p=0.011), and CSS (p=0.008).
The HR for OS was significantly higher at 1.44 (95% confidence interval [CI], 1.16–1.79) for Malay women than that for Chinese women, assuming similar profiles in terms of age at diagnosis, T stage, number of positive nodes, hormone sensitivity, and differentiation. The HR of OS for Indian subjects was 1.01 (95% CI, 0.73–1.39), which was not significantly different from that for Chinese women. Likewise, when compared with Chinese women, the HR for CSS was 1.49 (95% CI, 1.15–1.95) for Malay women and 1.06 (95% CI, 0.71–1.58) for Indian women. Compared with Chinese subjects, the HR for DFS in Malay subjects was 1.17 (95% CI, 0.97–1.42) and 0.80 (95% CI, 0.59–1.09) for Indian subjects (Table 3).
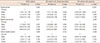
Patients who had screen-detected cancers had better OS, DFS, and CSS than those with clinically detected disease. The 10-year OS was 89.8% (95% CI, 86.5–93.1) compared with 74.8% (95% CI, 72.4–77.2), the DFS was 74.2% (95% CI, 68.3–80.2) compared with 59.6% (95% CI, 56.8–62.3), and the CSS was 94.4% (95% CI, 91.9–96.9) compared with 84.9% (95% CI, 82.9–86.9). Screen-detected cancers had a median primary invasive tumor size of 1.50 cm (0.00–17.00) while in clinically detected cancers this was 2.50 cm (0.00–25.00) (p<0.001), and the median numbers of positive nodes were 0 and 1, respectively (p<0.001). Screen-detected cancers also tended to be of lower grades (p<0.001). Of clinically detected cancers, 22.6% were endocrine nonresponsive, compared with 16.1% (p<0.001) of screen-detected tumors. More clinically detected cancers were HER2 positive at 21.8% versus 14.6% of screen-detected cancers (p<0.001) (Table 4).
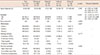
To attempt to remove the effect of screening, multivariable models for survival outcomes were conducted separately for IDC patients who presented clinically and with screening mammograms (Table 3).
For OS, race was significant in both clinically and screen-detected cancer models with p-values of 0.012 and <0.001, respectively. Compared with Chinese subjects, the OS HR for Malay subjects was 1.44 (95% CI, 1.10–1.90) for clinically detected and 5.78 (95% CI, 2.64–12.64) for screen-detected disease. Compared with Chinese women, the HRs for Indian women for all endpoints were not significantly different.
For DFS, among the subjects with clinically detected disease, Malay (HR, 1.10; 95% CI, 0.86–1.39) and Indian women (HR, 0.77; 95% CI, 0.52–1.14) were not statistically different from that of Chinese women. Among subjects with screen-detected disease, the HR for Malay subjects was 2.18 (95% CI, 1.19–3.99) and for Indian subjects it was 2.07 (95% CI, 1.06–4.03), compared with Chinese subjects.
For CSS, among subjects with clinically detected disease, the HR for Malay subjects was 1.53 (95% CI, 1.09–2.14) and for Indian subjects it was 1.55 (95% CI, 0.97–2.46), compared with Chinese subjects. Among subjects with screen-detected disease, the HR for Malay women was 5.93 (95% CI, 2.15–16.39) and for Indian women it was 1.87 (95% CI, 0.51–6.86).
Ductal carcinoma in situ
The demographic, tumor, and clinical characteristics of the study population with DCIS are summarized in Table 5. The median age at diagnosis was lowest for Malay women at 47 years (range, 21–69 years), compared with Chinese women at 50 years (range, 20–86 years) and Indian women at 52 years (range, 38–70 years) (p=0.048, although no pairwise comparisons were statistically significant). There were no statistically significant differences in the size of DCIS, grade of differentiation, histology subtypes, or hormone sensitivity among the ethnic groups.
DISCUSSION
The ethnic Malays were the original inhabitants of the Malay Peninsular and the adjacent Indonesian archipelago; they are culturally and genetically distinct from the later Chinese and Indian immigrants in contemporaneous history. This retrospective study of breast cancer patients at the national cancer center is representative of the multiethnic population of Singapore. It suggests that Malay patients may have distinct differences in the natural history of breast cancer and may respond differently to standard breast cancer treatment. Not only do Malay women present with histologically more aggressive disease and at a more advanced stage, they also have a higher risk of breast cancer-related deaths and all-cause mortality (CSS: HR, 1.49; 95% CI, 1.15–1.95; OS: HR, 1.44; 95% CI, 1.16–1.79). Our study is the first to stratify patients according to mode of presentation in order to minimize the effects of lead and length time biases associated with screening. Nevertheless, even among screen-detected cancers, Malay breast cancer patients had poorer disease control and survival than ethnic Chinese and Indian patients in this study.
Malay patients in our study population have a preponderance of well-known poor prognostic factors. Compared with Chinese patients, Malay patients more often present with node-positive disease and larger primary tumors. They are also more likely to have grade 3 and HER2-enriched tumors, and are less likely to have hormone-sensitive and luminal A/B type disease. Malay patients with IDC presented at the youngest median age, and more were premenopausal at diagnosis.
As expected, more Malays received systemic treatment with chemotherapy and trastuzumab because of their higher risk of disease; however, this standard treatment was insufficient to mitigate the risks of breast cancer recurrence and deaths. Similar to the Singapore cancer registry findings [1], Malay subjects had the worst survival outcomes. The OS, DFS, and CSS differences become even more marked at 10 years post diagnosis, as breast cancer can be indolent and have a long natural history. After accounting for risk factors, including age, disease stage, and histology subtype, race remained independently significant for survival outcomes.
Among patients with invasive breast cancer that presented clinically, we observed that Malay women have poorer OS, although there was no significant difference in DFS. DFS includes both local and distant recurrences, the latter having a higher risk of mortality and a greater influence on OS. Closer examination of the data (results not shown) suggests that the higher proportion of distant metastasis (66.5%) among disease recurrence events in Malay women than in Chinese women (63.7%) may affect the OS. This may also have affected the higher distant failure rates in Malay subjects than in their Chinese counterparts (HR, 1.38; 95% CI, 1.11–1.72).
In studies performed in neighboring Malaysia, with whom Singapore shares close geopolitical and historical ties, as well as a similar multiethnic population, it has been similarly shown that Malay women had the lowest breast cancer survival among the three major ethnic groups [36789]. Another study that included Borneo natives among more than 1,000 women in Sarawak found that HER2-positive cases were more frequent in Malay women than in Chinese women and native female inhabitants; furthermore, native female inhabitants and Malay women had a higher incidence of triple-negative breast cancer than Chinese women [9]. As well as unfavorable histology and poorer survival, a local prospective survey of 1,000 women found that Malay race was a significant independent predictor of poor breast cancer knowledge, and this led to lower breast self-examination and screening mammogram uptake rates [10].
The differences in breast cancer natural history between ethnic groups may be explained not just by genetics, but perhaps also by cultural differences in diet, lifestyle, and health-seeking behavior. However, despite increased breastfeeding and parity rates, which are known protective factors, Malay women are still at higher risk for all endpoints examined [1112].
In this study, greater proportions of Chinese and Indian women presented with screen-detected breast cancers than Malay women, supporting a similar observation in an earlier study on breast cancer knowledge by Sim et al. [10]. It may be postulated that Malay women had more advanced disease at presentation and hence, poorer outcomes as a direct result of lower breast cancer screening uptake and delays in seeking help; such behavior may have compounded the risks conferred by inherent genetic factors. Indeed, we found that screened tumors were smaller and had fewer nodal metastases, as well as being more indolent in terms of grade, endocrine-receptor positivity, and HER2 negativity. This may be the result of length and lead time biases that have been associated with mammography breast cancer screening [4]. Furthermore, screen-detected cancers have about half of the risks of clinically apparent tumors, with HRs of 0.43, 0.30, and 0.48 for OS, CSS, and DFS, respectively. Hence, analyses were performed separately for subjects who presented with and without screening mammograms.
Even after stratification, we found that compared with Chinese women, Malay women were at a higher risk of all-cause and breast cancer-specific deaths in both the clinical and screen-detected arms. Notably, the difference in HR between Malay and Chinese women was even greater among those with screen-detected cancers. This unexpected observation belies the fact that screen-detected cancers are more indolent [5]. It is not clear whether this observation is driven by an extreme indolence of screen-detected breast cancers in Chinese women, by an enhanced aggressiveness of breast cancers in Malay women even when the disease is screen-detected, or for other reasons. This requires further investigation.
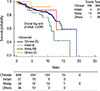
In contrast to invasive cancers, we found that the natural history of DCIS between the ethnic groups in Singapore is consistently less diverse. Other than being diagnosed at a younger age, DCIS cases in Malay women are similar with respect to tumor size, grades, histology subtypes, and hormone sensitivity. For DCIS, Malay women presented at the youngest age, which is similar to our findings in IDC subjects. However, pairwise comparisons are not possible because of the small number of Malay women with DCIS (59 patients). As DCIS is not known to increase mortality, only the endpoint of DFS was examined. DFS at 5- and 10-years is lowest for Malays, although the p-value was not significant. This could be because of the small patient number; only 14 out of 59 Malay subjects developed recurrence. It may also be the case that no differences in DCIS size, histology subtypes, and DFS were found because DCIS is heterogeneous with varying malignant potential [13].
This study is limited by the nature of the database, which captures only women who presented with non-metastatic disease and who were treated radically with curative intent. However, inclusion of patients with metastatic disease would likely enhance the observed differences. The median follow-up period is relatively short at 4 years, which may exaggerate the effects of early failures from biologically aggressive disease; these failures occur at a higher rate in Malay women. We assumed that the differences in outcomes were not due to the non-uniform receipt of cancer treatment, which may arise from differences in cultures, practices, and beliefs between the different ethnic groups.
We have shown that the Malay race is a significant prognostic factor for breast cancer control and breast cancer-specific deaths. Further studies should be conducted to elucidate the genetic and cultural influences on this outcome so that public education, screening, treatment, and surveillance measures may be implemented with consideration of race.
In conclusion, Malay race is a poor prognostic factor in both clinical and screen-detected IDC of the breast. Special attention should be given to the detection and follow-up of breast cancer in this ethnic group.


 XML Download