

 PDF
PDF ePub
ePub Citation
 Print
Print


INTRODUCTION
Breast cancer is the second leading cause of malignancy among women worldwide, with an estimated 1.67 million new cases and 522,000 deaths in 2012 [1]. As a result of improvements in early detection and treatment, the mortality rate of breast cancer has continued to decline over the last two decades in many countries worldwide. However, the 5-year relative survival rate for metastatic breast cancer remains relatively low [2]. On the molecular level, breast cancer encompasses a heterogeneous group of diseases with distinct clinical differences in prognosis and response to therapy [34]. Estrogen receptor (ER), progesterone receptor, and human epidermal growth factor receptor 2 (HER2) statuses are widely used as biomarkers to aid in treatment selection and prediction of prognosis in patients with breast cancer. For example, the use of HER2 as a predictive biomarker has been successful in the treatment of HER2-enriched tumors with trastuzumab [5]. Despite the remarkable clinical response achieved with the use of biomarkers such as HER2, there is still a critical need for better prognostic and therapeutic biomarkers for efficient treatment of breast cancer. Recently, gene signatures such as the 70-gene signature [6], wound-response gene signature [7], and 21-gene recurrence score [8] have been developed to predict patient outcomes. These multiple-gene-based signatures potentially increase prediction accuracy, but the disadvantages include the high cost of testing and lack of specific targets for chemotherapeutic agents.
UCK2, located on chromosome 1q22-23.2, was initially identified as human testis-specific gene TSA903. It encodes uridine-cytidine kinase (UCK) 2, which is a rate-limiting enzyme involved in the salvage pathway of pyrimidine-nucleotide biosynthesis. UCK2 catalyzes the phosphorylation of uridine and cytidine to form uridine monophosphate (UMP) and cytidine monophosphate (CMP) with efficiency 15- to 20-fold higher than that of ubiquitously expressed isozyme UCK1 [9]. It also catalyzes the phosphorylation of several cytotoxic ribonucleoside analogs that have been investigated for possible use as chemotherapeutic agents for cancer treatment [10]. In addition, UCK2 may be important for the pharmacological activation of uridine and cytidine base analogs, such as the clinically used analog 5-fluorouracil (5-FU). The level of UCK2 activity may be associated with cellular sensitivity to the nucleoside analogs, as loss of UCK2 activity has been observed in cells resistant to the nucleoside analogs [9]. Interestingly, several previous studies have suggested that UCK2 activity is increased in cancer cells compared with normal tissue [1112].
In the current study, we performed expression profiling analyses of UCK2 in breast cancer using publicly available databases and microarray datasets. We found that UCK2 expression was correlated with clinical parameters in patients with breast cancer, and its prognostic value was superior to TNM staging and comparable to multiple gene signatures.
METHODS
Differential expression of UCK2 gene in breast cancer tissues
We first searched the Oncomine database (http://www.oncomine.org; accessed on October 6th, 2015) using key words gene: “UCK2,” cancer type: “breast cancer” and analysis type: “cancer vs. normal” to assess whether UCK2 expression was altered in breast cancer tissue. The search returned a total of 80 comparisons in 15 breast cancer studies. Details regarding tissue collection and the experimental protocol of each study can be found in the Oncomine database or the original publications. Additionally, one microarray dataset (E-TABM-276) [13] was downloaded from the ArrayExpress database (http://www.ebi.ac.uk/arrayexpress) to further examine UCK2 expression in malignant breast tumor tissue, adjacent tissue exhibiting nonproliferative change, adjacent normal tissue, and breast tissue from healthy controls undergoing reduction mammoplasties.
Associations of UCK2 gene expression with clinical outcome of patients with breast cancer
To investigate the associations of UCK2 expression with histological grades, molecular subtypes, and clinical outcomes of patients with breast cancer, we then searched the GOBO database (Gene Expression-based Outcome for Breast Cancer Online; http://co.bmc.lu.se/gobo; accessed on October 9, 2015), which included microarray profiling data from 1,881 patients with breast cancer [14]. To further evaluate the prognostic and predictive value of UCK2 expression in breast cancer, 10 microarray datasets containing survival information of patients with breast cancer, including GSE1456 [15], GSE2034 [16], GSE4922 [17], GSE7390 [18], NKI [19], GSE10885 [20], GSE22226 [21], GSE24450 [22], GSE25066 [23], GSE53031 [24], and GSE58812 [25], were downloaded from the Gene Expression Omnibus. Detailed information regarding the microarray datasets used in the survival analysis is summarized in Supplementary Table 1 (available online).
Gene set enrichment analysis
To evaluate the correlations between UCK2 expression and cancer-related pathways, gene set enrichment analysis (GSEA) was performed using the above mentioned breast cancer microarray data sets. The detailed protocol for GSEA is available on the Broad Institute Gene Set Enrichment Analysis website (http://www.broad.mit.edu/gsea). Briefly, GSEA is a computational method that determines whether a priori defined set of genes shows statistically significant, concordant differences between two biological states [26]. Data sets and phenotype label files were created and loaded into GSEA software (v2.0.13; Broad Institute, Cambridge, USA). The gene sets were downloaded from the Broad Institute website. The phenotype label was UCK2-high versus UCK2-low. The number of permutations was set to 1000. A ranked-list metric was generated by calculating the signal-to-noise ratio, which is based on the difference of means scaled according to the standard deviation.
Statistical analyses
All statistical analyses were performed using SAS statistical software, version 9.2 (SAS Institute Inc., Cary, USA), unless otherwise noted. Student t-test and one-way analysis of variance were used for continuous data analyses, and Pearson chisquare test was used for categorical data analyses. UCK2 expression levels were stratified into four categories (Q1, Q2, Q3, and Q4) based on the quartile distribution in the individual studies, with the lowest quartile as the reference group (Q1). The overall survival (OS) period was calculated as the time from initial surgery to the date when the patient was last seen. The disease-free survival (DFS) period was defined as the time from initial surgery until tumor recurrence, including local relapse and metastatic progression. Kaplan-Meier survival analysis was used to plot the proportions of the population that were alive (OS) or cancer-free (DFS) by the length of follow-up. Hazard ratios (HR) with 95% confidence intervals (CI) were calculated using multivariable Cox proportional hazards regression models to examine the association of UCK2 expression levels with patient survival. Two-sided p-values less than 0.05 were considered statistically significant.
RESULTS
Higher UCK2 gene expression in breast cancer tissues relative to controls
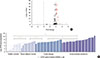
To explore whether UCK2 mRNA expression was altered in breast cancer tissues, we searched the Oncomine database using key words gene: “UCK2,” cancer type: “breast cancer,” and analysis type: “cancer vs. normal analysis.” The search returned a total of 80 array comparisons in 15 breast cancer studies. As shown in Figure 1A, UCK2 was frequently upregulated in breast cancer tissue compared with breast tissue from healthy controls. When filtered by p<10−5 and fold change >|2|, seven probe comparisons in three studies demonstrated significantly higher UCK2 expression in breast cancer tissue relative to controls. Moreover, in the study of E-TABM-276, the median expression level of UCK2 in invasive breast cancer tissue was higher compared to that in tissue exhibiting cystic changes (p=0.003), adjacent normal tissue (p<0.001), or breast tissue from healthy controls (p<0.001). Likewise, UCK2 expression in tumor-adjacent nonproliferative tissue was higher than that in adjacent normal tissue (p=0.009) or in breast tissue from healthy controls (p<0.001). Interestingly, tumor-adjacent normal tissue also expressed significantly higher levels of UCK2 than breast tissue drawn from healthy controls (p=0.008) (Figure 1B).
Association of UCK2 gene expression with clinical and pathological characteristics of patients with breast cancer
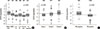
To further assess whether UCK2 expression was associated with tumor stage, molecular subtype, and clinical outcome, we searched the GOBO database, which contained expression profiling data of 1,881 patients with breast cancer. As shown in Figure 2A, the search revealed that UCK2 was differentially expressed between breast cancer subtypes, with the highest level in basal-like tumors and the lowest in normal-like tumors (p<0.001). Higher UCK2 expression levels were associated with ER-negative status (p<0.001) and more advanced tumor grade (trend p<0.001) (Figure 2B, C).
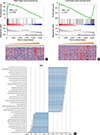
GSEA was performed to determine the associations between UCK2 expression and cancer-related pathways. Subjects were sorted according to the expression level of UCK2 from low to high, and the microarray data was loaded into GSEA software. Figure 3A and B are examples showing that UCK2 expression levels were inversely associated with breast cancer prognosis. Genes co-expressed with UCK2 were enriched in biological pathways associated with tumor grade, molecular subtype, cancer invasiveness, metastasis, and prognosis (Figure 3C). These findings suggest that overexpression of UCK2 might be associated with tumor aggressiveness and poor outcome in patients with breast cancer.
Prognostic significance of UCK2 gene in patients with breast cancer
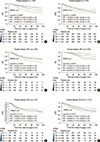
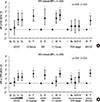
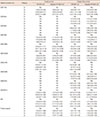
We further analyzed the prognostic value of UCK2 in 10 publicly accessible microarray datasets with survival information of patients with breast cancer, using Kaplan-Meier curves and multivariable Cox proportional hazards regression models. As shown in Table 1, higher UCK2 levels were correlated with poorer OS. Pooled analysis of the 10 microarray datasets revealed that, compared with those in the lowest quartile of UCK2 expression, the adjusted HRs for those in the second, the third, and the highest quartile of UCK2 expression were 1.56 (95% CI, 0.96–2.57), 1.67 (95% CI, 1.05–2.72), and 1.79 (95% CI, 1.12–2.96), respectively. Similar trends were observed for DFS, with borderline statistical significance. Stratification analyses also showed that UCK2 expression was associated with OS and DFS in patients with both ER-positive and ER-negative breast cancer (Figure 4). To further evaluate the prognostic value of UCK2, we compared its performance with that of TNM stages and multiple gene-based prognostic signatures, respectively. For ER-positive breast cancer, our analyses indicated that the prognostic value of UCK2 expression was superior to that of TNM staging and comparable to that of the 70-gene signature, the wound-response signature, and the 21-gene recurrence score in the NKI set (Figure 5).
DISCUSSION
Although high expression of UCK2 has been observed only in human placenta and testis, previous studies have also shown altered UCK2 expression in most human cancer cell lines [27]. However, no study has yet investigated the role of UCK2 in breast cancer. In the current study, we demonstrated that UCK2 is frequently upregulated in breast cancer tissue relative to controls. Compared with breast tissue drawn from healthy controls, the expression level of UCK2 was significantly increased in tumor-adjacent normal tissue, tissue exhibiting nonproliferative changes, and invasive breast cancer tissue. Moreover, the expression levels of UCK2 differed between breast cancer subtypes, with the highest levels observed in basal-like tumors and the lowest in normal-like tumors. High UCK2 levels also correlated with ER-negative status, advanced tumor grade, and poor differentiation, as well as short survival time in patients with breast cancer. These data indicate that UCK2 is implicated in breast cancer progression and prognosis, and suggest that it may operate as a potential oncogene. However, additional analyses of atypical proliferative lesions or ductal carcinoma in situ are warranted to further support this hypothesis.
While detailed mechanisms of the function of UCK2 in breast cancer remain incompletely understood, pharmacological studies have demonstrated that UCK2 is responsible for the phosphorylation and activation of 5-FU, an agent widely used in the therapy of solid tumors, including breast, colorectal, and head and neck cancers. Muhale et al. [28] showed that UCK2, along with other genes involved in the 5-FU anabolic pathway, produced a phenotype of cell sensitivity to 5-FU following knockdown. Our stratified analysis using the NKI dataset showed that among patients with stage II breast cancer, chemotherapy significantly improved DFS (p=0.008) and OS (p=0.050) in patients with UCK2-low expression, but not in those with UCK2-high expression (p=0.107 for OS and p=0.243 for DFS, respectively), a finding that might be attributed to the sample size of the study. However, our analysis showed that chemotherapy significantly improved survival in patients with UCK2-low expression, a result inconsistent with previous findings that activity of UCK2 was required for chemosensitivity. Possible explanations for these results include: (1) chemotherapeutic agents such as 5-FU are not commonly used for treatment of breast cancers; (2) one of the major roles of UCK2 is converting uridine and cytidine into UMP and CMP, which are critical for the integrity of human cells; and (3) the association of UCK2 and chemosensitivity is only observed in the NKI dataset, and requires further validation in additional datasets. The potential mechanisms of UCK2 and drug sensitivity require further investigation.
Currently, prognostic factors such as primary tumor size, histological grade, lymph node stage, and hormone receptor status are routinely used in clinical practice to aid in treatment prediction and management of patients with breast cancer. However, due to the heterogeneity of the disease, there is a critical need for additional prognostic and therapeutic biomarkers for efficient breast cancer treatment. Based on this systematic review and literature search for biomarkers for breast cancer prognosis, we found multiple genes that are being validated for clinical use as prognostic tools. For example, the 70-gene signature, 21-gene recurrence score, core serum response signature, PI3K signature [29], and the grade signature [17] have been used to predict the clinical outcome for patients with ER-positive breast cancer. These multiple gene-based signatures have been shown to improve the accuracy of prediction compared with TNM staging, but have also dramatically increased diagnostic costs. Notably, in the current study we observed that the prognostic performance of UCK2 was superior to that of TNM staging and comparable to that of the above gene signatures for breast cancer, suggesting its potential use as a cost-effective predictive biomarker for breast cancer progression and prognosis.
There are several limitations to this study, but there are also merits. The sample size of the study was relatively large, so the statistical power was superior to that of the majority of single center studies. Because the findings are mainly based on public microarray datasets with genome-wide expression profiling data, the selection bias was reduced to some extent. A major limitation is that the current observed associations were restricted to the mRNA level. We attempted to evaluate the associations of UCK2 protein levels with clinical and pathological characteristics of breast cancer in our tissue array samples using immunohistochemistry assays. However, because the commercialized UCK2 antibody available at this point showed non-specific results, we failed to correlate expression on the protein level with patient outcomes. Moreover, the current study utilized individual-level UCK2 gene expression data from public databases generated by different platforms, and the absolute cutoff value of UCK2 is not universally defined and needs to be established in the future to allow application of UCK2 gene as a possible prognostic marker in daily clinical practice.
In summary, these findings show that UCK2 gene expression levels were associated with breast cancer subtype, tumor stage, and ER status, as well as survival time, in patients with breast cancer, suggesting a critical role of UCK2 gene in breast cancer progression and prognosis. The prognostic performance of UCK2 gene was superior to that of the current pathology stages and comparable to that of the multiple genebased signatures. Additional studies are warranted to further elucidate the exact role of UCK2 in breast cancer.
 XML Download