

 PDF
PDF ePub
ePub Citation
 Print
Print


INTRODUCTION
Epigenetic alterations of histones in chromatin are essential in gene transcription pattern regulation in cells and are mediated by the catalytic activity of histone deacetylases and methyltransferases [1]. Enhancer of zeste homologue 2 (EZH2), which is located on chromosome 7q35, is a member of the catalytic subunit of the polycomb repressive complex 2, which is a highly conserved histone methyltransferase that methylates lysine 27 of histone 3 [2]. EZH2, which has a SET domain, epigenetically regulates chromatin structure and represses target gene transcription by trimethylating histone 3 lysine 27 (H3K27me3). Growing evidence demonstrates that EZH2 is required for tumorigenesis, cancer cell proliferation, progression, metastasis, stem cell maintenance, and drug resistance [3]. EZH2 overexpression has been implicated in various malignancies including prostate, breast, endometrial, bladder, and head and neck squamous cell carcinomas, and this overexpression is associated with poor outcomes [45678]. Recent studies of myeloid malignancies have highlighted that EZH2 acts as a tumor suppressor, suggesting that EZH2 exhibits varied roles in cancer development depending on cancer type [9]. Two EZH2 inhibitors are currently being tested in phase I and II clinical trials in patients with and without EZH2 mutations in their lymphoma [10]. Therefore, it is important to establish a method of determining optimal candidates for EZH2 inhibitor treatment.
Elevated EZH2 levels highly correlate with invasiveness and increased proliferation rates of breast cancers [11]. EZH2 expression progressively increases from normal breast tissue to atypical ductal hyperplasia, ductal carcinoma in situ (DCIS), and invasive ductal carcinoma (IDC), suggesting that EZH2 protein levels increase as breast cancer develops [41112]. Although EZH2 protein overexpression has been correlated with poor prognosis of breast cancer patients, little is known about the role EZH2 plays in breast cancer tumorigenesis [1113]. Herein, we report EZH2 nuclear expression in 432 breast IDC samples by immunohistochemistry (IHC) and correlate findings to clinicopathologic variables, including prognostic significance, and molecular subtype. We also analyzed the relationship between EZH2 protein expression in normal breast tissue and DCIS.
METHODS
Patients
Four hundred thirty-two formalin-fixed and paraffin-embedded surgical breast IDC specimens, 27 DCIS specimens, and 11 matched normal breast tissues obtained from the Soonchunhyang University Hospital from 2001 to 2013 were included in this retrospective study. Every included patient was diagnosed with breast cancer by pathologists based on pathological test results. Hematoxylin and eosin-stained slides were independently reviewed in each case to confirm the original diagnosis by two pathologists (S.H.J. and H.J.L.), based on the 2012 World Health Organization classification [14]. Data regarding patient age at initial diagnosis, tumor size, histological type, histological tumor grade, lymph node status, and surgery type were also collected. Pathologic TNM classification and staging were performed for the 432 cases using the current TNM international staging system (seventh edition of the American Joint Committee on Cancer criteria). Further data, including disease progression, patient survival, and cause of death, were obtained from medical records and/or interviews with patients' families. This study was approved by the Institutional Review Board at the Soonchunhyang University Hospital (SCHCA 2015-06-006).
Tissue microarrays
For tissue microarray (TMA) construction, a sufficient viable tumor sample with no hemorrhage or necrosis was selected for each case. Representative 2-mm diameter core tissue sections were taken from paraffin blocks. They were arranged in new recipient TMA blocks using a manual TMA device (SuperBioChips Laboratories, Seoul, Korea). In cases with variable histological features, the most representative area was selected for TMA construction. In addition, 11 nonneoplastic breast tissues from IDC patients were included.
Immunohistochemistry
EZH2 expression was analyzed by IHC. Four-micrometer sections from the TMA blocks were deparaffinized in xylene and rehydrated with gradually decreasing concentrations of ethanol in distilled water. IHC staining of the TMA samples was performed with a Bond-Max Autostainer (Leica Microsystems, Bannockburn, USA). Primary antibody binding was detected with the Bond Polymer Refine Detection kit (Leica Microsystems), according to the manufacturer's instructions. The primary anti-EZH2 mouse monoclonal antibody (Novocastra, Newcastle Upon Tyne, UK) was used at a dilution of 1:100. Two independent observers (S.H.J. and H.J.L.) read the slides in a blinded manner, and consensus was made by repeated examination when results were discordant. Only epithelial cells were evaluated, and results for each core were recorded separately. At the time of review, neither of these investigators was aware of clinicopathologic data associated with each specimen because all slides had been coded. Nuclear EZH2 expression was scored as negative (score=0, no staining), weak (score=1, <25% of nuclei staining with any intensity), moderate (score=2, 25%–75% of nuclei staining with any intensity), or strong (score=3, >75% of nuclei staining with any intensity) [13]. Tumors with nuclear staining with moderate or strong were classified as having high EZH2 expression, whereas those with completely absent or weak nuclear staining were classified as having no or low EZH2 expression.
Immunohistochemical staining for estrogen receptor (ER; 1:50; Dako Co., Carpinteria, USA), progesterone receptor (PR; 1:50; Dako Co.), human epidermal growth factor receptor 2 (HER2; 1:200; Novocastra Laboratories Ltd., Newcastle, UK), Ki-67 (1:800; Dako Co.), cytokeratin 5/6 (CK5/6; 1:50; Dako Co.), epidermal growth factor receptor (EGFR; 1:100; Dako Co.), and p53 (1:1,200; Dako Co.) was done on 4-µm sections in the TMA blocks. ER and PR immunohistochemical staining was evaluated using the Allred method [15]. An Allred score of 3 or higher was classified as positive. HER2 was analyzed according to the general guidelines set by the American Society of Clinical Oncology/College of American Pathologists. When IHC yielded equivocal results, HER2 status was established with fluorescent in situ hybridization. Ki-67 and p53 expression levels were counted in 1,000 tumor cells, and positivity was defined as ≥14% and >10% staining, respectively. CK5/6 and EGFR expression levels were considered positive when the cytoplasmic and/or membranous reaction was ≥10%. The phenotypes were classified as follows: luminal A: ER- and/or PR-positive, HER2-negative, and Ki-67 index <14%; HER2-negative luminal B: ER- and/or PR-positive, HER2-negative, and Ki-67 index ≥14%; HER2-positive luminal B: ER- and/or PR-positive, HER2-positive, and any Ki-67 index; HER2 type: ER- and PR-negative and HER2-positive; basal triple-negative breast cancer (TNBC): ER-, PR-, and HER2-negative and CK5/6- and/or EGFR-positive; and non-basal TNBC: ER-, PR-, HER2-, CK5/6-, and EGFR-negative.
Statistical analyses
Statistical analyses were performed using the software package SPSS version 19.0, for Windows (IBM Corp., Armonk, USA). Associations between EZH2 expression and the clinicopathologic characteristics were analyzed using Pearson chi-square test, Fisher exact test, or an independent t-test, according to test conditions. Survival rates were plotted using the Kaplan-Meier method and log-rank test. Disease-free survival (DFS) periods were defined as the intervals between primary surgeries and final follow-up visits without disease or evidence of recurrence or metastasis of breast cancers (locoregional relapse and distant metastasis). Overall survival (OS) periods were defined as the intervals between primary surgeries and the last follow-up visits or deaths from any cause. Cox proportional hazard model was used to evaluate the associations between clinicopathological factors and survival rates. Hazard ratio (HR) and associated 95% confidence interval (CI) were calculated for each variable. A p-value <0.05 was considered statistically significant.
RESULTS
Patient characteristics and EZH2 immunoreactivity
This study included 426 women (98.6%) and six men (1.4%). The mean age was 52.4±12.4 years (range, 24–81 years), and the mean tumor size was 2.4±1.4 cm (range, 0.3–12 cm). Of the 432 patients, 222 (51.4%) underwent breast-conserving surgeries, and 210 (48.6%) underwent mastectomies. Of the 432 samples, 54 were grade 1 (12.5%), 213 were grade 2 (49.3%), and 165 were grade 3 (38.2%). Primary tumor size data were available for the 432 patients. From this, 212 (49.1%), 197 (45.6%), 19 (4.4%), and 4 (0.9%) tumors were categorized as pT1, pT2, pT3, and pT4, respectively. Of the 432 patients, 163 patients (37.7%) had lymph node positivity at the time of surgery. The 432 patient tumors were classified using the TNM classification system as stage I (n=154, 35.6%), stage II (n=198, 45.8%), and stage III (n=80, 18.5%). The proportions of patient tumors positive for ER and PR expression were 66.0% and 35.2%, respectively. Upon HER2 expression analysis, 18.1% of all patient tumors were positive. High Ki-67 expression was noted in 45.6% of tumors. Positive CK5/6 and EGFR expression levels were found in 9.3% and 20.6% of tumors, respectively. For p53 expression, 18.5% of patient tumors were positive.
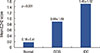
EZH2 protein in IDC was expressed mainly in tumor cell nuclei (Figure 1). We evaluated EZH2 expression in 11, 27, and 432 normal breast tissues, DCIS specimens, and IDC specimens, respectively. EZH2 expression was positive in 0 of 11 (0%) normal breast tissue, 8 of 27 (29.6%) DCIS specimens, and 215 of 432 (49.8%) IDC specimens, in increasing order, and the differences in positivity between groups were statistically significant (p=0.001) (Table 1). The mean EZH2 expression score was 0.18±0.41 in normal breast tissue, 0.89±1.09 in DCIS, and 1.49±1.12 in IDC (Figure 2). EZH2 expression was significantly higher in DCIS and IDC specimens than in normal breast tissue (p<0.001). After evaluation of the 432 immunostained IDC specimens, 109 (25.2%) were negative; 108 (25.0%) were scored 1, indicating weak positivity; 109 (25.2%) were scored 2, indicating moderate positivity; and 106 (24.5%) were scored 3, indicating strong positivity. For statistical analyses, the cases were subdivided into an EZH2-high expression group (scores 2 and 3; n=215, 49.8%) and an EZH2-low expression group (scores 0 and 1; n=217, 50.2%).
Correlations between EZH2 expression and clinicopathologic parameters
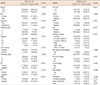
High EZH2 expression significantly correlated with high histologic grade (p<0.001), large tumor size (p=0.014), advanced pathologic stage (p-stage, p=0.006), negative ER expression (p<0.001), positive HER2 expression (p<0.001), high Ki-67 staining index (p<0.001), positive CK5/6 expression (p=0.003), positive EGFR expression (p<0.001), positive p53 expression (p<0.001), endocrine therapy status (p=0.001), and chemotherapy (p=0.032) (Table 2). Other clinicopathologic variables, including age (p=0.700), sex (p=0.448), operation method (p=0.453), lymph node metastasis (p=0.372), negative PR expression (p=0.132), neoadjuvant chemotherapy (p=0.098), and radiotherapy (p=0.488), did not correlate with EZH2 expression.
For molecular subtypes, high EZH2 expression was significantly associated with HER2-negative luminal B (72.2%), HER2-positive luminal B (73.5%), and HER2 type (75.0%) as well as basal TNBC (83.6%) cancers, but high EZH2 was not associated with luminal A cancer (20.7%) or non-basal TNBC (23.3%, p<0.001).
Survival analysis
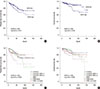
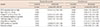
The median follow-up period for all patients was 41.0 months, with a range of 1 to 158 months. At the time of analysis, the numbers of overall deaths and patients with disease progression were 48 and 82, respectively. The 4-year overall survival rates for IDC patients with high or low EZH2 expression were 86.0% and 91.7%, respectively. By univariate analysis, conventional prognostic parameters, including tumor size, lymph node metastasis, and p-stage were significant predictors of DFS and OS (Table 3). In addition, expression levels of ER and HER2 significantly predicted DFS or OS of breast cancer patients. Patients with high EZH2 expression had a significantly worse DFS (p=0.041) and OS (p=0.009) than did patients with low EZH2 expression (Figure 3A, B). Based on molecular subtypes, the DFS (p=0.016), and OS (p=0.032) rates were significantly different (Figure 3C, D). Luminal A patient had the best survival, closely followed by HER2-negative luminal B patients during the first 40 months of follow-up with respect to DFS and OS. Patients with HER2-positive cancer had the poorest prognoses with respect to DFS and OS. All TNBC patients (both basal and non-basal) had intermediate survival times, with deaths occurring earlier than deaths of luminal A patients.
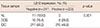
To evaluate EZH2 positivity in IDC as an independent predictor of DFS and OS, multivariate analysis using the Cox proportional hazard model was performed and included age, tumor size, lymph node metastasis, and EZH2 expression. All variables with p<0.05 in univariate analysis were included in the multivariate Cox model. Three variables, age (p=0.002, only for OS), lymph node metastasis (p=0.028, only for DFS), and p-stage (p=0.042 and p=0.021 for DFS and OS, respectively) were significant prognostic factors for IDC patients (Table 3). Multivariate analysis showed no significant association between EZH2 expression and disease progression and overall death (HR, 1.24, 95% CI, 0.78–1.97, p=0.370; and HR, 1.25, 95% CI, 0.66–2.37, p=0.502).
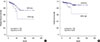
The DFS and OS rates of the EZH2-high and -low expression groups, stratified according to molecular subtype, are shown in Figure 4 and Supplementary Figure 1 (available online). In patients with luminal A disease, high EZH2 expression was significantly associated with shorter OS compared to low EZH2 expression (p=0.045) (Figure 4B). In contrast, DFS was not significantly different between the EZH2-high and -low expression groups (p=0.142) (Figure 4A). In patients with HER2-negative luminal B disease, neither DFS nor OS was significantly different according to EZH2 expression (p=0.386 and p=0.147, respectively) (Supplementary Figure 1A, B). In patients with HER2-positive luminal B disease, neither DFS nor OS was significantly different according to EZH2 expression (p=0.634 and p=0.782, respectively) (Supplementary Figure 1C, D). In patients with HER2-positive disease, neither DFS nor OS was significantly different according to EZH2 expression (p=0.522 and p=0.690, respectively) (Supplementary Figure 1E, F). In patients with basal TNBC, neither DFS nor OS was significantly different according to EZH2 expression (p=0.367 and p=0.535, respectively) (Supplementary Figure 1G, H). In patients with non-basal TNBC, neither DFS nor OS was significantly different according to EZH2 expression (p=0.274 and p=0.374, respectively) (Supplementary Figure 1I, J). Multivariate analysis using the Cox proportional hazard model showed that high EZH2 expression in luminal A cancer was not a significant independent prognostic factor for OS (HR, 2.85; 95% CI, 0.80–10.16; p=0.106).
DISCUSSION
In the present study, we evaluated EZH2 expression in 11, 27, and 432 normal breast tissues, DCIS specimens, and IDC specimens, respectively. EZH2 expression is significantly increased in DCIS and IDC compared with normal breast tissues, suggesting a role for EZH2 in tumorigenesis and progression as a molecular marker [1116]. EZH2 expression in DCIS has been linked to recurrence and progression of invasive breast cancer [12].
We investigated the associations between EZH2 in IDC and various clinicopathologic characteristics, including prognostic significance, by molecular subtype. High EZH2 expression was associated with features of aggressive tumors, such as high histologic grade, large tumor size, advanced p-stage, ER negativity, HER2 positivity, high Ki-67 proliferative index, CK5/6 and EGFR positivity, and positive p53 expression. For molecular subtypes, high EZH2 expression was significantly associated with HER2-negative luminal B, HER2-positive luminal B, and HER2-positive cancers as well as basal TNBC. Furthermore, increased EZH2 expression was significantly associated with poor DFS and OS in univariate analyses. We were also able to demonstrate an association between EZH2 expression and clinical outcomes according to molecular subtype. In patients with luminal A cancer, there was a significant trend toward shorter OS of patients with high EZH2-expressing tumors compared to patients with low EZH2-expressing tumors.
Our findings regarding the association of high EZH2 expression with aggressive breast cancer features are consistent with previous reports. EZH2 overexpression was previously associated with tumor diameter, stage of disease, decreasing age, negative ER status, negative PR status, lymph node status, and poor survival [11]. Another study reported that increased EXH2 expression was associated with poorly differentiated breast carcinomas [17]. A significant association between EZH2 expression and the TNBC phenotype has been described [18].
While previous reports showed no association between high EZH2 expression and HER2 positivity, our study reveals the specific association between high EZH2 expression and HER2 positivity in a cohort of patients with IDC from a single institution [111819]. However, in patients with HER-positive luminal B or HER2-positive diseases, neither DFS nor OS was significantly different according to EZH2 expression. Further investigation may be warranted to reveal a role for EZH2 in HER2-positive breast cancer.
We also demonstrated a significant correlation between high EZH2 expression and positivity for CK5/6 and EGFR, which are markers commonly expressed in highly aggressive and poorly differentiated basal-like breast cancer, which might suggest that EZH2 controls the basal-like breast cancer differentiation state [20]. We also found a significant correlation between high EZH2 expression and both p53 overexpression and high Ki-67 proliferative index. This is consistent with previous experimental findings that suggest roles for p53 and Ki-67 in regulating EZH2 via its promoter [2122].
Recently, Bae et al. [19] reported high EZH2 expression as a prognostic factor for shorter OS for patients with breast cancer, including the ER+ breast cancer subtype. Similarly, we have observed that increased EZH2 expression was associated with poor survival in patients with breast cancer, including the luminal A subtype, as evidenced by univariate analyses.
If EZH2 functions in breast cancer progression, its inherent methyltransferase activity may serve as an attractive therapeutic target. Recent studies have identified synthetic lethality upon use of targeted EZH2 methyltransferase inhibitor therapy in diffuse large B-cell lymphomas and ARID1A-mutated ovarian cancer cells [1023]. Further studies are warranted to examine the effects of these specific EZH2 inhibitors in breast IDC.
The current study has limitations that include its retrospective nature and the small sample size drawn from a single institution, which is prone to selection bias. The limited number of tissues analyzed by immunohistochemical stains on TMA and the loss of some cases either due to loss of tissue cores during processing or due to lack of tumor cells might constitute another limitation. Another shortcoming of this study is the relatively short follow-up period to determine the survival, which made it difficult to study the impact of EZH2 expression on progression and death.
In conclusion, this study indicated that EZH2 is frequently upregulated in breast malignancy, and EZH2 may function importantly in cancer development and progression. Furthermore, EZH2 could a prognostic marker, especially in patients with luminal A disease. The exact role of EZH2 and its potential as a novel therapeutic target for breast cancer should be investigated in future studies.

 XML Download