

 PDF
PDF ePub
ePub Citation
 Print
Print


INTRODUCTION
Approximately 20% to 30% of breast cancers are human epidermal growth factor receptor 2 (HER2) overexpressing or amplifying carcinomas, and these tumors were associated with poor survival before the era of targeted therapy [1]. Incorporation of trastuzumab into systemic chemotherapy has shown improved survival of patients with these aggressive tumors in the metastatic and adjuvant setting [23]. However, certain HER2-positive cancers eventually develop resistance to therapy and large number of recurrent or metastatic tumors are still incurable despite the existence of newly developed HER2-targeted therapies, such as lapatinib, pertuzumab, and trastuzumab emtansine [4].
Evading immune destruction is one of the hallmarks of cancer and immunity related molecules can be targets for anticancer drugs [5]. One mechanism through which trastuzumab exerts its function is antibody-dependent cellular cytotoxicity (ADCC), and therefore, evasion from ADCC has been suggested as a possible resistance mechanism to targeted therapy [67]. It has been reported that anti-HER2 CD4+ Th1 response, CD8+/FOXP3+ tumor infiltrating lymphocyte (TIL) ratio, or tumor-associated lymphocytes can be useful predictors of the pathological response to neoadjuvant chemotherapy [8910]. Data from clinical trials suggested that patients with CD8+ T cells or increased number of TILs might be associated with better survival when trastuzumab was administered [1112]. However, methodological issues concerning the evaluation of TILs have been debated [13]. Recently, an international TILs Working Group published recommendations for the evaluation of TILs in breast cancer; however, a formal recommendation for a clinically relevant TIL threshold has not yet been suggested [14].
This study aimed to explore the expression status and the association between T-lymphocyte markers as well as to investigate the prognostic role of CD4, CD8, and forkhead P3 (FOXP3) expression in HER2-positive breast cancer using a web-based database. Clinically clear cutoff values for T-cell marker expression have not been established and various cutoff levels were included in the web-based analysis. In addition, we compared the immunohistochemical expressions of CD4, CD8, and FOXP3 before and after HER2-targeted therapy in primary or metastatic HER2-positive breast cancer patients to better understand the clinical implications of T-cell markers on the mechanisms of resistance to targeted therapy.
METHODS
Web-based bioinformatics analysis
Genomic analysis was performed for exploring the associations between HER2 and T-lymphocytes markers of CD4, CD8, and FOXP3 through the cBioPortal for Cancer Genomics (http://www.cbioportal.org) which provides web-based visualization, analysis and download of large-scale cancer genomic datasets including The Cancer Genome Atlas (TCGA) data [1516]. We used the Breast Invasive Carcinoma (TCGA, Provisional) dataset, which includes mRNA expression and clinicopathological information of 1,105 samples obtained from 1,098 patients in May 2016. The RNA Seq Version 2 (RNA-Seq by Expectation Maximization [RSEM]) for each gene was selected to generate an OncoPrint in the cBioPortal for visualizing the genetic alteration and to investigate the mutual exclusivity or co-occurrence among alterations in biomarkers of whole analyzed samples. We downloaded the mRNA expression data of CD4, CD8 and FOXP3 and clinical HER2 information data to explore the associations between T-lymphocyte markers in HER2-positive breast cancers. Using variables of immunohistochemistry (IHC)-HER2 and HER2 fluorescence in situ hybridization (FISH) status in the TCGA dataset as variables, IHC-HER2 positive cases, HER2 FISH status positive cases, or IHC-HER2 equivocal cases with HER2 FISH-positivity were considered to have HER2-positive tumors.
The probability of relapse-free survival according to biomarkers was calculated using the Kaplan-Meier plotter database (http://kmplot.com/analysis) [17]. It is an online tool that allows analysis of the effects of 54,675 genes on survival by using 10,188 cancer samples including 4,142 breast cancer patients with a mean follow-up duration of 69 months in May 2016. Survival and gene expression data were derived from the Gene Expression Omnibus (Affymetrix microarray only), European Genome-phenome Atlas, and TCGA. The Affymetrix probe set IDs selected for the evaluation of CD4, CD8, and FOXP3 expressions were 203547_at, 205758_at, and 224211_at, respectively, in the present study. To analyze the prognostic value of a particular gene, the patient samples were split into two groups according to various quantile expressions of the proposed biomarker. Multiple genes were also analyzed through a multigene classifier using the mean expression levels of selected biomarkers. Hazard ratio with 95% confidence interval and log-rank p-value were calculated and displayed on the webpage.
Patient selection
Using tissue blocks previously archived from HER2-positive breast cancer patients who received systemic chemotherapy combined with trastuzumab or tyrosine kinase inhibitors at the Severance Hospital of Yonsei University College of Medicine, Seoul, Republic of Korea, between January 2007 and December 2011, the expressions of CD4, CD8, and FOXP3 on IHC were investigated to compare the T-lymphocytes markers before and after targeted therapy [18]. Briefly, tumor samples before and after HER2-directed therapies were available in most cases; however, five out of 29 patients received targeted therapy in the neoadjuvant setting and achieved pathologic complete response (pCR) after curative surgery. Therefore, tissue blocks after targeted therapy could not be obtained and the five patients with pCR were defined as good responders in the present study. Of 29 patients, 24 eventually experienced disease progression or recurrence despite the administration of targeted therapy and were defined as poor responders in the study. The baseline expression of T-lymphocyte markers between five good and 24 poor responders were compared. Among the 24 poor responders, the T-cell markers of six recurrent or metastatic tumor samples could not be evaluated. Thus, using 18-matched baseline and resistant tumor samples before and after targeted therapy, the expression of T-lymphocyte markers was compared. In total, 47 tissue blocks from 29 patients were analyzed. The present study was approved by the Institutional Review Board of Severance Hospital, Yonsei University Health System, Seoul, Republic of Korea (IRB number: 4-2013-0390). The requirement for written informed consent was waived.
Clinicopathological parameters and immunohistochemical staining
Clinicopathological information including treatment modalities or expression of hormone receptors and HER2 was obtained from the review of medical records and pathology reports. Chemotherapeutic agents of 29 patients were paclitaxel in 14 patients, anthracycline plus cyclophosphamide followed by taxane in 11, anthracycline plus taxane in two, and anthracycline plus cyclophosphamide in one. One patient was treated with cyclophosphamide, methotrexate, and 5-fluorouracil due to intolerability after first administration of anthracycline plus cyclophosphamide. Tumors with ≥1% nuclear-stained cells by IHC were considered positive for estrogen receptor (ER) and progesterone receptor according to the American Society of Clinical Oncology/College of American Pathologists (ASCO/CAP) guidelines [19]. The HER2 stains were scored as 0, 1+, 2+, or 3+ according to ASCO/CAP guidelines [20]. In cases with a HER2 2+ result, FISH was performed using a PathVysion HER2 DNA Probe Kit (Vysis, Downers Grove, USA) and HER2 gene amplification was defined as a HER2 gene/chromosome 17 copy number ratio ≥2.0 according to ASCO/CAP guidelines [20]. HER2 was considered positive in cases with an IHC score of 3+ or gene amplification by FISH.
After reviewing the archival hematoxylin and eosin stained slides, IHC was performed using the whole sections of formalin-fixed, paraffin-embedded tissue blocks. Briefly, 3-µm thick whole sections were deparaffinized and rehydrated in usual manner. Antigen retrieval was performed using an electronic pressure cooker for 10 minutes in Trilogy buffer (Cell Marque Co., Rocklin, USA). After treatment with hydrogen peroxide block solution for 10 minutes, background staining was blocked by incubation in Ultra V Block solution (Thermo Scientific/Lab Vision, Fremont, USA) for 5 minutes at room temperature. After incubation with primary antibodies against CD4 (diluted 1:100, M3352; Spring Bioscience Corp., Pleasanton, USA), CD8 (diluted 1:100, M3162; Spring Bioscience Corp.), and FOXP3 (diluted 1:50, AB20034; Abcam, Cambridge, UK), immunodetection was carried out using the UltraVision LP detection system (Thermo Scientific/Lab Vision) according to the manufacturer's instructions. Color was developed with 3,3′-diaminobenzidine and slides were counterstained with Harris hematoxylin. The primary antibody incubation step was omitted in the negative control.
Interpretation of the immunohistochemical staining was performed blindly to obtain clinical data of the patients. Arbitrary scoring rules of CD4 and CD8 lymphocytes were as follows: 1+, 0% to 33% staining; 2+, 34% to 66% staining; and 3+, 67% to 100% staining. FOXP3 was scored by counting the number of positively stained cells, which was expressed as a percentage of total lymphocytes. The cutoff value for FOXP3 positivity was ≥10% of the stained cells.
Statistical analysis
Web-based bioinformatics statistics was automatically calculated by each website and the results were displayed on the webpage. The downloaded TCGA dataset was analyzed using correlation coefficient to explore the association between T-lymphocyte markers in HER2-positive tumors. Differences between the discrete variables in patients of Severance Hospital were evaluated by using the Fisher exact test. For the comparison of the means in the case of continuous numerical data, an independent two-sample t-test was used. A p-value <0.05 was considered statistically significant. All statistical analyses were performed using SPSS version 23.0 (IBM Corp., Armonk, USA).
RESULTS
We first explored the mRNA expression status using the TCGA Provisional dataset, and information about the biomarker expression was obtained for 1,100 samples from 1,093 patients. Genetic alteration of CD4, CD8, FOXP3, and HER2 including mRNA upregulation and downregulation was noted in 4%, 4%, 4%, and 16% of whole samples, respectively (Supplementary Figure 1, available online). One or more genes were altered in 250 patients (22.7%). There was no mRNA downregulation in T-lymphocyte markers. When the mutual exclusivity and co-occurrence among these four biomarkers was investigated, the HER2 gene showed a tendency towards mutual exclusivity with CD4 (p=0.227; log odds ratio=−0.464), CD8 (p=0.290; log odds ratio=−0.383), and FOXP3 (p=0.328; log odds ratio=−0.302). However, a tendency towards co-occurrence among T-lymphocyte markers was shown in whole samples (p<0.001; log odds ratio, >3). The TCGA Provisional dataset also included clinical HER2-associated variables and among them, variables of IHC-HER2 and HER2 FISH status were relatively complete data filled up. According to the clinical variables of IHC-HER2 and HER2 FISH status, the mRNA expression of T-cell markers was derived (Supplementary Figure 2, available online) and there was no significant association between T-lymphocyte marker expression and clinical HER2 information.
After downloading the mRNA expression data of T-lymphocyte markers and clinical HER2 information data of IHC-HER2 and HER2 FISH status, the association between T-lymphocyte markers was reinvestigated in HER2-positive tumors (Figure 1). According to the combined data of IHC-HER2 and HER2 FISH status, 198 out of 1,100 samples (18.0%) were clinically categorized as HER2-positive tumors. The TCGA dataset included 759 (59.0%) HER2-negative tumors and 143 (13.0%) cases with missing HER2 data. Pearson correlation coefficient between CD4 and CD8, CD4 and FOXP3, and CD8 and FOXP3 was 0.585 (p<0.001), 0.695 (p<0.001), and 0.602 (p<0.001), respectively. The corresponding Spearman's rho values were 0.750 (p<0.001), 0.761 (p<0.001), and 0.713 (p<0.001), respectively.
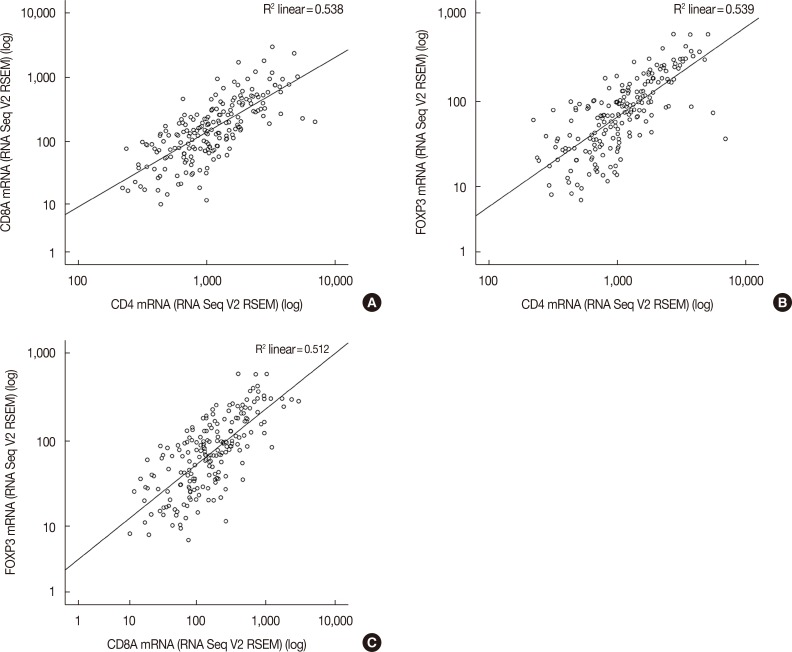
Figure 1
Association between CD4, CD8, and forkhead P3 (FOXP3) in human epidermal growth factor receptor 2 (HER2)-positive breast cancers. Among 198 patients with HER2-positive breast cancer considering immunohistochemistry-HER2 and HER2 fluorescence in situ hybridization status variables from the The Cancer Genome Atlas Provisional dataset, the association between (A) CD4 and CD8A, (B) CD4 and FOXP3, and (C) CD8A and FOXP3 is drawn.
RSEM=RNA-Seq by Expectation Maximization; V2=version 2.
![]()
Next, the prognostic value of T-lymphocyte markers in HER2-positive breast cancer was examined using the Kaplan-Meier plotter. Since the clear cutoff points of T-cell markers were not determined, the relapse-free survival according to different levels of T-lymphocyte markers was analyzed. Results of the survival analysis using a single marker for 168 HER2-positive cancers defined by HER2 status are summarized in Table 1 and for 208 HER2-positive subtypes defined by intrinsic subtype in Table 2. In HER2-positive cancers defined by HER2 status, as cutoff levels of biomarker increased, the hazard ratio gradually increased in CD4, increased and then decreased in CD8, and gradually decreased in FOXP3. However, there was no statistical significance of T-lymphocyte markers on survival (Table 1). In the HER2-positive intrinsic subtype, higher expression of CD4 and CD8 was significantly associated with favorable survival irrespective of cutoff levels (Table 2). Only when the patients were split by upper tertile and upper quartile of CD4, log-rank p-value was not statistically significant. Irrespective of cutoff levels, the hazard ratio of higher FOXP3 expression was less than 0.1, resulting in no statistical significance.
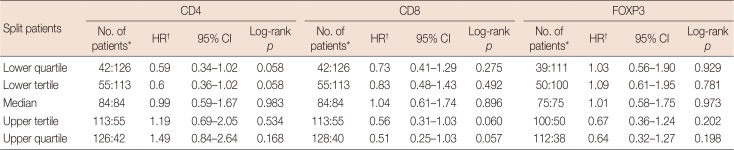
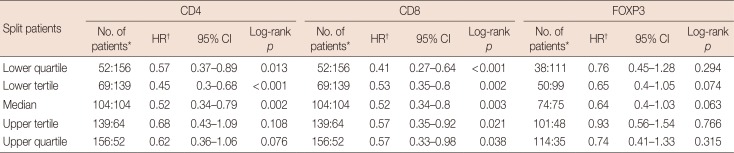
Table 1
Survival analysis according to T-lymphocyte markers using different cutoff levels in HER2-positive cancer defined by category of HER2 status from the Kaplan-Meier plotter
![]()
Table 2
Survival analysis according to T-lymphocyte markers using different cutoff levels in HER2-positive subtype defined by category of intrinsic subtype from the Kaplan-Meier plotter
![]()
Since the T-lymphocyte markers were significantly co-occurring in prior TCGA Provisional analysis, we reanalyzed survival using a multigene classifier for considering T-lymphocyte markers all together. Similar to the results in Table 1, there was no statistical significance in HER2-positive cancers defined by HER2 status (log-rank p>0.05) (Supplementary Figure 3, available online). In the HER2-positive intrinsic subtypes, however, higher expression of T-lymphocyte markers was associated with favorable survival irrespective of cutoff levels except for the median value (Figure 2).
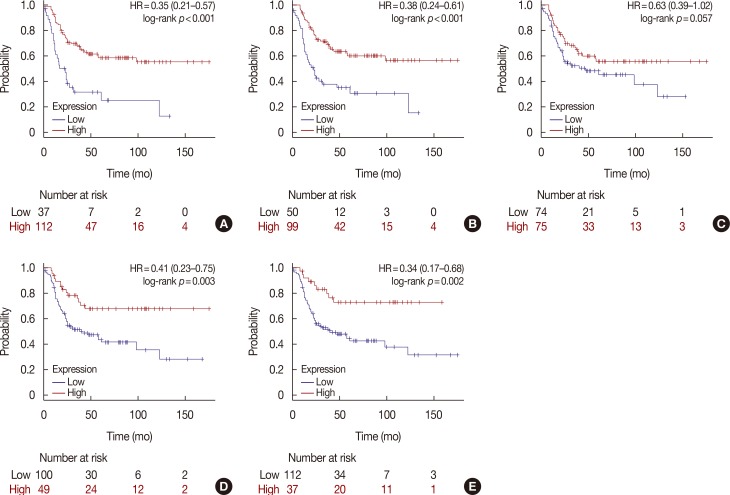
Figure 2
Survival curves using a multigene classifier in human epidermal growth factor receptor 2 (HER2)-positive subtype defined by category of intrinsic subtype from the Kaplan-Meier plotter. Plots were derived from the Kaplan-Meier plotter. Intrinsic subtypes are based on the 2013 St. Gallen criteria using the expression of HER2, Estrogen receptor (ER), and Ki-67 in the Kaplan-Meier plotter and HER2-positive intrinsic subtype is defined as HER2+/ER-. In 239 patients with the HER2-positive intrinsic subtype, patients are split by (A) lower quartile, (B) lower tertile, (C) median, (D) upper tertile, and (E) upper quartile.
HR=hazard ratio.
![]()
Finally, we explored the clinical implications of T-cell markers on the resistance to HER2-directed therapy by using tissue blocks of previous patient cohorts. Of the 47 tissue blocks, 30 (63.8%) were obtained from the breast. Tissue samples were obtained from locoregional sites in nine cases (19.1%). The lungs, brain, and bone or soft tissues were obtained in three (6.4%), three (6.4%), and two cases (4.3%), respectively. Positive IHC staining of the biomarkers are shown in Figure 3. Clinicopathological characteristics and expression of T-lymphocyte markers are presented according to the response to targeted therapy in Table 3. When the positive criteria were defined as CD4 3+, CD8 ≥2+, and FOXP3 ≥10% considering frequency of marker expression in this study, all good responders showed positive expression of T-lymphocyte markers one or more, although there was no statistical significance. Among poor responders, 18-matched baseline and resistant tumor samples before and after targeted therapy were compared considering combined 3 T-lymphocyte markers status. At baseline, four patients showed negative results for all 3 T-lymphocyte markers expression but changed to positive status of either biomarker at recurrent or metastatic sample. At baseline, 14 cases were positive for ≥1 T-lymphocyte markers and remained positive in 10 cases at recurrent or metastatic samples. However, four patients with positive status of either marker at baseline changed to negative expression of all T-cell markers to target recurrent or metastatic samples (Fisher exact test, p=0.524). There was no case of all negative markers at baseline and recurrent samples both concordantly. Discordant findings of combined markers between baseline and resistant tumors were noted in eight of 18 samples (44.4%).
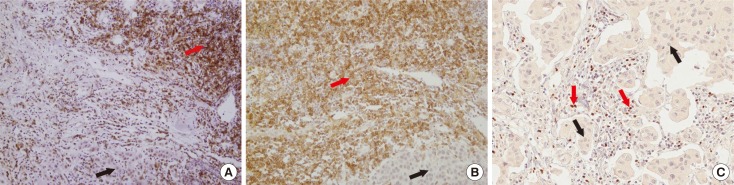
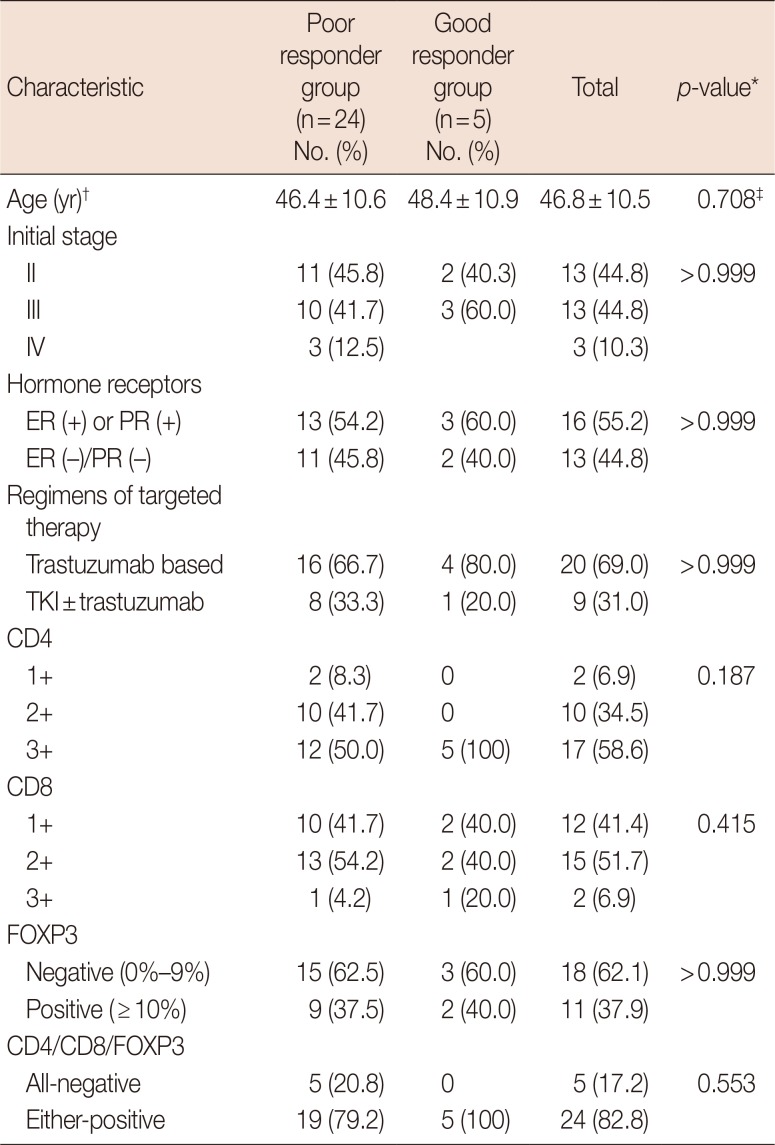
Figure 3
Immunohistochemical expression of CD4, CD8, and forkhead P3 (FOXP3) in human epidermal growth factor receptor 2 (HER2)-positive breast cancer tissues (×200). Immunohistochemical staining reveals that tumor infiltrating lymphocytes adjacent to cancer cells (black arrows) are reactive to CD4 (red arrow) (A), CD8 (red arrow) (B), and FOXP3 (red arrow) (C).
![]()
Table 3
Comparison of T-lymphocyte markers and clinicopathological characteristics between patients with good and poor response to targeted therapy
![]()
DISCUSSION
In the present study, HER2 was mutually exclusive with T-lymphocyte markers and significant correlation between T-cell markers was observed in HER2-positive tumors. According to the web-based bioinformatics analysis, there was no statistical importance of individual or combined T-cell markers on survival in clinically determined HER2-positive tumor irrespective of cutoff levels of biomarkers. In the HER2-positive intrinsic subtype, however, CD4 and CD8 were determined to have significantly positive association with survival; statistical significance remained when combined T-lymphocyte markers were considered irrespective of cutoff levels. Although small clinical sample size made it difficult to show the statistical importance of IHC study, good responders to neoadjuvant chemotherapy with targeted therapy may be associated with positive expression of combined T-lymphocyte markers. Discordance of combined markers between the baseline and resistant tumors in approximately half of the samples suggested that individualized resistance mechanisms might be involved in HER2-directed therapy.
A recent systematic review showed that the magnitude of TILs was variable within and between breast cancer subtypes and that lymphocyte-predominant breast cancer, CD8+ T-cells, and FOXP3+ TILs were 16% (range, 11%–24%), 61% (range, 40%–83%), and 67% (range, 61%–74%) in HER2-positive subtype, respectively [21]. In the present study, mRNA expression of CD4, CD8, and FOXP3 was not different according to HER2 status of the TCGA dataset, but there was a significant correlation between T-cell markers. In addition, previous evidence have supported the prognostic and predictive roles of TILs in breast cancers [13142223]. Our study also suggested a possible prognostic role of T-lymphocyte markers measured at mRNA levels in HER2-positive tumors. However, patient selection remains a key issue, and significance was shown only in ER-negative and HER2-positive subtype defined by intrinsic subtype.
There should be an agreement on the standardization of some methodological problems before the application of T-cell markers in routine clinical practice. Multicenter international ring studies by the international Immuno-oncology Biomarker Working Group demonstrated that reproducible evaluation of TILs using slides is feasible and the software-guided image evaluation is useful [24]. Recommendations by an international TILs working group described that it is still unknown whether RNA or protein classification of TILs shows better performance of prognostic or predictive value than slide morphology and that further evidence of detecting specific subpopulations by IHC is necessary [14]. In addition, our mRNA analysis could not discriminate the stromal and intratumoral TILs status although TILs Working Group recommended the percentage in the stromal compartment. More evidence is required for the clinical use of TILs.
A consensus should be reached on the cutoff levels for defining the clinically beneficial groups of TILs. The international TILs Working Group 2014 recommended no formal thresholds for clinically relevant TILs because a valid methodology was more important [14]. In the present study, both single and combined T-lymphocyte markers were significant prognostic factors irrespective of the cutoff values for mRNA expression. However, predictive cutoff levels could not be investigated. The FinHER and NCCTG N9831 studies suggested that increased immune function could be a predictor of response to trastuzumab [1225]. Nevertheless, TILs or immunity status should not be used to select the indications for targeted therapy at present [14].
Several mechanisms of resistance to targeted therapies have been suggested including escape from ADCC; alteration in HER2 (known as p95-HER2); expression of other growth factor signal receptors such as epidermal growth factor receptor, HER3, and insulin-like growth factor-1 receptor; cross-talk between ER and HER2 signaling; and upregulation of PI3K-AKT-mTOR pathway [6726]. The discordance in the expression rates of T-lymphocyte markers between primary and metastatic tissues have not been fully understood, but our study demonstrated that half of the samples showed discordant findings. Although it is likely that different complex mechanisms coexist, most studies evaluated each biomarker including the ones in the present study; overcoming this hurdle is a future challenge [7].
Limitations of the present study were that mRNA expression and IHC staining were currently not recommended for assessing T-lymphocyte marker expression, and that independent validation and large clinical sample size were required for verifying their roles as prognostic and predictive biomarkers. There are many other subpopulations of immune cells or various immune markers including CD3; however, we have only applied 3 markers. Further studies are required for the application of immune function to daily practice.
In conclusion, the present study attempted to investigate the clinical implications of CD4, CD8, and FOXP3 on the survival of patients with HER2-positive breast cancers using different patient selection criteria and various cutoff levels based on a web-based database. A certain proportion of T-lymphocyte marker expression between primary and resistant tissues presented discordant findings, which suggested different and personalized resistance mechanisms to targeted therapy. In the era of wide use and focus on development of HER2-directed therapies, the association of immune function with HER2 pathway and setting up diagnostic and therapeutic strategies for overcoming resistance mechanisms to HER2-targeted therapies is imperative.
 XML Download