

 PDF
PDF ePub
ePub Citation
 Print
Print


INTRODUCTION
Cancer is a life-threatening disease and is responsible for about 7.6 million deaths every year worldwide. Cancer cells exhibits features of unlimited cell proliferation due to key changes in several crucial signal transduction pathways [1]. Canonical mitogen-activated protein kinase (MAPK) signaling, nuclear factor κB (NF-κB) signaling, and cell cycle regulatory networks are disrupted through the modulation of one or more key regulatory proteins [1]. Protein kinase C (PKC)-mediated signaling is an essential pathway that is modulated by cancer cells to acquire a tumorigenic phenotype [2]. The PKC family of serine/threonine kinases plays a central role in cellular signal transduction. A multifamily of proteins that are activated upon association with cellular membranes [3], they are implicated in numerous intracellular signaling events such as cell growth, determination of cell polarity, cell migration, cell proliferation, differentiation, tumor promotion, and apoptosis. PKCs are implicated downstream of a wide range of G protein-coupled receptors, tyrosine kinase receptors, and other growth factor-dependent receptors. Studies have revealed that PKC-mediated signaling is generally growth-supportive and stimulate cell division when activated in both normal and cancer cells [4]. This stimulation is tightly controlled by natural ligands, such as diacylglycerols (DAGs), to ensure that PKC provides the adequate stimulation to drive cell division. Many cancer cells acquire mutations that overexpress PKC for providing cell-proliferating signals [4]. For example, lung cancer cells were found to have higher levels of PKC than other types of cancer cells, and human breast tumor biopsies have higher PKC levels and activity than normal breast tissues [4]. Conventional PKCs such as PKCα are overexpressed in highly metastatic estrogen receptor (ER)-negative breast cancer cell lines compared with lower levels in nonmetastatic ER-positive breast cancer cell lines. In addition, overactivation [5] or inhibition [6] of PKC can have perilous consequences on cancer cell viability through induction of proapoptotic pathways. For example, overactivation of PKC by phorbol esters induces apoptosis in LNCaP prostate cancer cells via activation of p38 MAPK pathway and inhibition of the Akt survival pathway [7]. PKC overactivation in intestinal epithelial cells results in rapid and transient induction of p21waf1/cip1, sustained induction of p27kip1, rapid downregulation of cyclin D, and inhibition of the cyclin-CDK complex activity [8]. Finally, PKCδ stimulates apoptosis in a wide variety of cell types when overexpressed and is the most sought-after PKC enzyme for cancer therapy [9].
Numerous classes of naturally occurring compounds or synthetic derivatives such as bicoumarins, diterpene esters, macrocyclic lactones, xanthones, curcuminoids, indole alkaloids, teleocidin, mezerein, iridals, polyacetates, modified tigliane, daphnane, and ingenane diterpene esters are either activators or inhibitors of PKC [1011]. Bryostatins, a group of macrocyclic lactones, are potent activators of PKC whereas flavonoids, namely fisetin, quercetin, luteolin, and daphnetin, are the most potent PKC inhibitors [1011]. On one hand, indole alkaloid derivatives are found in microbial flora for example Nocardiopsis sp., and are very potent inhibitors of PKC. On the other hand, alkaloids such as teleocidin and iridals bind to PKC by mimicking DAGs and activate PKC. Tigliane, daphnane, and ingenane diterpene esters are new classes of compounds that mimic the binding of phorbol esters to PKC and are potent activators of PKC [12]. For example, the human promyelocytic leukemia (HL-60) cells undergo apoptosis with DNA fragmentation when treated with various pharmacological inhibitors of PKC.
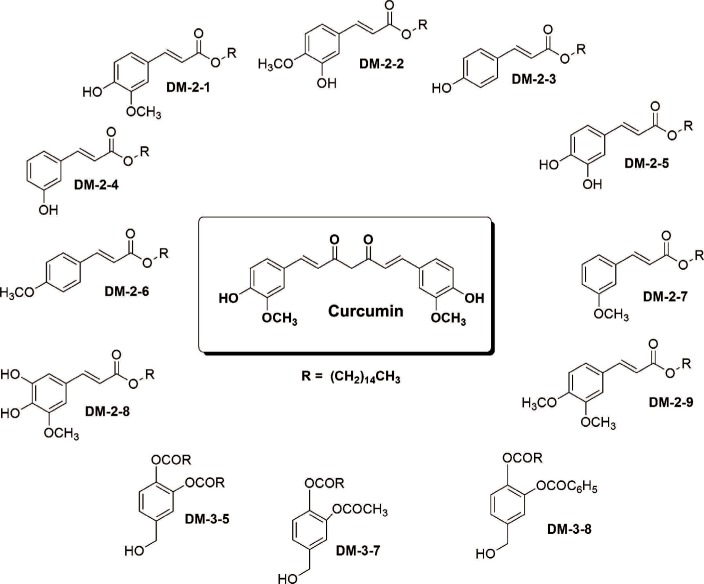
Design, synthesis, molecular docking, and in vitro ligand-binding analyses of a series of alkyl cinnamates (Figure 1) indicate that these compounds strongly interact with the PKC C1b subdomain [13]. Here, we have investigated the ability of these alkyl cinnamates to cause PKC translocation and affect downstream signaling to disturb cell cycle and cellular viability of breast cancer cells. In addition, we have explored the molecular mechanism of cell death and downstream activation of proapoptotic pathway in cancer cells. The results presented here indicate that these compounds are efficient in translocating PKC from the cytosol to the plasma membrane in MDAMB-231 breast cancer cells. Alkyl cinnamates were found to disturb the cell cycle with a G2/M arrest and significant reduction in the DNA synthesis phase, S phase. They also caused morphological abnormalities and death in breast cancer cells via apoptotic pathways. Mechanistic details suggest mitochondrial potential loss, release of cytochrome c (cyt c), activation of caspase-9 and caspase-3, and degradation of genomic DNA (gDNA) into a laddering pattern. In addition, these compounds induce the development of oxidative stress in cancer cells, and oxidative stress has been implicated in apoptosis-mediated cell death. In summary, alkyl cinnamates are novel molecules targeting PKC to induce cell death in cancer cells, and these compounds have the potential to be developed into anticancer drugs.
METHODS
Chemicals and reagents
N-acetylcysteine (NAC), propidium iodide, ethidium bromide, acridine orange, 3-(4,5-dimethylthiazol-2-yl)-2,5-diphenyltetrazolium bromide (MTT), thiobarbituric acid, 1,19,3,39-tetraethoxypropane, guanidine hydrochloride, agarose, DAPI-containing mounting solution, filipin, and chemiluminescence peroxidase kits were purchased from Sigma (St. Louis, USA). Dimethylsulfoxide (DMSO), Triton X-100, Tween-20, hydrogen peroxide, methanol, β-mercaptoethanol, acrylamide, and bis-acrylamide were obtained from Merck (Boston, USA). Anti-PKCα and anti-cyt c antibodies, Mito-Tracker Red, and JC-1 dye were obtained from BD-Biosciences (San Jose, USA). Anti-5′-nucleotidase antibody was purchased from Cell Signaling Technology (Danvers, USA). Caspase-3 assay kit was from BD Pharmingen (San Jose, USA). Caspase-9 colorometric kit was from Invitrogen Corp. (Waltham, USA). Other reagents and chemicals were of analytical grade purity.
Cell lines, cell culture, and treatments
MDAMB-231 and MCF-7 breast cancer cell lines were obtained from the national cell culture facility at the Central Drug Research Institute (Lucknow, India). MDAMB-231 breast cancer cells were cultured in DMEM/F12 (HyClone Laboratories Inc., Logan, USA), supplemented with 10% fetal bovine serum and 1% penicillin-streptomycin antibiotic solution (100 units/mL penicillin and 100 µg/mL streptomycin sulfate). Cells were grown at 37℃ in a humidified 5% CO2 incubator and seeded overnight prior to the day of experiments in 200 µL complete media. Cells were washed twice with cell culture grade phosphate-buffered saline (PBS) and treated with different concentrations of the alkyl cinnamates (stock solution prepared in DMSO) (Figure 1) in serum-free medium with a final DMSO concentration below 0.02%.
Immunolocalization of PKCα in MDAMB-231 cells
MDAMB-231 cancer cells were treated with alkyl cinnamates at their respective half maximal inhibitory concentrations (IC50) in serum-free media for 0 to 40 minutes. After treatment, the cells were washed with PBS and fixed in chilled methanol-acetone (1:1) at -20℃ for 10 minutes. Samples were washed with PBS and blocked with 3% BSA (low fat) prepared in sterile PBS in a humidified CO2 incubator for 1 hour. Cells were incubated with an anti-PKCα antibody for 16 hours at 4℃ with intermittent shaking. Cells were washed with sterile PBS and incubated with an anti-mouse antibody conjugated with Fluorescein isothiocyanate (FITC) for 4 hours at 37℃ with intermittent shaking. Cells were also stained with the fluorescent dye filipin (50 µg/mL) to label cell membrane. Finally, the cells were washed twice with PBS and mounted in mounting media on clean slides, allowed to dry for 15 minutes, and observed under a Nikon Eclipse 80i fluorescence microscope (Nikon, Tokyo, Japan).
Immunoblotting to detect PKCα translocation
MDAMB-231 cancer cells were treated with different alkyl cinnamates at their respective IC50 concentrations, in serum-free media for 30 minutes. After treatment, cancer cells were lysed in 10 mM HEPES pH 7.4 by passing 10 times through a sterile 2-bend 22 gauge syringe. The cytosolic and membrane fractions from the cell lysate were prepared as previously described [14], and their purity were checked by presence of lactate dehydrogenase (LDH, a cytosolic marker protein) and 5′-nucleotidase (plasma membrane marker protein). A representative assay result is given in the Supplementary Figure 1 (available online). The amount of total protein was quantified by Lowry's method, and equal quantity of protein (~40–50 µg) was resolved on a 10% sodium dodecyl sulfate polyacrylamide gel electrophoresis (SDS-PAGE), transferred to the polyvinylidene difluoride membrane by electroblotting at 110 V for 4 hours. The nitrocellulose membrane was blocked overnight with 5% skim milk prepared in sterile PBS containing 0.1% Tween-20. PKCα immunoreactive protein band was identified during an anti-PKCα primary antibody incubation at 4℃ for 16 hours, followed by an anti-mouse HRP-tagged antibody for 8 hours at 4℃. The blot was developed with a chemiluminescence peroxidase kit. The intensity of each band was estimated using the ImageJ program (National Institutes of Health, Bethesda, USA) to calculate PKC translocation, with the level of PKCα in the cytosolic fraction normalized to 100%.
Cell cycle analysis
MDAMB-231 cells (106) were seeded overnight in a 6-well plate in DMEM/F12 complete medium. MDAMB-231 cells were treated with different alkyl cinnamates at their respective IC50 concentration in serum-free medium for 24 hours. Cells were stained with propidium iodide and analyzed immediately at room temperature by flow cytometry with a BD FACS-Calibur and analyzed with the ModFit software (BD Biosciences).
MTT viability assay and morphological analysis of breast cancer cells
The cell viability was measured by MTT assay. Results were expressed as the percentage viability with untreated cells normalized to 100%. For morphological analysis, MDAMB-231 cells were treated with different alkyl cinnamates (at their respective IC50 concentration) and observed with a Nikon eclipse TS-100F inverted microscope. Images were captured with a high-resolution Nikon L22 camera.
Discrimination of live, dead, and necrotic cells by flow cytometry
Healthy, apoptotic, or necrotic cells were identified by staining with the combination of acridine orange and propidium iodide. Quadrant analysis was performed to determine healthy, early apoptotic, late apoptotic, and dead cells from the total cell population.
DNA fragmentation assay
MDAMB-231 cells were treated with different alkyl cinnamates (at their respective IC50 concentration) for 12 hours at 37℃ in serum-free media. Cells only treated with serum-free medium were considered as control. After treatment, cells were washed twice with sterile ice-cold PBS and processed for DNA laddering assay as described previously [15]. Fragments of DNA were visualized under ultraviolet light, and images were captured with a Gel Doc EZ imager (Bio-Rad, Hercules, USA).
Detection of mitochondrial membrane potential
MDAMB-231 cells were treated with different alkyl cinnamates (at their respective IC50 concentration) for 24 hours at 37℃ in serum-free media. Cells only treated with serum-free medium were considered as control. After treatment, cells were washed twice with sterile ice-cold PBS and stained with JC-1 as per manufacturer's instructions. Finally, coverslips were gently washed once in PBS and then mounted in normal mounting media, allowed to dry for 15 minutes, and immediately observed in a Cytell Imaging System (GE Healthcare, Chicago, USA).
Determination of mitochondrial cyt c release
MDAMB-231 cells were treated with different alkyl cinnamates at their respective IC50 concentration, for 24 hours in serum-free media. After treatment, cells were washed with PBS and incubated with MitoTracker Red to label mitochondria, and an anti-cyt c antibody was used to stain cyt c. Cells were washed with sterile PBS and incubated with an antimouse antibody conjugated with FITC for 4 hours at 37℃ with intermittent shaking. Finally, the coverslips were washed twice with PBS and mounted on clean slides, allowed to dry for 15 minutes, and observed with a Nikon Eclipse 80i fluorescence microscope.
Caspase-3 and caspase-9 assay
MDAMB-231 cells were treated with different alkyl cinnamates at their respective IC50 concentration, for 24 hours in serum-free media. Caspase-3 and caspase-9 activities were measured as per manufacturer's instructions. Cells only treated with serum-free medium were considered as control.
Measurement of reactive oxygen species (ROS) level in MBAMB-231 cells
MDAMB-231 cells were treated with different alkyl cinnamates for 3 hours, and ROS level was measured as described previously [16].
LDH activity assay
LDH activity assay in cytosolic or membrane fraction was performed as previously described [15].
RESULTS
Alkyl cinnamates mediate PKC translocation to the plasma membrane
We tested the ability of alkyl cinnamates to induce PKC translocation from cytosol to the plasma membrane after binding to the PKC C1b subdomain. MDAMB-231 breast cancer cells were stimulated with the different alkyl cinnamates for a period of 0 to 40 minutes at 37℃. After treatment, anti-PKCα antibodies were used to observe the localization of PKC, and the fluorescent dye filipin was used to stain cellular membranes in MDAMB-231 cells, as described in the methods section. PKC signal on the plasma membrane was minimal at 5 minutes of treatment with alkyl cinnamates (Figure 1) but increased gradually with maximal signal at 30 minutes (Figure 2A). By comparison, cancer cells stimulated with incomplete media showed minimal signal on the plasma membrane, and most of the PKC proteins remained within the cytosol (Figure 2A).
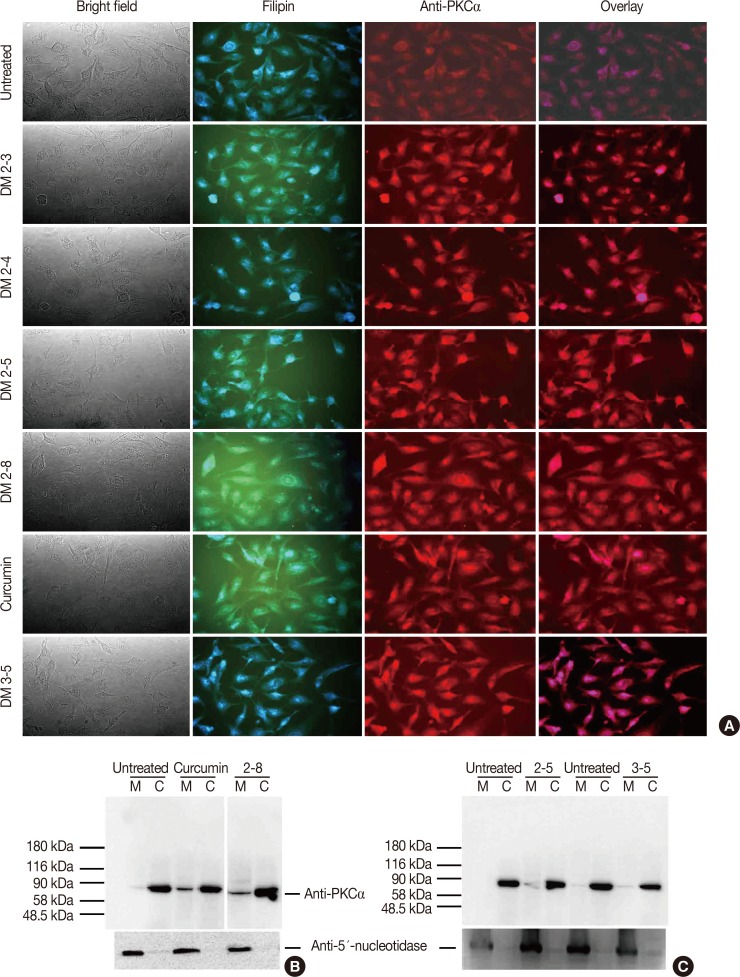
Figure 2
Alkyl cinnamates have potential to exhibits protein kinase C (PKC)-α translocation from cytosol to the plasma membrane in MDAMB-231 cells. (A) Immunolocalization of PKCα in MDAMB-231 treated with different alkyl cinnamates to monitor PKC translocation from cytosol to plasma membrane. MDAMB-231 cells were treated and PKCα immunolocalization was done as given in Methods. In each panel, bright field, PKCα (red), filipin to stain cell membrane (blue) and overlay. Untreated cells show a low level of PKCα at plasma membrane compared to significant high signal in alkyl cinnamate treated cells. (B, C) Immunoblotting of PKCα in MDAMB-231 treated with different alkyl cinnamates to monitor PKC translocation from cytosol to plasma membrane. MDAMB-231 cells were treated and PKCα immunolocalization was done as given in Methods. The purity of cytosolic or membrane fraction was asses by testing the presence of lactate dehydrogenase (LDH) and 5′-nucleotidase in these fractions. LDH activity assay was performed as described previously whereas presence of 5′-nucleotidase was done by immune-blotting with anti-5′-nucleotidase antibodies. Untreated cells show a basal level of PKCα at plasma membrane whereas a high level of PKCα was found in alkyl cinnamate treated cells.
![]()
Qualitative immunolocalization observations were further validated by the semiquantitative immunoblotting technique. MDAMB-231 breast cancer cells were stimulated with different alkyl cinnamates for 30 minutes, and the membrane and cytosolic fractions were prepared and resolved on SDS-PAGE, and PKCα was probed using an anti-PKCα antibody, as described in the method section. In addition, purity of the cytosolic and membrane fraction was characterized by enzymatic activity assay of LDH (a cytosolic marker) and reprobing with an anti-5′-nucleotidase (a plasma membrane marker) antibody, as described in and the method section. The level of PKCα in cytosolic fractions was normalized to 100% and used to calculate the translocation efficiency in MDAMB-231 cells that were treated with different alkyl cinnamates. MDAMB-231 cells stimulated with DM-2-8 exhibited 16.6%±1.7% translocation of PKC from cytosol to the plasma membrane fractions (Figure 2B). The levels of PKC translocation in cancer cells stimulated with DM-2-5 and curcumin were 8.2%±0.9% and 17%±1.9%, respectively. Under similar conditions, cancer cells stimulated with medium only showed low level (0.7%±0.2%) of PKC translocation. Interestingly, cancer cells stimulated with the low-affinity compound DM-3-5 did not show any significant PKC signal in the plasma membrane fraction. Hence, the results in Figure 2 bolster the notion that PKC interaction with alkyl cinnamates induces a robust translocation of PKCα from the cytosol to the plasma membrane.
Alkyl cinnamates disturb the cell cycle and arrest cancer cells in G2/M phase
PKC is known to actively regulate the cell cycle and hence directly contribute to cell proliferation or cell death [17]. We further tested how alkyl cinnamates affect the cell cycle of breast cancer cells. MDAMB-231 breast cancer cells were treated with different alkyl cinnamates and immediately analyzed by flow cytometry. Forty-one percent to 42% of untreated cancer cells were in G1 phase, 39% to 40% cells in S phase, and 18% cells in the G2/M phase (Figure 3A), whereas cancer cells stimulated with alkyl cinnamates showed a disturbance of the cell cycle stages. The population of cancer cells in the G2/M phase increased with a concomitant decrease of cells in the S phase (Figure 3A). DM-2-8 had the most profound effect with 54.2% cells in G1 phase, 20% cells in S phase, and 25% cells in the G2/M phase (Figure 3B). Hence, alkyl cinnamates are reducing S phase, arresting cancer cells in G2/M or G1 phase, and this disturbance of the cell cycle may significantly affect the cellular ability to survive or proliferate.
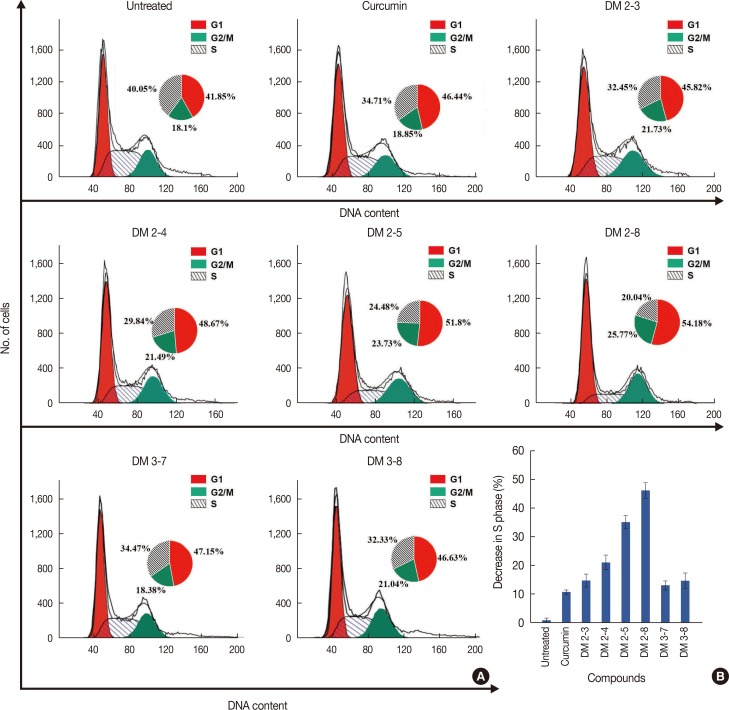
Figure 3
Alkyl cinnamates disturb cell-cycle in MDAMB-231w cells. (A) Cells were treated with different alkyl cinnamates (half maximal inhibitory concentrations [IC50]) for 24 hours in incomplete media, stained with propidium iodide as given in Methods, and immediately analyzed by flow cytometry. The cells treated with different compounds show G2/M arrest and reduction of S phase. (B) Plot of change in S phase of MDA-MB-231 cells treated with different alkyl cinnamates.
![]()
Alkyl cinnamates induce cellular damage and death in breast cancer cells
G1 or G2/M arrest with a decrease of the S phase may significantly affect the cellular ability to grow and withstand stress. To test such a possibility, breast cancer cells were treated with the different alkyl cinnamates and observed under high-resolution inverted microscope to detect morphological abnormalities in cellular structures. Control cancer cells were healthy with a spindle-shaped appearance with no signs of cellular damage or stress. By contrast, alkyl cinnamate-treated cancer cells exhibited cytoplasmic shrinkage and membrane blebbing patterns, indicating a high proportion of cells progressing towards death (Supplementary Figure 2, available online). In addition, alkyl cinnamates dose dependently caused reduction in viability in breast cancer cells (Supplementary Figure 3, available online). DM-2-3, DM-2-4, and DM-2-8 showed anticancer activity against MDAMB-231 cells with an IC50 value of 1.5±0.1 µg/mL, 1.9±0.1 µg/mL, and 4.1±0.3 µg/mL, respectively. Compound DM-3-5 was the least active against MCF-7 cancer cells and was ineffective against MDAMB-231 cancer cells (Table 1). MDAMB-231 is a triple-negative breast cancer cell line that is highly aggressive and metastatic, whereas MCF-7 is an ER-positive breast cancer cell line and is nonmetastatic. The viability assay confirmed that alkyl cinnamates induced cell death in ER-positive and triple-negative breast cancer cells. All alkyl cinnamates were nontoxic and did not cause any damage to red blood cells through hemolysis (Supplementary Figure 4, available online). In silico toxicity also confirmed that these alkyl cinnamates are safe to use (Supplementary Table 1, available online). Alkyl cinnamates are curcumin analogues that are also nontoxic to rapidly growing blood lymphocytes.
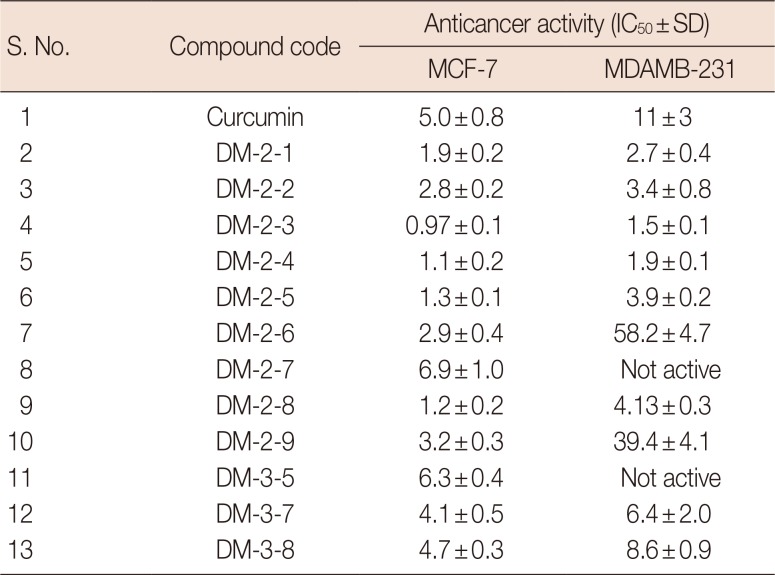
Table 1
Activity of novel DM compounds against breast cancer cells
Breast cancer cells (MDA-MB231 or MCF-7) are treated with different heterocyclic compounds in serum-free media for 48 hours and cell viability was measured by MTT assay. The viability of untreated cells are considered as 100% and used to calculate the percentage change in viability of compound treated cells. IC50 of individual compounds were calculated and expressed in µg/mL.
S.No.=serial number; MTT=3-(4,5-dimethylthiazol-2-yl)-2,5-diphenyltetrazolium bromide; IC50=half maximal inhibitory concentrations.
![]()
Alkyl cinnamates target cancer cells through induction of apoptosis
MDAMB-231 breast cancer cells were treated with the different alkyl cinnamates and the differential population of healthy, apoptotic (early or late), necrotic, and dead cells were identified by the acridine orange-propidium iodide (AO-PI) double staining method. Untreated cancer cells showed mostly healthy cells (70%), and this was made evident by a lower intake of PI into their gDNA. Alkyl cinnamate-treated cancer cells showed a lower number of healthy cells with a concomitant increase of cells in the apoptotic (early and late) or death phases (Figure 4A). DM-2-8 was the most potent molecule and induced the highest proportion of cells in early apoptotic (39.7%) and late apoptotic (24.7%) phases. It was followed by DM-2-4, which induced early apoptosis and late apoptosis in 23.9% and 27.6% of the breast cancer cells, respectively. The flow cytometric analysis indicates that cell death caused by alkyl cinnamates might be following apoptotic rather than necrotic pathways.
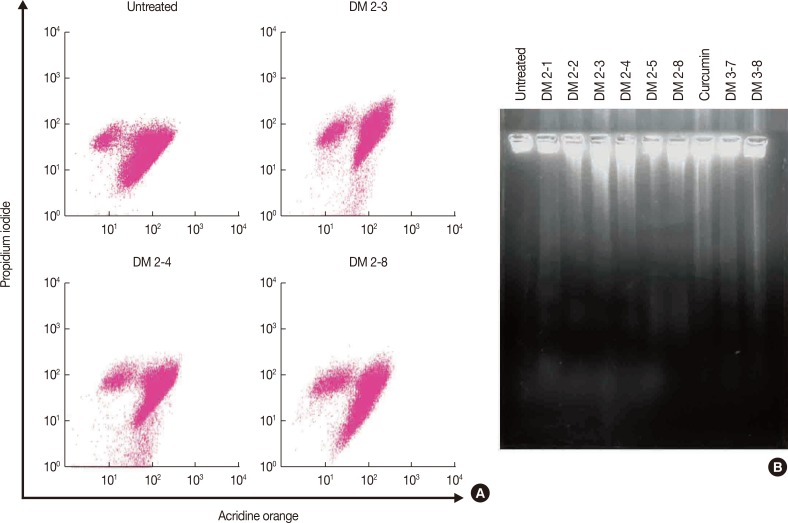
Figure 4
Alkyl cinnamates are causing death of MDAMB-231 following apoptosis. (A) MDAMB-231 treated with different alkyl cinnamates and distribution of healthy, dead, apoptotic and necrotic cells. Cells were treated alkyl cinnamates (IC50 for 24 hours), stained with acridine orange and propidium iodide and analyzed by flow cytometry. (B) MDAMB-231 treated with different alkyl cinnamates exhibits DNA fragmentation. Cells were treated with different alkyl cinnamates (the IC50 values of the compounds for 12 hours) in serum-free media and samples were processed for DNA laddering analysis. A laddering pattern of DNA is observed in alkyl cinnamate treated cells compared to the intact genomic DNA in untreated cells.
![]()
These observations were further confirmed by the DNA fragmentation analysis to detect gDNA degradation. During necrosis, unregulated, random cleavage of gDNA is expected to produce DNA smear, whereas apoptotic cells exhibit a preprogrammed, organized, and regular pattern of nuclear DNA cleavage with the characteristic appearance of a laddering pattern. MDAMB-231 cells were treated with different concentrations of alkyl cinnamates, and gDNA was extracted from treated cells and analyzed on 1.8% agarose gel. Untreated cancer cells showed an intact gDNA with no sign of DNA fragments/smear (Figure 4B, lane 1). By contrast, cancer cells treated with alkyl cinnamates gave a laddering pattern with DNA fragments of different sizes (Figure 4B, lanes 2–10). DM-2-1, DM-2-3, DM-2-4, DM-2-8, or curcumin produced distinct DNA fragments that were absent in untreated cancer cells. Absence of DNA smear clearly ruled out the involvement of necrotic pathway in alkyl cinnamate-mediated cancer cell death.
Apoptosis in breast cancer cells is induced via the mitochondrial pathway
It is interesting to confirm that alkyl cinnamates induce breast cancer cell death via an apoptotic pathway rather necrosis and to investigate whether apoptosis induced by alkyl cinnamates involves the mitochondrial pathway. Untreated cancer cells were healthy, as evidenced by orange fluorescence that showed the accumulation of the dye aggregating inside the mitochondrion. It also showed intact mitochondria with a preserved membrane potential (Figure 5). On the contrary, alkyl cinnamate-treated cancer cells showed green fluorescence that was spread evenly throughout the cytosol with little orange fluorescence. This indicates a leaky mitochondrial behavior and disruption of the mitochondrial membrane potential, as evidenced by an absence of accumulation of JC-1 dye aggregates inside the mitochondria (Figure 5). Release of cyt c is the result of a disruption of the mitochondrial membrane potential during apoptosis. We further explored the release of cyt c from mitochondria in alkyl cinnamate-treated cancer cells. Mitochondria were identified by staining the cells with MitoTracker Red dye, which localizes inside the mitochondrion irrespective of the mitochondrial membrane potential status. Immunostaining with anti-cyt c antibodies in untreated cancer cells showed that signal of cyt c was highly specific to distinct locations inside the cell. Cyt c signal (green) was colocalized with MitoTracker signal (red). It indicates the presence of cyt c inside the intact mitochondria in untreated cancer cells (Figure 6). In alkyl cinnamate-treated cancer cells, cyt c was almost evenly distributed throughout the cytosol and was not colocalized with the MitoTracker signals (Figure 6). The immunostaining data indicate that there was a release of cyt c from mitochondria into the cytosol in alkyl cinnamate-treated samples (Figure 6). MDAMB-231 cells treated with curcumin or DM-2-8 for 24 hours showed increase in caspase-9 activity compared with the untreated sample (Figure 7A). Cancer cells treated with curcumin or DM-2-8 displayed a 35% or 48% increase in caspase-9 activity, respectively. Similarly, DM-2-8- or curcumin-treated cell displayed 90% or 65% increase in caspase-3 activity, respectively (Figure 7B). These experiments indicate that these alkyl cinnamates induces the intrinsic pathway to induce apoptosis in MDAMB-231 breast cancer cells.
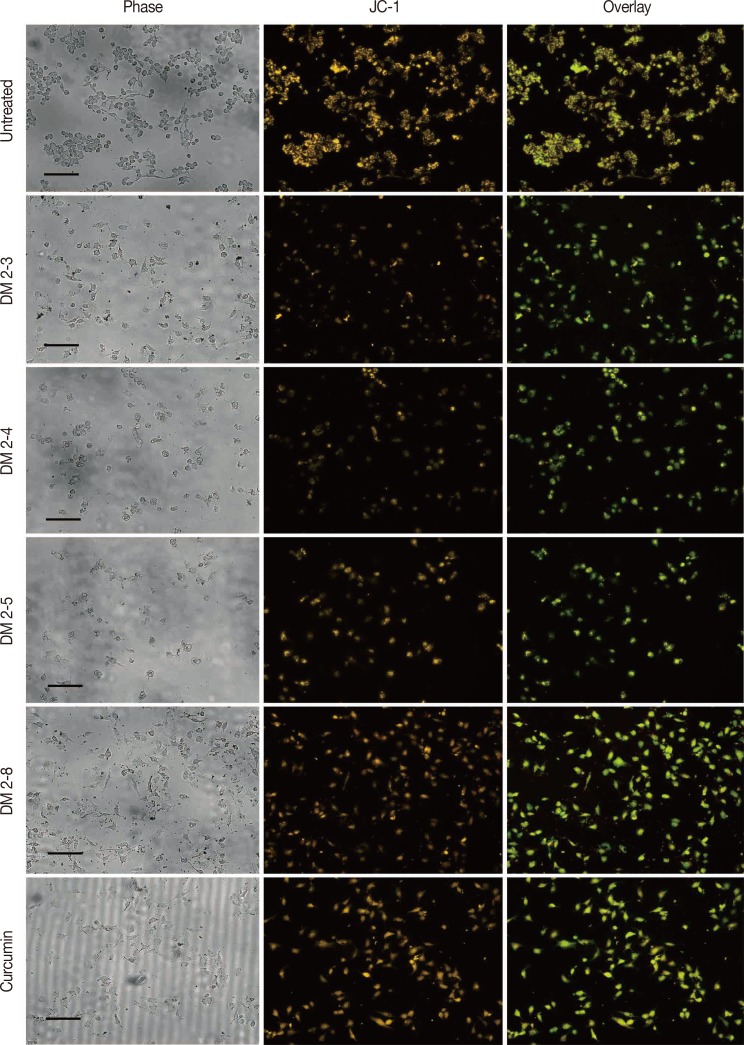
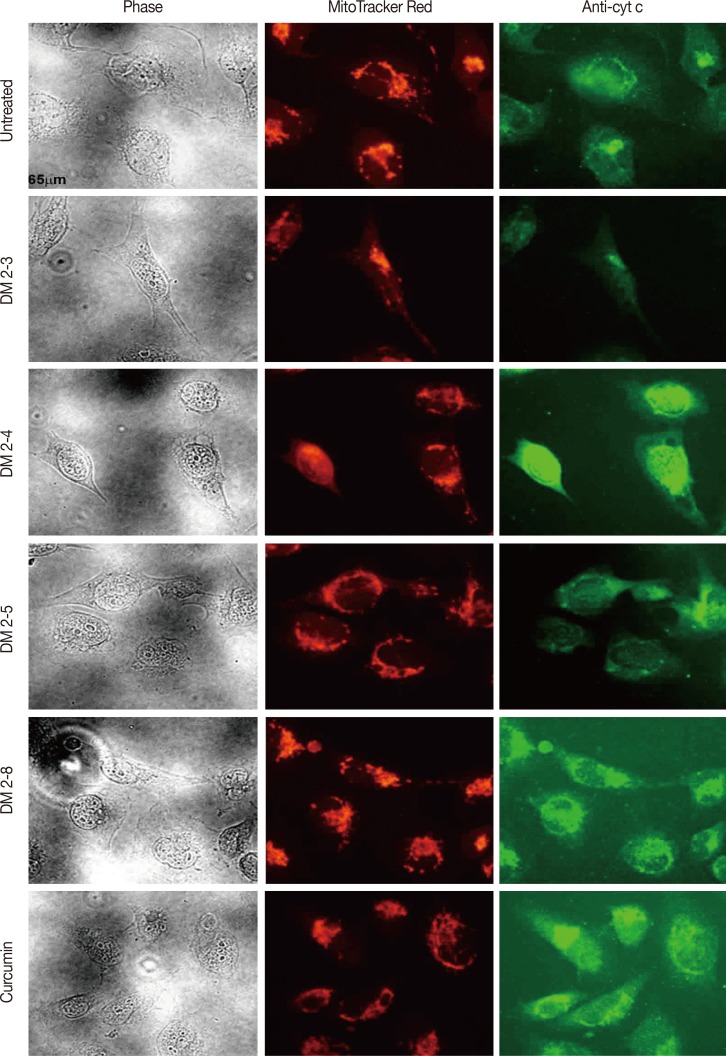
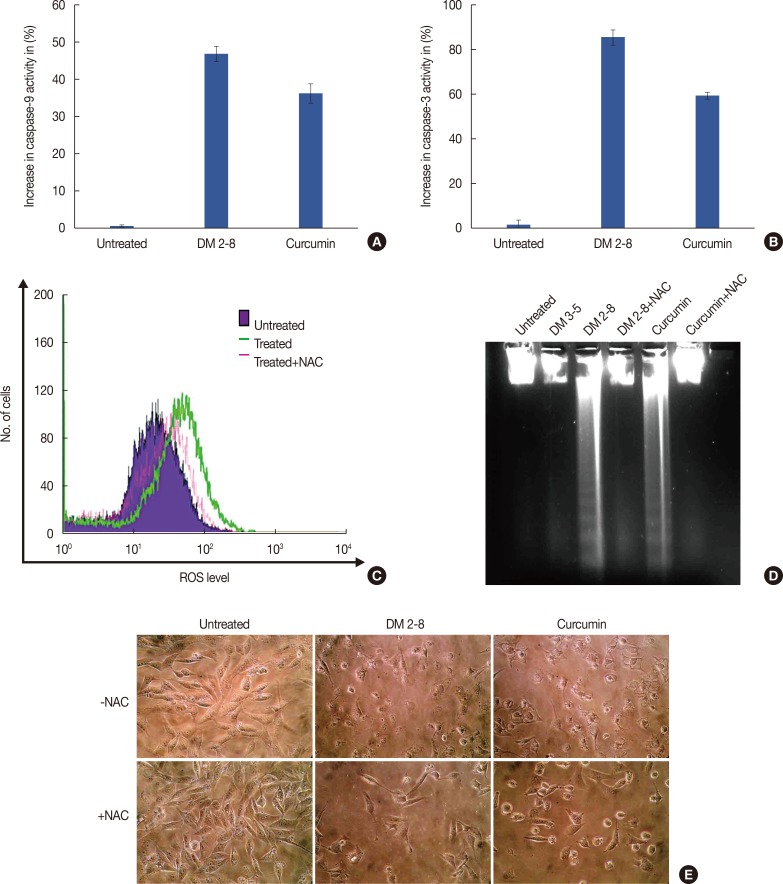
Figure 5
Loss of mitochondrial membrane potential in alkyl cinnamates treated MDAMB-231 breast cancer cells. MDAMB-231 breast cancer cells were treated with alkyl cinnamates (IC50) in serum-free media for 24 hours. After treatment, cells were stained with JC-1 dye for 20 minutes and were observed in Cytell Imaging System (GE Healthcare). Alkyl cinnamates treated cells show a decrease in mitochondrial membrane potential as indicated by loss of orange and appearance of green fluorescence (scale bar, 130 µm).
![]()
Figure 6
Release of cytochrome-c (cyt c) from alkyl cinnamate treated MDAMB-231 breast cancer cells. MDAMB-231 breast cancer cells were treated with alkyl cinnamates (IC50) in serum-free media for 24 hours. After treatment, cells were immune-stained with anti-cyt c antibodies and location of mitochondria in MDAMB-231 cells is determined by loading the cells with MitoTracker (BD-Biosciences; 200 nM for 45 minutes) as given in material and methods. Labelled cells were observed in a fluorescent microscope 80i (Nikon). In each panel, bright field, cyt c (green), MitoTracker Red (red) is given. High resolution fluorescence microscopy detected release of cyt c from DM2-3, DM2-4, DM2-5 and curcumin treated cells. Untreated cells seem healthy with the cyt c signal overlapping with MitoTracker signal.
![]()
Figure 7
Cytochrome C release activates down-stream cytosolic caspases. Caspase 9 (A) and caspase 3 (B) activity in MDAMB-231 cells treated with alkyl cinnamates. Caspase-3 activity levels increased by 90% and 65% in DM2-8 and curcumin. (C) Flow cytometric measurement of reactive oxygen species (ROS) levels in alkyl cinnamate treated breast cancer cells. Cells were treated with alkyl cinnamates (IC50) for 3 hours and DCF-DHA was used as a ROS probe. DM-2-8 treated cells show an increased level of ROS compared to untreated cells. The preincubation of cells in N-acetylcysteine (NAC) reduces ROS level in treated cell. The preincubation of cells in N-acetylcysteine (NAC) reduces ROS level and apperance of DNA fragments (D) in treated cell. Cells were treated with DM 2-8 or curcumin in the absence or presence of NAC (5 mM) and presence of NAC give intact genomic DNA with no visible appearance of DNA fragments. (E) Microscopic observation of MDAMB-231 cells treated with DM-2-8 or curcumin for 48 hours in absence or presence of NAC. Images were taken with high resolution Nikon L22 camera. Cells preincubated with NAC gives an improved cellular morphology compared to DM-2-8 or curcumin treated cells.
![]()
Alkyl cinnamates causes apoptosis in an oxidative stress-dependent pathway
We further investigated the role of oxidative stress in alkyl cinnamate-mediated cell death in MDAMB-231 breast cancer cells. Alkyl cinnamate-treated MDAMB-231 cells show an increased level of ROS compared with that of untreated cancer cells (Figure 7C). In the presence of NAC, oxidative stress level was reduced in alkyl cinnamate-treated cancer cells (Figure 7C). We further explored the role of oxidative stress in the induction of apoptosis, cellular damage, and death during treatment of cancer cells with alkyl cinnamates. Cancer cells were treated with DM-2-8 or curcumin in the absence or presence of NAC. Untreated cancer cells show an intact gDNA with no sign of DNA fragments/smear (Figure 7D, lane 1), whereas cancer cells treated with DM-2-8 or curcumin showed DNA fragments of different sizes (Figure 7D, lanes 3 and 5). By contrast, cancer cells preincubated with NAC (5 mM) showed intact gDNA with no visible appearance of DNA fragments (Figure 7D, lanes 4 and 6). Subsequently, we found that pretreatment of MDAMB-231 cells with NAC restores cell morphology compared with cells treated with alkyl cinnamates (Figure 7E).
DISCUSSION
Binding of ligands to PKC C1b subdomain can either inhibit or activate PKC. Ligands that bind to the C1b subdomain but fail to induce the translocation of PKC to the plasma membrane act as inhibitors. By contrast, if ligand binding to the C1b subdomain readily anchors the PKC to the inner leaflet of the plasma membrane, they are classified as activators. DAGs are natural ligands that bind to C1 domains of both mature conventional and novel PKC isozymes and translocate them to the plasma membrane, thus revealing the enzymatic active conformation of PKC [18]. In the current study, alkyl cinnamates were tested to determine if they could facilitate PKCα translocation from the cytosol to the plasma membrane. Previous immunofluorescence studies have been carried out to determine plasma membrane translocation phenomena of different PKC isozymes under the actions of various natural and synthetic agonists [192021]. Immunofluorescence studies have revealed that alkyl cinnamates have the potential to act as robust ligands that can translocate PKCα from the cytosol to the inner leaflet of the plasma membrane. This was confirmed in the more quantitative immunoblot assay, which requires separation of the membrane and cytosolic fractions of the cells. Membrane fractions of alkyl cinnamatetreated cells show a significant increase in PKCα signal compared to control samples.
Many natural and synthetic PKC agonists activate PKC isoforms via membrane translocation mechanism to induce cell death in different cancer cell lines [22]. In the current study, alkyl cinnamates were found to induce cell death in both ER-positive and triple-negative breast cancer cells. Therefore, it was interesting to explore the molecular mechanism of alkyl cinnamate action on breast cancer cells. Several novel DAG-lactones have been developed with a view to target apoptosis in cancer cells. These molecules were found to translocate PKCα to the plasma membrane and disrupt the cell cycle to initiate apoptosis [23]. Earlier studies have shown that PKC agonists, such as membrane lipids PIP2, as well as natural molecules such as bryostatins, indeed halt the cell cycle at the G2/M phase and caused decrement of cells in S phase [2324]. In this work, the cell cycle status strongly suggests that alkyl cinnamates caused significant decrement of cells in S phase.
Apoptosis is a complex mechanism involving many pathways. It is disrupted in many cancers with little apoptosis that results in the malignant properties of cancer cells [25]. Natural phytochemicals, such as curcumin, are known to be agonists for PKC and induce membrane translocation. Studies have suggested that curcumin induce apoptosis via the intrinsic mitochondrial pathway in many cancer cell lines such as human melanoma cell line. In this current study, we have investigated the possible involvement of the mitochondrial pathway of apoptosis mediated by alkyl cinnamates in breast cancer cells. We have found that alkyl cinnamate-treated cells showed a decrease in mitochondrial membrane potential, indicating loss of mitochondrial membrane integrity. Earlier studies have shown that activation of PKC enzymes is involved in the mitochondrial pathway of apoptosis and release of cyt c. Release of cyt c was induced in alkyl cinnamate-treated cells, whereas untreated cells showed a cyt c signal at distinct locations inside the cytosol. Recently, curcumin analogues have been synthesized, and their anticancer activity has revealed that induced apoptosis proceeds mainly via caspase-9 and caspase-3 activation through the intrinsic apoptotic pathway [2627]. Involvement of caspase-9 and caspase-3 in apoptosis induced by alkyl cinnamates was confirmed in this study.
Studies have revealed that the phytochemical curcumin plays differential roles in normal healthy cells and cancer cells with respect to generation of oxidative stress. Curcumin has been known as an oxidative stress inducer in many cancer cell lines, while being a protector of oxidative stress in many healthy cell lines [282930]. This current study has demonstrated that alkyl cinnamates predispose MDAMB-231 cancer cells towards apoptosis via generation of oxidative stress. Alkyl cinnamates exhibiting promising anticancer activity against aggressive breast cancer cell line strongly provide the impetus for researchers to further work and improve natural anticancer phytochemicals. Most phytochemicals show a benign nature towards normal cells but are cytotoxic to cancer cells. This selectivity is attributed to the differential molecular microenvironments in normal healthy cells versus cancer cells. In our case, this is highly likely to be due to the presence of higher PKC levels in cancer cells than in normal cells [4]. Such differential molecular aspects in normal versus cancer cells can be further explored in the development of novel classes of drugs that would selectively eliminate malignant cancer cells, thus promising highly successful anticancer therapeutics in the future.
 XML Download