

 PDF
PDF ePub
ePub Citation
 Print
Print


INTRODUCTION
Breast cancer is the most commonly diagnosed cancer in women worldwide, as well as among Iranian women [1]. Common cancer therapies have several adverse effects. Hence, immunotherapy, which improves the patient's own immune response, has been developed as an alternative to the traditional approaches [2]. Immunotherapy has the ability to attack microscopic disease and control metastasis, especially to locations that are surgically inaccessible. Reducing the side effects that are inevitable with radiation and chemotherapy as well as inducing long term control by suppressing the recurrence of tumors are some of the advantages of immunotherapy [3].
In order to obtain efficient clinical results from immunotherapy, the most effective immunotherapy agents should be combined with proper delivery strategies. Microorganism based delivery systems are one of the biological approaches. These systems are categorized into viral, bacterial, yeast, and parasite-based delivery systems [4]. In recent studies, nonpathogenic parasites including Leishmania tarentolae, Toxoplasma gondii, and Trypanosoma cruzi have been used as novel biological delivery systems for expression of heterologous genes [5]. In this study, L. tarentolae, a lizard parasite which is not pathogenic in humans and lacks the ability to persist long-term in mammalian macrophages [6], was used as a live delivery system for immunotherapy. L. tarentolae has the ability to induce T-cell proliferation and interferon γ (IFN-γ) production, subsequently eliciting a Th1 immune response [5]. Our group has previously shown that early expressed number 7 protein human papillomavirus before (HPV)-EGFP (E7-EGFP) expressing recombinant L. tarentolae induces a strong Th1 immune response in the tumor cell line tissue culture number one (TC-1) inoculated mice as HPV model [7].
Arginase is a key enzyme in the hepatic urea cycle, which catalyzes L-arginine to urea and L-ornithine. Recently, many researchers have shown a crucial role for arginase in tumor immunobiology [89] and emphasized its potential role in the promotion of tumor growth via polyamine synthesis or downregulation of nitric oxide (NO)-mediated tumor cytotoxicity. It has also been suggested that arginase plays a role in the immunosuppressive function of tumor-associated myeloid-derived suppressor cell (MDSC). MDSCs constitutively express arginase and therefore, deplete L-arginine. Consequently, T cell immune functions are suppressed. As arginase activity has been found to be elevated in many different cancers including breast, prostate, gastric, colorectal, and hepatocellular carcinoma, it can be used as a new prognostic biomarker in in vivo experiments [1011]. In this study, we aimed to determine the association of arginase activity in tumor tissues and sera with the tumor growth inhibition induced by different treatment strategies.
In the present study, 10 kDa interferon γ-induced protein (IP-10), a CXC chemokine, was used as an immunotherapeutic agent. This chemokine induces antitumor and antimetastatic activities in different ways including immunological and antiangiogenic mechanisms [12]. We used the murine estrogen-nonresponsive mammary carcinoma cells, named 4T1 cells, which multiply rapidly and cause metastatic tumors in BALB/c mice [13]. A comparison of the anti-breast-cancer effects of IP-10 was performed, when administered either using recombinant naked DNA or delivered via L. tarentolae system, in the 4T1 mouse tumor model. The level of arginase activity during different therapeutic strategies was evaluated to elucidate the association between tumor growth and arginase activity.
Go to : 
METHODS
Ethics statement
All mouse experiments including maintenance, animal handling, and blood sample collection were approved by the Institutional Animal Care and Research Advisory Committee of the Pasteur Institute of Iran (Document dated May 2014), based on the Specific National Ethical Guidelines for Biochemical Research issued in 2005 by the Research and Technology Deputy of the Ministry of Health and Medical Education (MOHME) of Iran.
Mice and cell lines
Female BALB/c mice, 8-week-old, were purchased from the Pasteur Institute of Iran and housed under standard conditions of diet and light in the animal facility. The 4T1 cell line (ATCC CRL-2539) was obtained from the Pasteur Institute of Iran (National Cell Bank of Iran). The 4T1 and COS-7 cells were cultured in RPMI-1640 medium (Sigma, St. Louis, USA) supplemented with 10% heat-inactivated fetal bovine serum (FBS; Gibco, Waltham, USA), 2 mM L-glutamine (Sigma) and 50 µg/mL gentamicin (Biosera, Boussens, France) in a humidified atmosphere with 5% CO2 at 37℃. Subculturing was carried out every 2 to 3 days. The cells were detached by using a solution containing 0.25% trypsin and 1 mM EDTA (Sigma).
Plasmid DNA construction
The plasmid pEGFP-N1-(IP-10) constructed in our previous study was digested [14] with EcoRI and KpnI (all the enzymes purchased from Roche, Basel, Switzerland), gel purified and sub-cloned into pEGFP-N3. After pEGFP-N3-(IP-10) confirmation by polymerase chain reaction (PCR) using IP-10 forward 5'-CCA AGT GCT GCC GTC ATT TT-3' and EGFP reverse 5'-GCTCTAGATTAGGTACCCTTGTACAGCTCGTC-3' primers and digestion with EcoRI/KpnI, the fused (IP-10-egfp) fragment was sub-cloned into BglII/NotI sites of the Leishmania expression vector pLEXSY-neo2 (Jena Bioscience, Hannover, Germany) for gene transfection. To construct pcDNA-(IP-10-egfp), pLEXSY.neo2-(IP-10-egfp) was digested with BglII/NotI and then cloned into the corresponding site of pcDNA 3.1+. The plasmid encoding (IP-10-egfp) was transformed into DH5α strain of Escherichia coli and then purified by the alkaline lysis method (Qiagen Plasmid Giga Kit, Dusseldorf, Germany).
Fluorescence microscopy and flow cytometry analysis
To confirm the expression of pcDNA-(IP-10-egfp) in mammalian cells, COS-7 cells were transfected with pcDNA-(IP-10-egfp) using Polyethylenimine/DNA (PEI/DNA) complexes, which were generated by mixing 10 µM linear PEI with 5 µg of each DNA (pcDNA-(IP-10-egfp), pEGFP-N3 or pcDNA-egfp as controls) according to the method described previously [15]. The level of EGFP expression in each construct was evaluated by fluorescence microscopy (E200; Nikon, Tokyo, Japan), flow cytometry (BD Biosciences, Franklin Lakes, USA; excitation and emission peaks at 490 nm and 530 nm), and Western blot 48 hours after transfection.
Western blot analysis
To examine the expression of IP-10-egfp protein, Western blot analysis was performed [16]. Promastigote forms of L. tarentolae-EGFP (~1×10⁵ parasites) were harvested by centrifugation at 3,000 rpm for 15 minutes and washed in phosphate buffered saline (PBS). pcDNA-(IP-10-egfp)- and pEGFP-(IP-10-egfp)-transfected COS-7 cells were trypsinized and harvested by pipetting gently. The pellets were immediately lysed in 2×sodium dodecyl sulfate polyacrylamide gel electrophoresis (SDS-PAGE) sample buffer (4.5 mM Tris-HCl, pH 6.8, 10% v/v glycerol, 2% w/v SDS, 5% v/v 2-mercaptoethanol, 0.05% w/v bromophenol blue) on ice and then boiled for 5 minutes. Cell lysates were separated on 17.5% SDS-PAGE gel and transferred onto Protran nitrocellulose transfer membrane (Schleicher and Schuell Bioscience, Dassel, Germany) using a wet blotting system (Bio-Rad, Hercules, USA). The membrane pre-equilibration was performed overnight using Tris-Buffered Saline with Tween-20 (TBST) solution (10 mM Tris-HCl, pH 7.4, 150 mM NaCl, and 0.1% Tween-20) containing 2.5% bovine serum albumin (BSA). The membrane was then washed three times with 0.1% Tween-20 in TBS. Subsequently, the membrane was incubated with monoclonal anti-EGFP-HRP Goat antibody diluted to a concentration of 1:6,000 (Acris Antibodies GmbH, Herford, Germany) for 2 hours. Finally, the target protein was visualized by developing the blot using 3, 3-diaminobenzidine tetrahydrochloride (DAB; Sigma) as a peroxidase substrate.
Quantitative real-time PCR analysis
Total RNA was extracted from the transfected COS-7 cells 3 days after transfection, using the RNeasy Qiagen kit according to the manufacturer's instructions. The quality of the RNA was assessed by spectrophotometric analysis using NanoDrop ND-1000. Then, 1 µg of total RNA of each sample was reverse transcribed to cDNA using the Omniscript RT kit (Qiagen). The QuantiNova SYBR Green PCR Kit was used to amplify the genes for IP-10 and glyceraldehyde-3-phosphate dehydrogenase (GAPDH) (normalization control for quantitative real-time PCR [qRT-PCR]). The following primers were used for qRT-PCR: IP-10 forward primer, IP-10 reverse primer 5'-AGG CTC GCA GGG ATG ATT TC-3'; GAPDH forward primer 5'-CGA GAG TCA GCC GCA TTT TC-3', GAPDH reverse primer 5'-GAT GAC GAG CTT CCC GTT CT-3'. The PCR conditions were as follows: initial denaturation at 95℃ for 1 minute, followed by 40 cycles consisting of denaturation at 95℃ for 15 seconds and annealing extension at 60℃ for 30 seconds. The absorbance value was measured at the extension stage. The 2-ΔΔCt method was applied to calculate the IP-10 mRNA relative expression level.
NO assay
Nitrite release in the culture supernatant of the transfected COS-7 cells was determined at 6, 24, 48, 72, and 96 hours after transfection. 100 µL of COS-7 culture supernatant was collected from each well and mixed with an equal volume of Griess reagent. Absorbance of colored complex was determined at 550 nm using a microplate reader. Nitrite concentration in samples was calculated based on the standard curve plotted for sodium nitrate serial dilution in culture medium. The amount of induced NO in the transfected COS-7 cells was calculated by subtracting, the amount of NO produced in untransfected COS-7 cells from total NO amount of different samples.
Parasite growth and transfections
The L. tarentolae Tar II (ATCC 30267) strain was grown at 26℃ in M199 medium (Sigma), pH 7.2, supplemented with 5% heat-inactivated FBS (Gibco), 40 mM hydroxyethyl piper-azineethanesulfonic acid (HEPES), 0.1 mM adenosine, 5 µg/mL hemin (all chemicals procured from Sigma), and 50 µg/mL gentamicin (Biosera). In order to perform homologous recombination of a cassette containing IP-10-egfp into the Leishmania chromosome, pLEXSY-neo-2-(IP-10-egfp) was linearized using SwaI. For transfection, 4×10⁷ log-phase parasites were washed and resuspended in 300 µL of electroporation buffer (21 mM HEPES, 137 mM NaCl, 5 mM KCl, 0.7 mM Na2HPO4, and 6 mM glucose; pH 7.5), and mixed with 50 µL H2O containing 15 µg of cassette containing IP-10-egfp. The mixture was stored on ice for 10 minutes, and then electroporated (Bio-Rad Gene PulserEcell) at 450 V and 500 µF as described previously [17]. G418 antibiotic (Sigma) was used for the selection of recombinant transfectants. In brief, the electroporated promastigotes were incubated for 24 hours in M199 10% medium at 26℃ without any selection drug and then plated on solid media (2% noble agar and 10% v/v 2×M199; Sigma) containing 50 µg/mL G418 (Gibco). The growth of G418-resistant cells was observed after 7 to 10 days. The selected clones were further propagated in liquid M199 medium containing 10% FBS, and in the absence of G418. The expression levels of EGFP in Leishmania promastigotes were evaluated by epi-fluorescence microscopy for up to 3 months (Nikon, E 200, ACT-1 software, Digital sight Camera).
Extraction of genomic DNA and PCR confirmation of IP-10-egfp gene integration
The genomic DNA of recombinant L. tarentolae strains was extracted by GF-1 genomic DNA extraction kit (Vivantis, Selangor DE, Malaysia). Integration of the expression cassette into the ssu locus was confirmed by diagnostic PCR using ssu forward primer (F3001, 5'-GATCTGGTTGATTCTGCCAGTAG-3') and apart reverse primer (A1715, 5'-TATTCGTTGTCAGATGGCGCAC-3'). The PCR conditions were as follows: 95℃ for 5 minutes, 60℃ for 2 minutes, 72℃ for 3 min-utes, followed by 30 cycles of 94℃ for 1 minute, 60℃ for 1 minute and 72℃ for 15 minutes, and finally, 1 cycle of 72℃ for 15 minutes according to the pLEXSY Kit protocol (Jena Bioscience).
The presence of IP-10-egfp fusion was confirmed by PCR analysis using IP-10 forward primer (5'-CAGAATTCATCAGCACCATGAACCCAA-3') including EcoRI restriction site (underlined), and EGFP reverse primer (5'-GCTCTAG-ATTAGGTACCCTTGTACAGCTCGTC-3') including EcoRI and XbaI site (underlined), respectively. The PCR was carried out under the following conditions: 95℃ for 2 minutes (initial denaturation); 58℃ for 1 minute, 72℃ for 3 minutes, 95℃ for 30 seconds, 58℃ for 30 seconds (annealing); 72℃ for 1 minute (extension), for a total of 30 cycles.
PCR for amplification of egfp fragment was carried out using EGFP forward primer (5'-ATGATATCAAGATCTATGGTGAGCAAGGGC-3'), (BglII restriction site indicated in bold) and EGFP reverse primer. The reaction mixture was incubated at 94℃ for 5 minutes, followed by 30 cycles consisting of 1 minute at 94℃, 2 minutes at 62℃, 1 minute at 72℃, and a final extension of 10 minutes at 72℃. The gene amplification was done as described earlier [17].
RNA extraction and reverse transcription PCR
RNA was extracted from the recombinant promastigotes and used for cDNA synthesis. To detect the presence of egfp and IP-10-egfp, PCR was performed using transgenic cDNA as template and EGFPF/EGFPR and IP-10F/EGFPR primer pairs, respectively.
Immunization schedules
Mice were divided into five groups of 10 female BALB/c, and 1×10⁵ 4T1 cells/100 µL PBS were injected subcutaneously in the fourth mammary gland. The mice then received 50 µg of pcDNA-(IP-10-egfp) (G1), 2×10⁷ parasite/50 µL PBS L. tarentolae-(IP-10-EGFP) (G2) and L. tarentolae–EGFP (G3), 50 µg of pcDNA-egfp (G4), and PBS (G5), twice a week for 3 weeks. All groups were injected intratumorally. Blood samples were collected from 4 mice before 4T1 injection (N, normal), 3 days after 4T1 injection (G0, 4T1), and 23 days after 4T1 injection (G1–G5). The smallest (a) and the biggest (b) diameters of the tumors were measured using caliper, twice a week. The tumor volume was calculated using a previously described formula: V=(a2 ·b)/2 [14].
Histopathological studies
Lung tissues of 4 mice from each group were collected at day 28 and fixed in Bouin's fixative for 24 hours. After standard processing and embedding in paraffin blocks, the tissues were sliced into 3-micron sections from each paraffin block and mounted on slides. Hematoxylin and eosin (H&E) staining was carried out for histological examination. The stained slides were examined under a Nikon eclipse E200 microscope and photographed using a Nikon DS-Fi1 camera. The slides were assessed for the presence of alveolar edema, hemorrhage, and metastatic areas by a pathologist who was not aware of the treatment schedule of the different groups.
Sample preparation for arginase assay
The tumor samples were obtained from sacrificed mice, 28 days after 4T1 inoculation. The samples were homogenized in a 1.5 mL vial containing phosphate-buffered saline 1× (PBS 1×) using a plastic homogenizer. The homogenates were centrifuged at 1,600 rpm for 5 minutes (Eppendorf, Hamburg, Germany) at 4℃. The supernatants were centrifuged at 14,000 rpm for 10 minutes at 4℃ and stored at -70℃ until further use for arginase activity measurement. Serum was separated from blood and kept at -70℃ prior to the measurement of arginase activity. The sera samples for determination of arginase activity were also collected from mice before injection of 4T1 (N, normal sera), 3 days after injection of 4T1, before starting treatments (G0, 4T1), and 23 days after treatments (G1–G5).
Determination of arginase activity
The protein content of each tumor sample (25 µL) was measured by BCA protein assay (Thermo Scientific Pierce Chemical Co., Waltham, USA) using serially diluted BSA as the standard. The enzymatic activity of arginase in the tumor was determined as described previously [18]. The tumor extract (25 µL) was lysed using lysis buffer (0.1% triton X-100, 10 mM MnCl2, and 50 mM Tris-HCl, pH 7.5) and activated by heating at 56℃ for 10 minutes. Then 25 µL arginine was added and the mixture was incubated at 37℃ for 1 hour to allow complete arginine hydrolysis. The assay was stopped by the addition of 400 µL acid mixture containing H2SO4, H3PO4, and H2O (1:3:7 v/v). Then 20 µL of 6% isonitrosopropiophenone (ISPF; Sigma), dissolved in absolute ethanol, was added and the samples were incubated at 100℃ for 45 minutes. The absorbance of the urea formed was measured at 540 nm using a spectrophotometer (Power Wave XS; Bio-Tek, Winooski, USA). One unit of enzyme activity is defined as the amount of enzyme that catalyzes the formation of 1 µmol of urea per mg of protein. For sera samples, the urea concentrations were determined without performing the activation and hydrolysis steps.
Statistical analysis
Statistical analysis was performed using Graph-Pad Prism 5.0 for Windows (Graph-Pad Prism, San Diego, USA). One-way ANOVA was performed to analyze the arginase assay in tumor and sera, and for analyzing the tumor weight and spleen weight in different groups. All p-values less than 0.05 were considered statistically significant. Data were demon-strated as mean±standard deviation.
Go to :
RESULTS
Construction of recombinant L. tarentolae expressing IP-10-EGFP
The linearized pLEXSY-(IP-10-egfp) was introduced into 18S rRNA ssu locus of L. tarentolae by electroporation (Figure 1A). Successful insertion of IP-10-egfp into the L. tarentolae genome was further verified by performing PCR using L. tarentolae genome as template and L. tarentolae-EGFP genome as a control, and visualizing the PCR products of expected size. The integration of IP-10-egfp expression cassette into the ssu locus was confirmed by PCR analysis using genomic recombinant L. tarentolae as template that yielded a 1 kb fragment (Figure 1B). Furthermore, obtaining the PCR products of expected size, using L. tarentolae-(IP-10-EGFP) cDNA and the specific primers, confirmed the expression of IP-10-EGFP fusion gene in transgenic L. tarentolae (Figure 1C). As shown in Figure 1D, EGFP expression in G418-resistant transgenic L. tarentolae was confirmed by fluorescence microscopy.
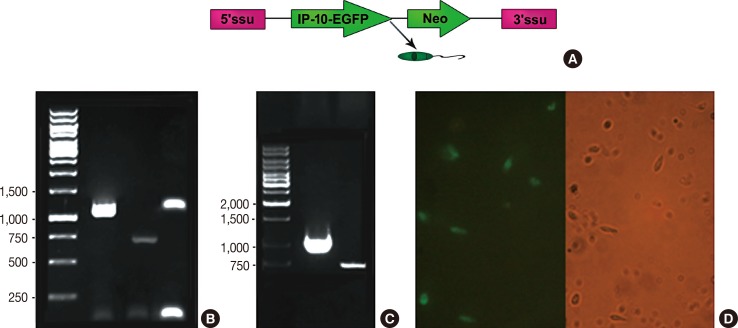 | Figure 1Interferon γ-induced protein 10-enhanced green fluorescent protein (IP-10-EGFP) integration and expression in Leishmania tarentolae strain. (A) Schematic presentation of egfp gene into ssu ribosomal DNA lucus. (B) Polymerase chain reaction (PCR) results using L. tarentolae genomic DNA as template. Columns 1 and 2 demonstrate the IP-10-EGFP and EGFP amplification, respectively. Column 3 is the PCR amplification of the integrated fragment using integration primers (F3001 and A1715) primers. (C) Confirmation of IP-10-EGFP expression in mRNA level. Amplification of IP-10-EGFP and EGFP fragments were demonstrated in column 1 and 2 using recombinant L. tarentolae cDNA as template, respectively. (D) Fluorescence microscopic images of recombinant L. tarentolae stably expressing (IP-10-EGFP) 48 hours postinfection; both bright field and fluorescence (left) are shown.
|
In vitro expression of IP-10 EGFP in COS-7 transfected cells
To analyze and confirm the in vitro expression of IP-10 under the control of a cytomegalovirus (CMV) promoter in eukaryotic cells, COS-7 cells were transfected with pcDNA-(IP-10-egfp) and pEGFP-(IP-10) constructs and then exam-ined using fluorescence microscopy as well as fluorescence-activated cell sorting (FACS) (Figure 2A, B). The transfection efficacies of pcDNA-(IP-10-egfp) and pEGFP-(IP-10) were almost similar with regard to EGFP-positive cell percentage as detected by flow cytometry (Figure 2B). However, the mean fluorescent intensities of COS-7 cells transfected with pcDNA-(IP-10-egfp) (17.6%) and pEGFP-(IP-10) (19.2%) were lower compared to the pEGFP-transfected COS-7 cells. This reduction might have possibly occurred due to the presence of IP-10 along with the egfp gene.
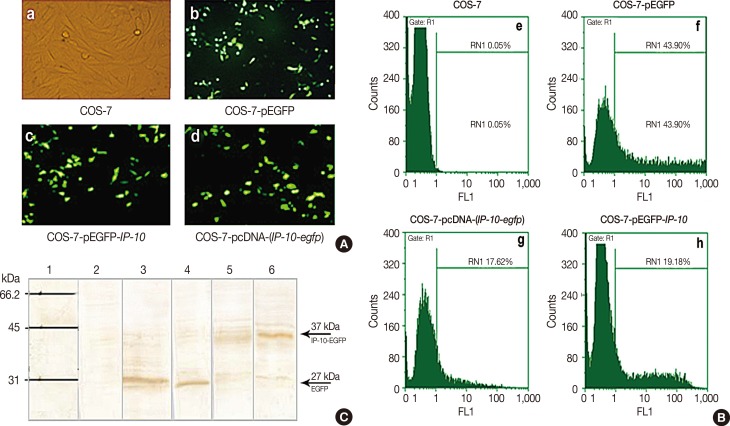 | Figure 2Confirmation of interferon γ-induced protein 10 (IP-10) expression in COS-7 transfected cells. (A) GFP expression was assessed by fluorescence microscopy after 48 hours. (a) Untreated COS-7, (b) COS-7 treated with pEGFP, (c) COS-7 treated with pEGFP-(IP-10), and (d) COS-7 treated with pcDNA-(IP-10-egfp). (B) GFP positive percentage of transfected parasite by flowcytometer after 48 hours. (e) Untreated COS-7, (f) COS-7 treated with pEGFP, (g) COS-7 treated with pcDNA-(IP-10-egfp), and (h) COS-7 treated with pEGP-IP-10. (C) Western blot analysis using anti-GFP antibody. Column 1 and 2 show marker and untreated COS-7 as negative control, respectively. The ~27 kDa band determines the GFP protein expression in Leishmania tarentolae-EGFP as positive control (column 3) and pEGFP-transfected COS-7 cells (column 4). IP-10-EGFP expression was confirmed by detecting ~37 kDa in pcDNA-(IP-10-egfp) (column 5) and pEGFP-(IP-10-EGFP) treated COS-7 cells (column 6).GFP=green fluorescent protein; EGFP=enhanced green fluorescent protein; R1=COS-7 cells; RN1=GFP positive COS-7; FL1=fluorescein isothiocyanate (FITC) detector.
|
Identification and verification of IP-10 protein
For evaluating the expression levels of IP-10-EGFP protein, western blot analysis was performed using anti-EGFP antibody. The expected band at approximately 27 kDa (Figure 2C) was detected in both L. tarentolae-EGFP and pEGFP-transfected COS-7 cell lysate; however, no specific band was observed in the nontransfected COS-7 cells (negative control). As the molecular weights of IP-10 and EGFP are 10 kDa and 27 kDa, respectively, the expressed IP-10-EGFP has a molecular weight of approximately 37 kDa (Figure 2C) as detected in COS-7 cell lysate transfected with pEGFP-(IP-10) and pcDNA-(IP-10-egfp). These results demonstrated the expression of IP-10-egfp integrated into the 18S rRNA locus of transgenic L. tarentolae.
Quantification of IP-10 expression in pcDNA-(IP-10-egfp)-transfected COS-7 cells
The 2-ΔΔ CT method was applied to quantify the IP-10 expression in the pcDNA-(IP-10-egfp)-transfected COS-7 cells relative to the pcDNA-egfp transfected COS-7 cells. IP-10 expression was significantly increased (18-fold) in the pcDNA-(IP-10-egfp)-transfected COS-7 cells as compared with the pcDNA-egfp-transfected COS-7 cells, 72 hours after transfection (Figure 3).
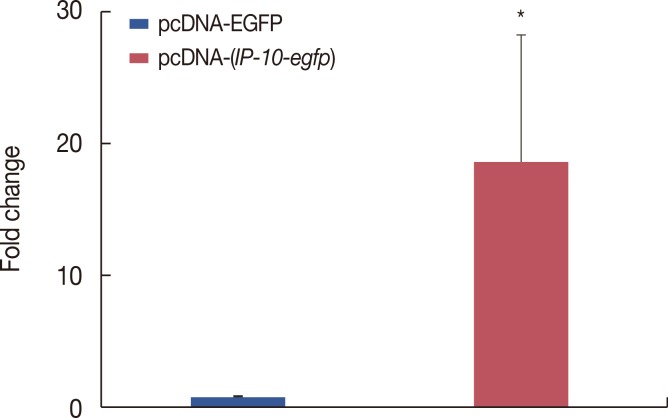 | Figure 3Quantitative real-time polymerase chain reaction (qRT-PCR) analysis of interferon γ-induced protein 10 (IP-10) expression in pcDNA-(IP-10-egfp)-transfected COS-7 cells. qRT-PCR were performed 72 hours after transfection of pcDNA-egfp and pcDNA-(IP-10-egfp) into COS-7 cells. Data are presented as mean±SD (n=4).EGFP=enhanced green fluorescent protein.
*p<0.05.
|
NO induction in pcDNA-(IP-10-egfp)-transfected COS-7 cells
Higher amounts of NO were produced in the pcDNA-(IP-10-egfp)-transfected COS-7 cells compared with that in the pcDNA-egfp-transfected COS-7 cells at all time points (Figure 4). The levels of NO were significantly high at 72 hours after transfection (p<0.05).
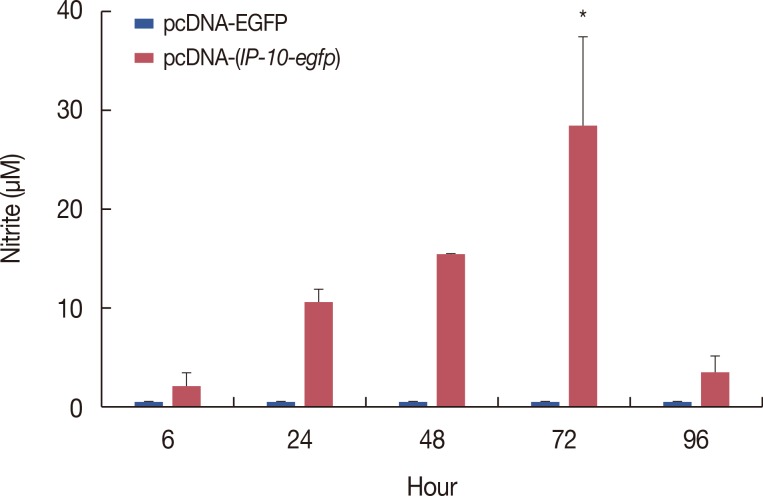 | Figure 4Effect of interferon γ-induced protein 10 (IP-10) on nitric oxide production. The supernatant of pcDNA-egfp and pcDNA-(IP-10-egfp)-transfected COS-7 cells were collected 6, 24, 48, 72, and 96 hours after transfection. Nitrate in the supernatant were measured with Griess reaction. Data are presented as mean±SD (n=4).EGFP=enhanced green fluorescent protein.
*p<0.05.
|
Effect of pcDNA-(IP-10-egfp) on tumor growth, tumor weight, and spleen weight
Mice were sacrificed 28 days after 4T1 inoculation and the weight of isolated tumors and spleens was determined at the time of sacrifice (Figure 5A). The efficacy of the various immunotherapy regimens in eliciting therapeutic responses against 4T1 was evaluated by measuring the tumor size (Figure 5B). Twenty-eight days after 4T1 inoculation, four mice from each group (G1–G5) were sacrificed, and tumors and spleens were collected and weighed. As shown in Figure 5B, there is a significant difference in the tumor growth between the pcDNA-(IP-10-egfp) (G1) and PBS groups (p<0.01), 17 days after 4T1 inoculation. The average tumor volume in the PBS group was approximately 498.7 mm3, in contrast to the tumor volume in the pcDNA-(IP-10-egfp) treated mice, which was only 92.8 mm3. The ability of IP-10 encoding DNA plasmid to reduce tumor growth was further confirmed by the significant difference observed in the tumor weight between the pcDNA-(IP-10-egfp) (G1) and PBS groups, 28 days after 4T1 injection. Furthermore, the tumor weight in L. tarentolae-(IP-10-EGFP)-immunized mice (G3) was significantly decreased in comparison to the PBS group (p<0.05) (Figure 5C).
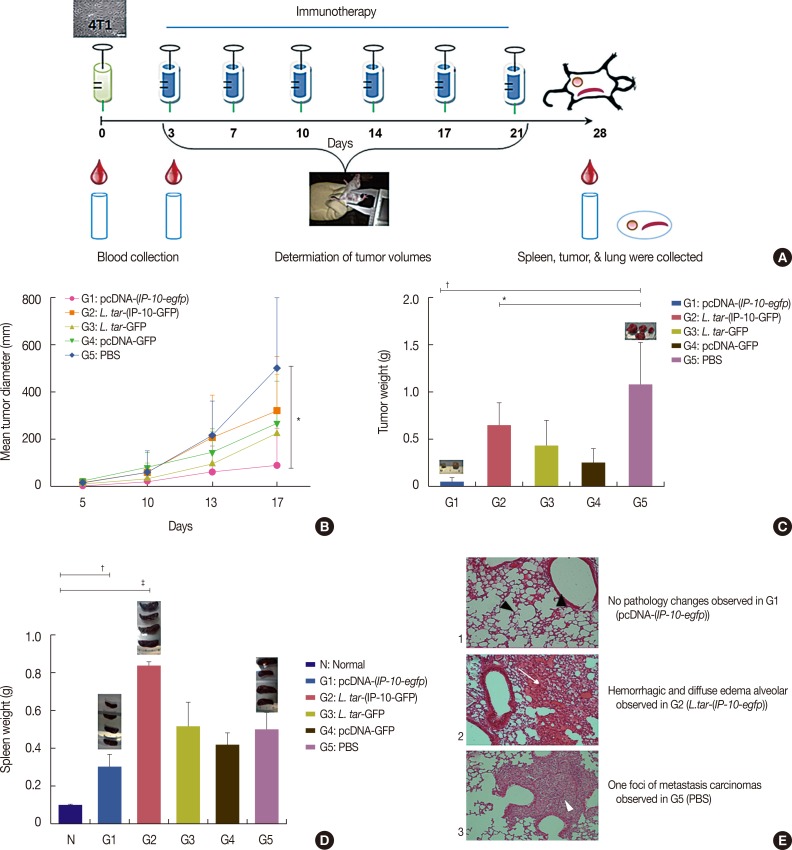 | Figure 5The effect of different therapeutic strategy on 4T1 tumor growth, spleen growth and lung histological sections. (A) Schematic representation of the immunotherapy schedule. BALB/c mice (n=10) were injected subcutaneously with 1×10⁵ 4T1 cells. Different immunization regimes were given intratumorally twice a week for 3 weeks. (B) Tumor volumes were determined two times per week. (C) Tumors were sectioned at day 28 and weight was measured among the five groups. (D) Spleens also were sectioned and weighted. Data are presented as mean±SD (n=4). (E) At day 28 lungs were removed, sectioned and stained with H&E. (1) Normal alveolar cavity with normal respiratory bronchioles (black arrowhead) and no significant pathologic changes in pcDNA-(IP-10-egfp) (G1). Alveolar septa have normal thickness with no congestion, edema or inflammation. (2) Hemorrhagic lung tissue in L. tarentolae-(IP-10-GFP) (G3) with diffused alveolar edema fluid in alveolar spaces (arrow). Alveolar septa show congestion. (3) One foci of metastatic carcinoma cells in field (white arrowhead) in G5. Arrow head shows sheet of metastatic carcinoma which encircle a respiratory bronchiole. The tumoral cells have high nuclear/cytoplasmic ratio, vascular pleomorphic nuclei and prominent nucleoli (H&E stain, ×100).IP-10-GFP=interferon γ-induced protein 10-green fluorescent protein; L. tar=Leishmania tarentolae; PBS=phosphate buffered saline.
*p<0.05; †p<0.001; ‡p<0.0001.
|
Regarding the spleen weight, the pcDNA-(IP-10-egfp) group demonstrated the best treatment results. The pcDNA-(IP-10-egfp)-immunized mice showed a significant difference in the spleen weight compared with L. tarentolae-(IP-10-EGFP) group (p<0.01) (Figure 5D). These results suggested that pcDNA-(IP-10-egfp) has the ability to effectively protect mice from metastasis of breast cancer to spleen.
Histopathological studies in mice
Four mice from all groups were sacrificed at day 28 to collect the lung tissues for histopathological analysis. Normal alveolar spaces and bronchioles were seen in the lung tissue of the pcDNA-(IP-10-egfp) group (G1) as displayed in Figure 5E. In contrast, L. tarentolae-(IP-10-egfp) immunotherapy (G3) caused diffused alveolar edema, hemorrhage, and congestion of alveolar septae. In the PBS group (Figure 5E), foci of metastatic carcinoma in the lung tissue and a sheet of metastatic breast cancer cells encircling a respiratory bronchiole were observed.
Levels of arginase activity in isolated tumors and sera
We found that the arginase activity in the sera samples of the pcDNA-(IP-10-egfp) group was similar to the normal sera (Figure 6A). The mice injected with pcDNA-egfp also had the same level of arginase activity as the pcDNA-(IP-10-egfp) group. L. tarentolae-(IP-10-EGFP), L. tarentolae-EGFP and PBS groups also showed similar levels of arginase activity with no significant differences observed between the groups (Figure 6A).
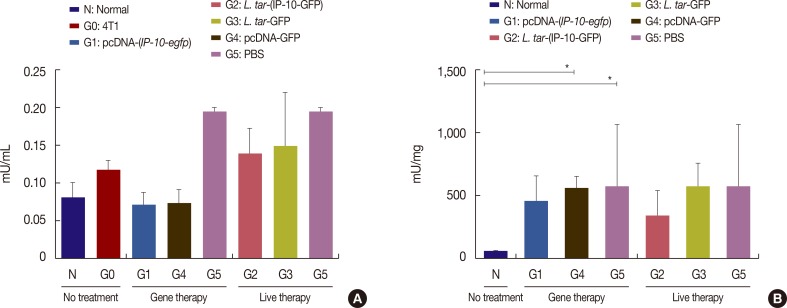 | Figure 6Arginase activity in tumor tissues and sera. Different immunization regimens were given to BALB/c mice (n=10) twice a week for 3 weeks, 3 days after 4T1 injection. (A) Arginase activity of different groups was measured in sera samples before 4T1 injection (N, normal), 3 days after injection 4T1 (G0, 4T1) and 23 days after injection of 4T1 (G1–G5). (B) Arginase activity in different groups was determined in tumor tissues 28 days after 4T1 injection. Data are representative of mean±SD (n=4).IP-10-GFP=interferon γ-induced protein 10-green fluorescent protein; L. tar=Leishmania tarentolae; PBS=phosphate buffered saline.
*p<0.05.
|
The level of arginase activity in the tumor samples of the mice was investigated 28 days after 4T1 inoculation. As shown in Figure 6B, there was significantly higher arginase activity in tumor samples compared to normal tissue (G4 and G5 vs. normal mice, p<0.05). However, no significant difference was observed among the tumor samples from each group. Therefore, the level of arginase activity could be used to differentiate between tumor tissue and normal tissue.
Go to :
DISCUSSION
The objective of this study was to construct a recombinant L. tarentolae strain stably expressing IP-10, and to evaluate its potential as a candidate live vaccine against 4T1-induced breast cancer. We employed the arginase assay as a biomarker to identify the more efficient therapeutic strategy., The application of L. tarentolae as a live vector to deliver therapeutic agent in breast cancer model was reported for the first time in this study.
For generating recombinant L. tarentolae, the pLEXSY-neo2 system was used to integrate the IP-10 encoding plasmid into the parasite genome. IP-10 integration into L. tarentolae and subsequent expression was confirmed by different methods including PCR, fluorescence imaging, FACS and western blot analysis. In this study, two immunotherapeutic approaches including L. tarentolae live delivery system and naked DNA plasmid were compared for the treatment of the 4T1-implanted BALB/c mice with IP-10-EGFP.
To confirm the expression of IP-10 in eukaryotic cells, qRT-PCR analysis and NO assay were performed in the pcDNA-(IP-10-egfp)-transfected COS-7 cells. Gupta et al. [19] have previously reported that the protective effect of IP-10 is mediated by the induction of inducible NO synthase 2 and subsequent production of NO. In this study, the NO induction in pcDNA-(IP-10-egfp)-transfected COS-7 cells revealed the functional expression of IP-10 that mediated the protective effect.
This study demonstrated that IP-10 is a promising candidate for the treatment of breast cancer, as evident from the experiments carried out in the in 4T1 mouse tumor model. This observation is supported by the results of Yang et al. [20], who demonstrated that IP-10 has the ability to chemo-attract tumor-specific T-cells to the tumor site and also to promote the proliferation of these recruited T-cells leading to tumor regression in mice harboring 4T1 cells. Our results demonstrated that pcDNA-(IP-10-egfp) can inhibit tumor growth as well as tumor metastasis to spleen in 4T1-implanted mice when compared to the L. tarentolae-(IP-10-EGFP) and control groups. Xanthopoulos et al. [21] mentioned that spleen size is a good marker for indicating the degrees of 4T1 metastasis to spleen in treated mice. The histological examination of the lungs demonstrated that pcDNA-(IP-10-egfp) has the ability to reduce lung metastasis. Similar results have been reported for melanoma and ovarian cancer [22].
Different delivery systems such as cationic liposomes [23], have been used in different studies to transfer IP-10 gene to the target organs. In this study, a live vector was used for IP-10 delivery. Such a system has several advantages including low cost of preparation, strong immune stimulation, and is well-tolerated in human [5]. L. tarentolae is a nonpathogenic parasite, which lives for 2 to 3 days in mammalian cells. It can activate the dendritic cell maturation process, induce T-cell proliferation, and the production of gamma-interferon, thus leading CD4+ T-cells to develop a Th1 phenotype [24]. Therefore, we assumed that L. tarentolae has the ability to deliver our therapeutic candidate to tumor cells. It was found that L. tarentolae like Listeria is eliminated by the immune system after 3 to 4 days in normal tissues [25]. Therefore, to establish a longer presence of L. tarentolae-(IP-10-EGFP) in tumor cells frequent intratumoral injections of L. tarentolae-(IP-10-EGFP) (six times in 3 weeks) was administered. Surprisingly, L. tarentolae-(IP-10-EGFP) treated mice showed higher tumor weight, tumor growth, and spleen weight (even higher than PBS group) and higher arginase activity in sera in comparison with the group immunized with pcDNA-(IP-10-egfp). However, our group has shown that a single intraperitoneal injection of recombinant L. tarentolae expressing A2 induced high levels of IFN-γ against visceral leishmaniasis in a preventive approach [26]. In another study conducted for preventive approach, all groups were challenged 3 weeks after the booster dose [7]. Breton et al. [6] similarly utilized the single immunization regimen with recombinant L. tarentolae, followed by infective HIV-1 challenge at a later time-point. As far as we know, this study is the first to report the use of L. tarentolae in a therapeutic approach. Consistent with our results, Chandra et al. [25] demonstrated that Listeria has little effect on primary tumors (tumor weight) in semi-therapeutic approaches. However, these live bacteria, when used in an optimized protocol, have the ability to reduce the number of metastases. A regimen comprising 5 immunizations with a lower dose of bacteria (1×10⁴) on alternate days was more effective against the metastases than 3 higher doses (0.5×10⁷) administered once a week. Overall, it can be surmised that the ineffectiveness of L. tarentolae in our study might be due to the inability of the mouse immune system to kill all tumor cells in the primary tumors after six injections of L. tarentolae-(IP-10-EGFP).
In recent years, increasing attention has been focused on arginase as a potential therapeutic target. It has been shown that these isoenzymes are overexpressed in multiple distant organs and tissues of patients [27]. Furthermore, several cancer studies have shown the crucial role of arginase in tumor immunobiology [10]. Meanwhile, there are some studies that have reported higher levels of arginase and polyamines (arginase products) in the sera and tissues of breast cancer patients [28]. Increased arginase activity probably causes damage to the host's immune response [29]. In our study, the arginase activity in the tissues of normal mice was significantly lower than in the therapeutic and control groups (Figure 6B). L. tarentolae-(IP-10-EGFP) group had the lowest arginase activity but did not show any significant differences when compared to other groups. Overall, it can be concluded that arginase activity in tumor tissues cannot differentiate between the efficacies of different therapeutic regimens. However, the sterol fraction of Porphyra dentata caused a significant decrease in the arginase activity in MDSCs in 4T1 tumor-cell-engrafted mice in vivo [30]. Herein, it was revealed that determination of arginase activity in tumor tissues without MDSCs sorting is not effective in discriminating between different therapeutic strategies.
Our results indicate that IP-10 is a promising candidate for treatment of breast cancer, as demonstrated in the 4T1-implanted BALB/c mouse tumor model. However, dose modifications are required for the L. tarentolae-(IP-10-EGFP) live delivery system to be effective in the regimen used in this study (six injections in 3 weeks). Furthermore, to improve the efficacy of L. tarentolae-based cancer immunotherapy, addition of tumor associated antigens or agents that reduce immune suppression is strongly suggested. We found that the arginase assay in tumor tissues can be a good biomarker for distinguishing tumor tissues from the normal ones. To successfully distinguish treated samples from the untreated ones, determining arginase activity in MDSCs is highly recommended.
Go to :
 XML Download