

 PDF
PDF ePub
ePub Citation
 Print
Print


INTRODUCTION
Recently, immune checkpoint blockades targeting programmed death receptor 1 (PD-1) and PD-l ligand 1 (PD-L1, B7-H1) have shown promising therapeutic efficacy in several tumor types, particularly highly immunogenic tumors, such as non-small cell lung cancer (NSCLC), malignant melanoma, and renal cell carcinoma (RCC) [1]. PD-1 is a member of the immunoglobulin superfamily first reported in 1992, and is expressed on activated T cells, B cells, natural killer cells, and myeloid cells [2]. PD-1 conveys an inhibitory signal to T cells and thus impedes immune responses [3]. PD-1 and its ligand, PD-L1, interact to downregulate the activation of T cells in autoimmune disease, chronic infection, and cancer. PD-L1 is expressed on activated T cells, B cells, macrophages, dendritic cells, and mesenchymal stem cells, as well as various tumor cells. Of note, expression of PD-L1 has been discovered in many epithelial cancers including NSCLC [456], malignant melanoma [7], colorectal carcinoma [8], gastric cancer [9], oral squamous cell carcinoma [10], RCC [11], and breast cancer [12131415]. Although the predictive markers for PD-1 inhibitors (nivolumab and pembrolizumab) and PD-L1 inhibitors (MPDL3280A and MEDI4736) remain unclear, a few studies have demonstrated that responsiveness and clinical outcome are superior in patients with PD-L1-positive tumors detected using immunohistochemistry (IHC) [15].
Although breast cancer is one of the less immunogenic tumors, triple-negative breast cancers (TNBCs) and human epidermal growth factor receptor 2 (HER2)-positive breast cancers are thought to be more immunogenic than luminal A cancers, as evidenced by the tumor-infiltrating lymphocyte (TIL) composition within the tumor microenvironment [16]. In breast cancer, the reported frequency of PD-L1 expression by carcinoma cells varies considerably between studies (1.7%–58%) [1217181920]. Moreover, conflicting results have been published regarding the prognostic effect of PD-L1 expression in breast cancer [12142021]. Considering the clinical applications of the PD-1/PD-L1 axis, analysis of PD-L1 expression and its prognostic role may have important implications for breast cancer treatment. Thus, we investigated the clinicopathological and prognostic significance of PD-L1 expression in patients with invasive breast cancer using IHC, with a particular emphasis on intrinsic subtype.
METHODS
Patients
We used a tissue microarray (TMA) encompassing 520 breast cancer tissue punches from formalin-fixed and paraffin-embedded tumors collected from patients diagnosed with primary breast cancer between 2001 and 2013 at Soonchunhyang University Cheonan Hospital. Of these 520 tissue punches, 465 were evaluable for this study. The tissue samples were brought into a TMA format as previously described [22]. Briefly, 2-mm tissue cylinders were punched out of donor tumor tissue blocks and transferred into a recipient paraffin block using a manual TMA device (SuperBioChips Laboratories, Seoul, Korea). Histopathological data was obtained from the pathology reports. Hematoxylin and eosin (H&E)-stained slides were reviewed by two pathologists (H.D.C. and H.J.L.). Tumor specimens were histopathologically diagnosed as invasive ductal carcinoma (IDC) (n=423), invasive lobular carcinoma (ILC) (n=20), mucinous carcinoma (n=10), metaplastic carcinoma (n=5), medullary carcinoma (n=3), mixed IDC and ILC (n=1), mixed IDC and mucinous carcinoma (n=1), adenoid cystic carcinoma (n=1), and neuroendocrine carcinoma, poorly differentiated (n=1). The scoring of TILs (defined as the percentage of stroma of invasive carcinoma infiltrated by lymphocytes and plasma cells in 10% increments) was performed in all available H&E-stained full sections [23]. TIL scores were classified into two groups, with a cutoff score of ≥40% (0%–30%, low expression; 40%–100%, high expression), using a modified Schalper's scoring method [21]. Areas in which there was discordance in TIL categorization between pathologists were reviewed jointly and a single consensus category was established. Clinicopathological information, including patient age at initial diagnosis, tumor size, histological tumor grade, histological type, TNM stage, date of surgery, date of last follow-up, and date of recurrence or death, was collected retrospectively from the electronic medical records. This study was approved by the Institutional Review Board at Soonchunhyang University Cheonan Hospital (SCHCA 2016-05-017).
Immunohistochemistry
Using 4-µm thick TMA tissue sections, IHC for PD-L1 was performed. Sections were subjected to antigen retrieval using a Bond-Max automated immunostainer (Leica Microsystems, Bannockburn, USA). Primary antibody binding was detected with the Bond Polymer Refine Detection Kit (Leica Microsystems), according to the manufacturer's instructions. Primary PD-L1 rabbit monoclonal antibody (clone E1L3N; Cell Signaling Technology, Beverly, USA) was used at a dilution of 1:100. Two independent observers (H.D.C. and H.J.L.) examined the slides in a blinded manner, and consensus was reached by repeated examination when results were discordant. Since PD-L1 is expressed on the cell membrane as well as the endomembrane system, membranous as well as cytoplasmic staining was considered positive. The histochemical score (H-score) was used to assess the intensity of staining and the percentage of stained cells. Staining intensity was scored as negative (score=0), weak (score=1), moderate (score=2), or strong (score=3). The percentage of positive cells at each intensity was subjectively estimated to produce a final score in the range of 0 to 300, by multiplying each score. PD-L1 expression was categorized into two groups according to the frequency distributions of the H-scores, using a cutoff score of ≥100 (H-score 0–99, low expression; 100–300, high expression), using a modified Muenst's scoring method [12].
The expression levels of standard biomarkers, including estrogen receptor (ER; 1:50), progesterone receptor (PR; 1:50), HER2 (1:200), Ki-67 (1:800), cytokeratin 5/6 (CK5/6; 1:50), epidermal growth factor receptor (EGFR; 1:100), and p53 (1:1,200) were available in all samples. The staining intensity of ER, PR, and HER2 was scored as described previously [22].
Statistical analyses
SPSS version 19.0 software (IBM Corp., Armonk, USA) was used. Pearson chi-square test (or Fisher exact test when the number of cases in a category was <10) was used to analyze categorical data between PD-L1 high and low expression. Disease-free survival (DFS) and overall survival (OS) on the basis of expression of PD-L1 were assessed by the Kaplan-Meier method with the log-rank test. Survivors were censored at the date of last contact. Multivariate survival analysis using the Cox proportional hazards regression model was performed to adjust for variables that may have been statistically significant for prognosis in univariate analysis. Significance was defined as p<0.05.
RESULTS
Patient characteristics and PD-L1 immunoreactivity
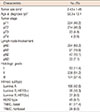
Demographic information of the patients is provided in Table 1. This study included 459 women (98.7%) and six men (1.3%). The mean age was 52.3 years (standard deviation, 12.4; range, 24–81 years). The mean tumor size was 2.43±1.46 cm (range, 0.3–12 cm). Primary tumor size data were calculated for the 465 patients. From this analysis, 224 patients (48.2%) were found to have pT1 tumors, 214 patients (46.0%) had pT2 tumors, 23 patients (4.9%) had pT3 tumors, and four patients (0.9%) had pT4 tumors. Among the 465 patients, lymph node metastasis was detected in 171 patients (36.8%). Of the 465 samples, 53 were histological grade 1 (11.4%), 238 were histological grade 2 (51.2%), and 174 were histological grade 3 (37.4%). The tumors from the 465 patients were classified, applying the TNM classification system, as stage I (n=165, 35.5%), stage II (n=213, 45.8%), and stage III (n=87, 18.7%). The proportions of patient tumors positive for ER and PR expression were 66.9% and 35.5%, respectively. Analysis for HER2 expression revealed that 17.7% of all patient tumors were positive. High Ki-67 expression was noted in 44.9% of tumors. Positive CK5/6 expression levels were found in 9.7%. Positive EGFR expression levels were found in 21.1% of tumors, while 17.8% of patient tumors were positive for p53 expression.
Membranous as well as cytoplasmic expression of PD-L1 protein was observed in breast tumor cells (Figure 1). For statistical analyses, the cases were subdivided into a PD-L1-high expression group (n=63, 13.5%) and a PD-L1-low expression group (n=402, 86.5%).
Correlations between PD-L1 expression and clinicopathologic parameters
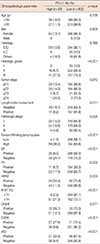
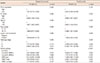
High PD-L1 expression was significantly associated with high histologic grade (p<0.001), negative lymph node metastasis (p=0.011), early pathologic stage (p=0.025), and high TIL counts (p<0.001) (Table 2). The expression of PD-L1 was negatively associated with ER (p<0.001) and PR (p=0.002) expression, and positively associated with HER2 expression (p=0.003), Ki-67 staining index (p<0.001), CK5/6 expression (p=0.011), EGFR expression (p<0.001), and p53 expression (p<0.001) (Table 2). There was no significant association between PD-L1 and age (p=0.139), sex (p=0.605), histology (p=0.166), or tumor stage (p=0.812).
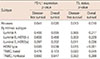
Interestingly, a strong correlation was observed between PD-L1 expression and the various intrinsic subtypes of breast cancer (p<0.001) (Table 3). High PD-L1 expression was significantly correlated with basal TNBC (29.6%) and HER2 type cancer (28.9%), but high PD-L1 was not associated with luminal A cancer (2.5%), HER2-negative luminal B (17.1%), HER2-positive luminal B (18.9%), or nonbasal TNBC (3.6%). High TIL levels were also significantly associated with basal TNBC (69.1%) and HER2 type cancer (68.9%) (p<0.001) (Table 3). High PD-L1 expression was significantly associated with high TIL counts in luminal A cancer (23.5%, p<0.001) (Table 4), HER2-negative luminal B (38.5%, p=0.001), HER2-positive luminal B (35.0%, p=0.009), and HER2 type cancer (41.9%, p=0.004), as well as basal TNBC (42.9%, p<0.001), but high PD-L1 expression was not associated with high TIL levels in non-basal TNBC (7.7%, p=0.464).
Survival analysis
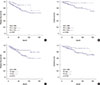
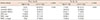
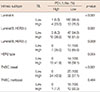
During a median follow-up period of 41.0 months (range, 1–158 months), disease recurrence was observed in 86 patients (18.5%), and 51 patients (11.0%) died. The 4-year OS rates for patients with invasive breast cancer with high or low PD-L1 expression were 98.4% and 87.6%, respectively. In the univariate survival analyses, patients with breast tumors expressing PD-L1 had significantly better DFS (p=0.041) and OS (p=0.026) (Table 5, Figure 2A and B). The presence of higher TIL levels was also associated with better DFS (p=0.013) and OS (p=0.010) (Table 5, Figure 2C and D). To evaluate PD-L1 positivity in invasive breast cancer as an independent prognostic factor of DFS and OS, multivariate analysis using the Cox proportional hazards model was performed, and included PD-L1 expression, TIL status, age, tumor size, lymph node metastasis, pathologic stage, and intrinsic subtype. Multivariate analysis revealed that expression of PD-L1 was not an independent prognostic factor for disease progression (hazard ratio [HR], 1.937; 95% confidence interval [CI], 0.701–5.354; p=0.203) or overall death (HR, 4.837; 95% CI, 0.584–40.087; p=0.144) (Table 6). However, the presence of higher TIL levels proved to be an independent prognostic factor for decreased disease progression (HR, 2.389; 95% CI, 1.284–4.445; p=0.006) and overall death (HR, 3.666; 95% CI, 1.561–8.607; p=0.003).
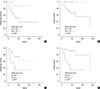
In subset analyses by intrinsic subtype, PD-L1 expression was associated with improved DFS (p=0.020) and OS (p=0.039) in the HER2 subtype (Table 5, Figure 3A and B). Of note, there was no association between PD-L1 expression and DFS and OS in the luminal A subtype, HER2-negative luminal B subtype, HER2-positive luminal B subtype, basal TNBC subtype, or nonbasal TNBC subtype (Table 5, Supplementary Figures 1 and 2, available online). In patients with HER2-positive luminal B tumors, the presence of higher TIL levels was associated with better DFS (p=0.011) and OS (p=0.026). In patients with HER2-positive disease, the presence of higher TIL levels was also associated with superior DFS (p=0.015) and OS (p< 0.001) (Table 5, Figure 3C and D). Similarly, in patients with basal TNBC, the presence of higher TIL levels was also associated with better DFS (p=0.020) and OS (p=0.045). Multivariate analysis using the Cox proportional hazards model found that neither high expression of PD-L1 nor high TIL levels in patients with HER2-positive disease was associated with significantly different DFS or OS.
DISCUSSION
PD-L1 expression was apparent in 13.5% (n=465) of invasive breast cancer specimens. As previously described, the H-score (which comprises the intensity of staining and the percentage of stained cells) was used to assess the expression of PD-L1 [12]. In breast cancer, the reported frequency of PD-L1 expression by carcinoma cells varies considerably between studies [1217181920]. In a study that analyzed tissue from 44 patients, PD-L1 was expressed in 34% of breast cancers using the mouse monoclonal MIH1 clone [18]. In a subsequent study conducted by the same group and using an expanded version of the cohort (n=69), PD-L1 expression was reported in 29% of breast carcinomas [19]. A report using similar scoring methods to those used in our cohort found that PD-L1 was expressed in 23.4% of 650 breast cancer patients [12]. A study analyzing tissue from 192 patients reported PD-L1 expression in 56% of breast cancers [14]. Another study reported that PD-L1 was expressed in more than 1% of tumor cells in only 1.7% of the total 3,916 breast tumors by IHC analysis [17]. A study analyzing 636 breast tumors using in situ mRNA hybridization revealed that PD-L1 was expressed in 58% of the breast cancer specimens in TMAs [21]. Another study using mRNA expression and DNA microarrays reported that PD-L1 gene expression was upregulated in 20% of all clinical samples and 38% of basal tumors [20]. These differences might be explained by the absence of validated assays, reliable antibodies, and interpretative uncertainties (e.g., cutoff for positivity).
We investigated the associations between PD-L1 in invasive breast cancer and a number of clinicopathologic characteristics, including prognosis, by intrinsic subtype. High PD-L1 expression was associated with high histologic grade, negative lymph node metastasis, early pathologic stage, ER and PR negativity, HER2 positivity, CK5/6 and EGFR positivity, high Ki-67 proliferative index, and positive p53 expression. Our data also reveal that PD-L1 expression was significantly associated with elevated TILs, and point to the critical role of local immunity in limiting tumor progression. There was no significant correlation between PD-L1 expression and age, sex, histology, or tumor stage. The results of the current study regarding high histologic grade, ER negativity, PR negativity, HER2 positivity, CK5/6 positivity, EGFR positivity, and high Ki-67 proliferative index are similar to those reported in numerous previous studies of breast cancer [612131415181920212425]. However, one study reported that PD-L1 expression in breast cancer specimens is associated with large tumor stage and positive lymph node metastasis [12], with other authors reporting an association between PD-L1 expression and younger age at diagnosis, lymph node positivity, and larger tumors [14]. Another study reported that lymph node-positive tumors demonstrated higher PD-L1 protein expression than lymph node-negative tumors [25]. These discrepant findings could have been due to elements such as variations in subtypes of TILs, or differences in the carcinoma types; patient races or sample sizes; laboratory IHC methods; or other cofactors that affect tumor behavior. Therefore, additional research involving a larger cohort will be needed to confirm our findings. In agreement with previous studies [6132024], our results showed that high PD-L1 expression was significantly associated with basal TNBC (29.6%) subtype. Interestingly, we also found a strong correlation between PD-L1 expression and HER2 type.
In our cohort, PD-L1 expression was significantly correlated with better DFS and OS in univariate analysis, but not in multivariate analysis. In contrast, the presence of higher TIL levels proved to be an independent prognostic factor for decreased disease progression and overall death. In the subset analyses by intrinsic subtype, the expression of PD-L1 and higher TIL levels were associated with better DFS and OS in patients with HER2 type disease. In the multivariate analysis, neither high PD-L1 expression nor high TIL levels showed significant differences.
PD-L1 expression is associated with poor prognosis in a variety of human cancers, such as malignant melanoma [26], lung cancer [27], RCC [11], and gastric cancer [928]. PD-L1 protein expression is reportedly associated with poor prognosis in breast cancer [12]. The results of the study showed that the expression of PD-L1 was associated with decreased OS in the HER2-negative luminal B subtype, the HER2-positive luminal B subtype, the HER2 subtype, and the basal TNBC subtype. The authors suggest that expression of PD-L1 by tumor cells can contribute to impaired function of TILs, impeding antitumor immunity.
However, a recent report found that PD-L1 expression was significantly associated with better OS in a cohort of 192 breast cancer patients, despite its association with poor clinical and pathologic features, such as younger age at diagnosis, lymph node positivity, negative ER status, and recurrence at distant sites [14]. Another study, using in situ hybridization, found that PD-L1 mRNA expression in 636 breast tumors was significantly associated with longer recurrence-free survival [21]. A study analyzing 5,400 breast tumors by mRNA expression and DNA microarrays showed that PDL1 upregulation was correlated with better metastasis-free survival and OS in basal breast cancers [20]. In addition, supporting this notion, PD-L1 expression by tumor cells has been significantly associated with better outcomes in NSCLC [4], malignant melanoma [7], Merkel cell carcinoma [29], and colorectal cancer [8].
The present study revealed that PD-L1 expression correlates with higher TIL levels, and similar findings have been reported by others [1315182124]. The presence of TILs in TNBC and HER2-positive carcinomas is an independent prognostic factor for better OS, decreased distant recurrence, and increased metastasis-free survival [16]. This would explain why PD-L1 expression was found to be associated with better prognosis in our study of human breast cancers.
Our analysis has a number of limitations. First, this study involved a retrospective design with a relatively small sample size drawn from a single institution; therefore, there may have been an inherent selection bias. Second, mature survival information was limited as the follow-up duration in our study was not long enough to fully evaluate 5-year survival rates. A third issue is that the use of TMAs may underestimate or overestimate PD-L1 protein expression owing to intratumoral heterogeneity of expression. Another shortcoming of this study is that the significant differences in percentage of specimens positive for PD-L1 protein expression, relationships with clinicopathologic features, and survival might be affected by several confounders, such as the lack of a standardized staining and analysis protocol, as well as the variety of antibodies. A final limitation is that we did not assess PD-L1 protein expression in the metastatic setting in which trials of PD-L1 inhibitors have been conducted to date.
In conclusion, we assessed the clinicopathological correlations, intrinsic subtype, and the prognostic significance of PD-L1 expression via IHC in invasive breast cancer. PD-L1 protein expression in breast cancer is correlated with better DFS and OS, but is not an independent prognostic factor. High PD-L1 expression was significantly associated with high TIL levels. Prospective studies along with clinical trials are required to confirm these observations, and will be of assistance in selecting patients with a high likelihood of responding to immunotherapy targeting PD-1 and PD-L1.

 XML Download