

 PDF
PDF ePub
ePub Citation
 Print
Print


INTRODUCTION
Adenosis lesions comprise a group of benign proliferative disorders of the breast that are mainly derived from the terminal ductal-lobular unit [1]. In sclerosing adenosis, a preferential preservation of myoepithelial cells is observed along with variable atrophy of the epithelial cells adjunct to the lobular fibrosis [1]. There is a special subtype of sclerosing adenosis that forms tumoral masses, known as an adenosis tumor or a nodular sclerosing lesion [12]. These lesions almost exclusively affect premenopausal women [1], are categorized as proliferative breast lesions without atypia, and require no specific treatment [3]. In addition, it has been claimed that these lesions pose only a small risk of future breast cancer development, and thus chemoprevention is not recommended [3]. Although these lesions are mostly accompanied by other types of benign lesions, such as fibrocystic changes, occasionally this type of proliferation can be observed as a pure entity [1].
The role of dynamic contrast-enhanced magnetic resonance imaging (DCE-MRI) is well established in evaluating the extent of documented breast cancer, monitoring the response to neoadjuvant chemotherapy, and screening for breast cancer in high-risk subpopulations [4]. Although DCE-MRI is emerging as a promising diagnostic modality in detecting malignant lesions of the breast, especially among patients with dense breasts and patients genetically prone to breast cancer, there have also been numerous reports of high false-positive rates in breast MRI [56]. On the other hand, the adenosis lesions, including sclerosing adenosis, may mimic the features of malignancy on breast imaging [7]. Recently, Oztekin et al. [8] reported a case of a nodular sclerosing lesion exhibiting malignant features on breast DCE-MRI; however, our literature review revealed no published data of different suspicious-appearing features of breast adenosis lesions appearing on MRI.
In this study, we aim to describe the features of adenosis lesions that may mimic malignancy on breast MRI. It is vital to be aware of the confusion caused by the imaging of these benign lesions, and to consider this entity in the differential diagnosis of breast carcinoma on breast MRI.
METHODS
Patients and lesions
In a database of 800 patients who underwent breast DCE-MRI and had a suspicious or a highly suspicious final assessment and subsequent biopsy, we identified 49 lesions with the pathological diagnosis of adenosis. According to the Breast Imaging Reporting and Data System (BI-RADS) published by the American College of Radiology (ACR), each enhancing lesion was categorized from 2 (benign) to 6 (known cancer) [910]. This cross-sectional study was approved by the Institutional Review Board of Tehran University of Medical Sciences (91-03-98-19621). Our inclusion criteria in this study consisted of enhancing lesions with breast DCE-MRI findings that were suggestive of malignancy (ACR BI-RADS category 4 or 5) that histological diagnosis proved to be benign, indicating adenosis.
Finally, 49 lesions were included in our study. According to the histological diagnosis, the patients were divided into two main groups: pure adenosis (group A) and adenosis mixed with fibrocystic changes (group B). Subsequently, each group was subdivided into mass and nonmass enhancement based on the breast DCE-MRI features (Table 1). One of the lesions was a focus with irregular borders compatible with BI-RADS category 4 (final assessment).
Among these patients, five were biopsied under stereotactic mammography due to the presence of microcalcifications that correlated with MRI findings, and 44 were biopsied under ultrasound guidance. Twenty patients had undergone surgery for different reasons, and pure or complex adenosis lesions were confirmed on surgical pathology. Other patients had received follow-up examinations for 12 to 60 months (mean, 24±11.1 months) with ultrasound exams or mammography for assessment of the age and visibility of the lesions, and all of the included patients had undergone at least one breast DCE-MRI as a follow-up modality. The stability of size, the appearance on breast DCE-MRI features, and the lack of development of suspicious findings on mammography and ultrasound exam were indicative of benign lesions. We assessed the morphologic features of enhancing masses, including shape, margin, and internal enhancement pattern, as well as the dynamic characteristics of time intensity curves, including the initial phase and the postinitial curve type. For nonmass enhancement, in addition to the similar dynamic characteristics, we evaluated the morphologic findings of distribution and internal enhancement pattern.
MRI protocol
MRI was conducted using a 1.5T Signa system (General Electric Medical Systems, Milwaukee, USA) with a bilateral phased array 4-channel breast coil. All patients were scanned in the prone position. Among the premenopausal patients, MRI was conducted during the second week of their menstrual cycle, whenever possible. Axial T1-weighted and axial short tau inversion recovery (STIR) images were obtained, followed by six series of axial dynamic T1-weighted three dimensional, fat-suppressed spoiled gradient-echo images (one set prior and five series after bolus injection of 0.1 mmol/kg gadoterate meglumine) (Dotarem, Guerbet, France), followed by a 15-mL saline injection chaser.
Axial T1-weighted sequence was obtained with the following parameters: repetition time/echo time (TR/TE), 400/10; band width (BW), 31.25 Hz/pixel; field of view (FOV), usually 32 mm; slice thickness, 5.0 mm; matrix size, 384×256; number of excitations (NEX), 1. The parameters of axial STIR images were as follows: TR/TE, 4,500/63; bandwidth, 62.50; FOV, usually 32 mm; slice thickness, 5.0 mm; matrix size, 320×256; NEX, 1. We obtained a dynamic T1-weighted three dimensional, fat-suppressed spoiled gradient-echo sequence with the following parameters: TR/TE, 9/4; BW, 31.25 Hz/pixels; FOV, 32 mm; slice thickness, 4.0 mm with no intersection gap; matrix size, 352×288; NEX, 1; flip angle, 300. The dynamic series were obtained every 60 to 90 seconds, so all six series were performed within 9 minutes of intravenous contrast injection.
Interpretation of breast MRI findings
Breast DCE-MRI exams were interpreted by a dedicated subspecialized expert radiologist (M.G.) with more than 10 years' experience in breast imaging. Morphologic configuration and kinetic enhancement assessment were based on the ACR BI-RADS MRI lexicon. The morphologic configurations included focus/foci (punctuate dots of enhancement ≤5 mm); mass (an enhancing mass that had space-occupying features >5 mm); and nonmass enhancement (an area of enhancement that had neither tri-dimensional mass nor typical mass characteristics) [9]. Based on morphologic and kinetic enhancement characteristic results, all patients were assigned a proper BI-RADS category number from 0 (incomplete X-ray assessment) to 6 (known malignancy) [10]. We utilized a commercial computer-aided diagnostic system (CADstream; Merge Healthcare, Chicago, USA) for a systematized interpretation of breast DCE-MRI; five series of three-dimensional subtracted images were processed using CADstream. Hence, the enhanced areas were rendered to be more conspicuous on subtracted images. Lesions that showed slow initial contrast enhancement (<50% enhancement in the first 90 seconds) were excluded, as we only emphasized significant initial enhancement. In the enhancement kinetic analysis, the most worrisome curve type in each lesion was considered for interpretation, i.e., if it consisted of more than 2% of the enhancing curves. In patients with suspicious MRI findings, the DCE-MRI results were compared and correlated with recent digital mammograms within a month of the MRI examination, and a second ultrasound exam was performed before proceeding to biopsy.
Histological tissue diagnosis
We correlated the MRI-enhanced lesions with both a second breast ultrasound and a recent digital mammography. In the case of a confident positive finding supporting MRI features, the lesion was biopsied under ultrasound-guidance with either a 14-gauge core needle biopsy or with a vacuum assisted 8-11 gauge needle (Suros, Hologic, Bedford, USA) under a stereotactic prone biopsy system (Multicare; Hologic). A single dedicated breast pathologist (Y.KH.) reviewed all cases. The MRI-guided biopsy is a helpful technique in patients with inconclusive ultrasound or mammography exams. Because this technique was not available to us, patients without any related positive findings on ultrasound exam or mammography were either referred to other centers equipped with MR-guided biopsy, or carefully followed up using DCE-MRI after 4 to 6 months. We evaluated 59.1% (29/49) of the lesions with core needle biopsy; the remaining 40.9% (20/49) were assessed using excisional biopsy, either due to a recommendation by our pathologist, or a highly suspicious imaging feature.
Patients with pathology results of adenosis underwent follow-up exams for 12 to 60 months (mean, 24±11.1 months) with either ultrasound or mammography, which involved assessment of the age and the visibility of the lesions; all patients had at least one follow-up breast DCE-MRI. Stability in lesion size and MRI appearance, or a downgrade of the BI-RADS category, confirmed benignity in patients who were not candidates for surgery.
Statistical analysis
For statistical analysis of data, we used SPSS program version 18 (SPSS Inc., Chicago, USA). All descriptive statistics, including mean±standard deviation for continuous variables and frequency for categorical variables, were calculated in all patients and in subgroups. Comparison of categorical variables between subgroups was done by chi-square test and exact test (if needed). p-values less than 0.05 were considered statistically significant.
RESULTS
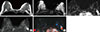
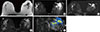
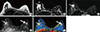
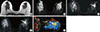
Based on the defined selection criteria, we found 49 enhancing lesions in 41 patients who underwent breast MRI. The lesions included 32 enhancing masses (65.3%), 16 nonmass enhancing lesions (32.7%), and one focus (2%). Regarding histopathological characteristics, we categorized the lesions into two groups: pure adenosis (group A) and mixed adenosis (group B). Group B was associated with simple and proliferative benign pathologic findings (fibrocystic changes) without any atypical changes. Group A included 33 lesions (in 26 patients); in group B, we found 16 lesions in 15 patients. The mean age of patients in group A was 43.2±8.2 years (range, 25-55 years). In this group, 27 lesions (81.8%) were reported as showing sclerosing adenosis, three (9.1%) had adenosis tumor, two (6.1%) had simple adenosis, and one (3%) had microglandular adenosis. In group B, the mean age was 42.5±9.2 years (range, 30-56 years), and the accompanying findings included proliferative and nonproliferative fibrocystic changes without any atypia or other benign findings (Figures 1, 2, 3, 4).
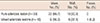
The distribution of pure and mixed adenosis lesions based on MRI findings of enhancing mass, nonmass enhancement, and enhancing focus types is shown in Table 1.
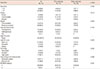
Among enhancing mass lesions, the mean size was 11.9±4.6 mm (range, 7-28 mm); one lesion was missing data regarding mass size. Regarding BI-RADS categories, enhancing masses of both groups consisted of 29 lesions with BI-RADS category 4 (90.6%) and three lesions with BI-RADS category 5 (9.4%). Considering both morphologic and dynamic MRI BI-RADS descriptors of enhancing masses, our findings mainly showed a higher frequency in subgroups that are considered suspicious or suggestive of malignancy. In this regard, 22 lesions (69.0%) were 10 mm or larger, 26 (81.2%) showed oval/lobulated or irregular shapes (14 oval/lobulated and 12 irregular), 20 (62.5%) showed noncircumscribed margins, 16 (50.0%) showed heterogeneous internal enhance-ment, all had a rapid initial rise of the time-intensity curve, and 21 (65.6%) showed wash-out patterns in the late-phase dynamic curve. The T2 findings in this group were more in the form of high signal (17 [53.1%] out of 28 present data). The details of the MRI BI-RADS descriptor of enhancing masses for both group A and group B are shown in Table 2. The study data indicate that there were no statistical differences in the distribution of descriptors between groups A and B (Table 2).
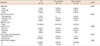
Nonmass enhancing lesions consisted of 15 cases with BI-RADS category 4 (93.8%), and a single case of BI-RADS category 5 (6.3%). Similar to the findings for mass lesions, morphologic and dynamic descriptors showed more prevalence in findings that were considered as suspicious or suggestive of malignancy. In this instance, nine cases (56.2%) showed segmental or linear distribution (six segmental and three linear distribution), nine (56.3%) demonstrated clumped internal enhancement, all (16, 100%) had a rapid initial pattern in the dynamic curve of contrast enhancement, and 12 (65.6%) showed a wash-out or plateau pattern in the late phase of this curve (eight wash-out and four plateau curves). Table 3 shows the details of BI-RADS descriptor distribution in nonmass lesions between the two groups. According to the results, excepting internal enhancement, the distribution of other descriptors does not show a statistical difference between groups A and B for nonmass enhancement (Table 3).
The single focus enhancement in our series had a BI-RADS category 4. It was 5 mm in size and had an irregular shape, rapid initial contrast enhancement, and postinitial plateau curve pattern. It was depicted as a small oval mass, with posterior shadowing on ultrasound. Ultrasound-guided biopsy revealed proliferative changes with sclerosing adenosis.
DISCUSSION
Adenosis lesions refer to a group of benign proliferative disorders of the breast with two main histological subtypes: sclerosing adenosis and adenosis tumors. Different studies have found varying rates of malignancy risk in adenosis lesions, ranging from negligible to 6.7% [1]. According to the literature, adenosis lesions may mimic malignancy on ultrasound imaging and mammography [1112]. The major clinical consideration is to distinguish adenosis lesions from malignancy as the most important differential diagnosis [1]. Recently, a retrospective study assessed the mammographic and ultrasonographic findings among patients with a main diagnosis of sclerosing adenosis [2]. They concluded that sclerosing adenosis may be confused with malignancy based on radiologic features [2]. Other studies support the conclusion that certain suspicious features of sclerosing adenosis mimic malignancy on mammography and ultrasonography [71314]. In mammography, sclerosing adenosis may present as diffuse or clustered microcalcifications, as a mass with an irregular shape or spiculated borders, or display asymmetric focal density and focal architectural distortion, which shares numerous features with breast cancer [71415]. On ultrasound, adenosis may present as a focal, ill-defined mass with acoustic shadowing, or a circumscribed mass with a well-defined, microlobulated, or irregular margin [71314]. Therefore, based on mammographic and ultrasound features, a radiologist cannot reliably distinguish adenosis lesions from malignancy [7]. On the other hand, there have been several articles regarding the failure of breast MRI in distinguishing malignant from benign lesions, such as stromal fibrosis, radial sclerosis, and fibrocystic change disease [13141516]. A recent published case report by Oztekin et al. [8] presented a 33-year-old female patient with bilateral palpable masses. On mammography, several masses with ill-defined and obscured margins were detected, while ultrasonography revealed multiple hypoechoic masses. On MR mammography, among several enhancing masses with benign or probable benign findings, one represented borderline features, and was categorized as BI-RADS 4a. Subsequent histological diagnosis proved sclerosing adenosis and ductal epithelial hyperplasia with atypia. In fact, although many articles have demonstrated the usefulness of BI-RADS categorization in discriminating malignant from benign lesions, there are still several benign pathologies that are structurally misleading. In our database, we found a group of biopsy-proved adenosis lesions that demonstrated morphologic or dynamic borderline features according to the ACR BI-RADS lexicon [10]. We also noticed that adenosis lesions are one of the common reasons for false-positive reports of malignancy among our patients who underwent breast MRI. Based on the available literature, we report, for the first time, borderline or suspicious breast MRI findings related to different pathologic forms of adenosis lesions. According to several published articles, some MRI features are considered to be indicative of malignancy [910171819]. In the MRI-detected enhancing masses, evidence of irregular shape, irregular or spiculated margin, rim enhancement, heterogeneous internal pattern, and size larger than 1 cm are considered suspicious features. In the nonmass enhancing lesions, evidence of segmental or ductal distribution, as well as internal enhancement of clumped or multiple ring patterns, are considered suspicious features [1718202122]. Dynamic curves of the wash-out postinitial pattern are indicative of malignancy in both enhancing masses and non-mass enhancing lesions. Tozaki and Fukuda [19] reported segmental distribution and heterogeneous or clumped internal patterns as the most frequent findings among malignant lesions with a nonmass enhancing pattern on MRI. Lee et al. [14] showed how these suspicious features could be misleading in the MRI interpretation in a group of patients with stromal fibrosis.
Similarly, among our patients, the presented features suggestive of malignancy for an enhancing mass included irregular shape, noncircumscribed margin, mass size equal or larger than 1 cm, and heterogeneous signal enhancement. Among the dynamic descriptors of mass, rapid initial contrast enhancement and wash-out or plateau dynamic curves were considered misleading. In our patients with nonmass enhancing lesions, the prominent borderline misleading characteristics included focal or segmental distribution, clumped pattern, rapid initial enhancement, and wash-out or plateau dynamic curves as the suspicious features.
On the other hand, adenosis lesions that are detected by other radiologic modalities, such as mammography and ultrasound, could be read as occult or benign features on breast MRI. In this study, we did not examine such adenosis lesions. A limitation of the study was our lack of equipment for breast DCE-MRI guided biopsy, and thus we missed the data of those patients who did not have compatible detectable lesions on mammography or ultrasound exams. The other limitation is that all images were reported by a single radiologist, and therefore we could not consider interobserver variability. Finally, although MRI is a reliable diagnostic approach, breast lesions containing pure adenosis or adenosis lesions mixed with other benign pathologic entities can share many border-line or suspicious features with malignancy on breast MRI. Awareness of the fact that adenosis of the breast can show suspicious features on breast MRI, and thus mimic malignancy, would be helpful in obviating unnecessary breast biopsies.
 XML Download