

 PDF
PDF ePub
ePub Citation
 Print
Print


INTRODUCTION
Despite recent advances in the diagnosis and treatment of breast cancer, the disease remains to be a significant health problem worldwide. In 2010, it was estimated that 1.5 million cases of breast cancer were diagnosed, representing nearly a quarter of all cancer diagnoses in women. Breast cancer is now the leading cause of cancer death in economically developed countries [1]. Breast cancer fatalities are generally attributable to metastasis and the development of resistance to chemotherapy due to the over expression of prometastatic, multidrug resistance and antiapoptotic genes [2].
Apoptosis (programmed cell death) is a normal physiological phenomenon that can be observed in various tissues. Cells undergoing apoptosis are characterized by distinct biochemical and morphological changes. Failure to undergo apoptosis has been implicated in tumor development and resistance to cancer therapy. Thus, any agents that can induce apoptosis may be useful for cancer treatment [3], and apoptosis induction is arguably the most potent defense against cancer promotion [4]. MCF-7, the breast cancer-derived cell line, is deficient of caspase-3 and is relatively insensitive to many chemotherapeutic agents [5]. In the past several decades, many studies have been performed to identify a suitable apoptotic agent using this cell line without significant success.
Venom toxins are complex mixtures of proteins and peptides with different physiological and pharmacological effects. The therapeutic use of animal venoms dates back to the beginning of the past century. Calmette et al. [6] was the first group to report that the venom of Naja sp. has antitumor effects on adenocarcinoma cells.
D'Suze et al. [7] isolated two novel peptides (neopladine 1 and neopladine 2) from Tityus discrepans scorpion venom and found that these peptides have anticancer effects against the breast cancer cell line SKBR3 and no effect on the normal monkey kidney cell line (MA104). Their results showed that neopladines bind to SKBR3 cell surface ligands and induce FasL and BcL-2 expression.
Chlorotoxin, a peptide isolated from Leiurus quinquestriatus, specifically binds to glioma cells and prevents their proliferation [8]. Bengalin, a peptide of 72 kDa isolated from the venom of Houbaropsis bengalensis, has antiproliferative and apoptotic effects on human leukemia cells [9]. Bee venom can induce morphological changes and inhibit the proliferation of MCF7 cells. Bee venom induces the production of reactive oxygen species (ROS), dysfunction of the mitochondrial membrane potential, and causes cytochrome c release resulting in the induction of apoptosis.
Cytotoxins are polypeptides found in the venom of cobras. Their polypeptide chain consists of 59-62 amino acid residues and constitutes about 60% of all proteins in cobra venom [10]. They have various structural characterizations in different cobra species with a wide spectrum of biological activities. The Caspian cobra (Naja naja oxiana) is a highly venomous species of cobra in the family Elapidae found in Central Asia. Caspian cobra venom contains two known cytotoxins (cytotoxin-I, cytotoxin-II), and initial studies have shown that these compounds are amphiphilic and cytotoxic against a variety of cells, including cancer cells [11,12]. Cytotoxin-II is a 6636-Da polypeptide with a 60-amino acid chain, three loops, and four disulfide bonds [13]. In the present study, we evaluated the cytotoxicity of cytotoxin-II on the human breast adenocarcinoma cell line (MCF-7) as well as the mechanism of cell death.
METHODS
Isolation and preparation of cytotoxin-II
Crude venom of the Caspian cobra was supplied from Razi Vaccine and Serum Research Institute (Karaj, Iran), and cytotoxin-II was isolated by different chromatographic methods as described previously [10]. Isolated cytotoxin was immediately freeze-dried and stored at -20℃. The purity and identity of cytotoxin was confirmed by liquid chromatography-mass spectroscopy. Protein content was determined by the Lowry method [14]. A stock solution of cytotoxin for molecular and cellular tests was prepared in phosphate buffered saline (PBS) and working solutions were prepared in culture media.
Cell line and culture
MCF-7 and MCF10A cell lines were obtained from the National Cell Bank of Iran. MCF-7 cells were cultured in RPMI-1640 medium supplemented with 10% (v/v) fetal bovine serum, 100 mg/L of streptomycin, and 100,000 U/L of penicillin G. MCF-10A cells were cultured in Dulbecco's modified Eagle's medium containing 5% horse serum, 20 ng/mL human epidermal growth factor, 0.5 mg/mL hydrocortisone, 100 ng/mL cholera toxin, 10 g/mL insulin, and 1× penicillin/streptomycin at 37℃ in 5% CO2.
Morphological analysis
The cells were seeded in 12-well plates at a density of 4×10⁴ cells per well and incubated overnight. Then, the cells were treated with different concentrations of cytotoxin-II and incubated for 24, 48, and 72 hours. After removing the medium, the cells were washed once with normal saline and observed using a phase contrast inverted microscope (Euromex Microscopes Holland, Arnhem, The Netherlands) equipped with a digital camera (Moticam Pro 2828; Motic, Xiamen, China) at 40× magnification.
Cell viability assay
The inhibitory concentration value (IC50) was evaluated using a 3-(4,5-dimethylthiazol-2-yl)-2,5-diphenyltetrazolium bromide (MTT) assay. MCF-7 and MCF10A cells were seeded in 96-well plates at a density of 1×10⁴ cells per well and incubated overnight. The cells were then treated with different concentrations of cytotoxin-II and incubated for 24 hours. Then, 20 µL of MTT stock solution (5 mg/mL) was added to each well and cells incubated for 4 hours at 37℃. The MTT solution was then discarded and 100 µL of Dimethyl sulfoxide was added into each well and incubated for 30 minutes in the dark to dissolve insoluble formazan crystals. The optical density (OD) was measured at a test wavelength of 590 nm and a reference wavelength of 650 nm using an enzyme-linked immunosorbent assay (ELISA) multi-well plate reader (BioTek Instruments, Winooski, USA). The OD values were used to calculate the percentage of viability using the following formula:

Fluorescence microscopic analysis of cell death
Cells were seeded at a density of 5×10⁴ MCF-7 cells per well into each well of a 12-well plate and incubated overnight. Different concentrations of cytotoxin-II were then added into the wells and the plate was incubated for 24 hours. After incubation, cells were harvested by trypsin and centrifuged at 700×g. Then, 20 µL of acridine orange (20 µg/mL) and 20 µL of ethidium bromide (20 µg/mL) were added to the cell plaque and cells were viewed under a fluorescence microscope (Moticam Pro 2828) with 40× magnification [15].
Flow cytometric analysis of cell death
The cells were serum-starved for 24 hours to synchronize them to the G0 phase of the cell cycle and were then treated with different concentrations of cytotoxin-II for 24 hours. Flow cytometric analyses was performed using a flow cytometry system (Partec GmbH, Münster, Germany) to measure the number of cells undergoing apoptosis as previously described [16]. Briefly, cells in suspension were fixed in ice-cold 70% ethanol followed by incubation in DNA staining solution (20 µg/mL propidium iodide and 0.2 mg of DNase-free RNase in PBS) for at least 30 minutes at room temperature in the dark. Excitation was set at 488 nm and read at 600 nm. More than 10,000 events were collected for analysis. The sub-G1 population was calculated as an estimation of the apoptotic cell population.
Flow cytometric detection of mitochondrial membrane potential
Rhodamine 123 is a cationic fluorescent probe shown to be selectively accumulated in mitochondria due to the trans membrane potential difference (the inside is negatively charged). Cells at a density of 2×10⁶ were seeded in 25 T cell culture flasks and incubated overnight. Different concentrations of cytotoxin-II were added to the flasks and incubated for 24 hours. After incubation, cells were washed 2 times with PBS, incubated with rhodamine 123 (0.5 µM) in the culture media for 30 minutes at 37℃, and analyzed using flow cytometry (Partec CyFlow space; Partec GmbH). A total of 10,000 events were collected per sample [17].
Measurement of intracellular ROS
MCF-7 cells were cultured in 6-well plates and treated with the IC50 value of cytotoxin-II for 3, 6, 12, 24, and 48 hours. Formation of ROS was measured using the membrane permeable dye dichlorodihydro fluorescein diacetate. The dye was added to each well with a final concentration of 10 µM and the plates were incubated at 37℃ for 20 minutes. The fluorescent intensity was measured by a fluorescence plate reader with excitation set to 485 nm and emission set to 530 nm. Protein concentration was measured using the Bio-Rad protein assay kit (Bio-Rad Laboratories Inc., Hercules, USA) using bovine serum albumin as a standard. Results are shown as fold increase in fluorescent intensity per microgram of protein compared to the control group [18]. In order to determine whether ROS is critical for cytotoxin-II-induced apoptosis, the experiment was repeated on MCF-7 cells treated with the IC50 value of cytotoxin-II in the presence of glutathione (a potent ROS scavenger) and apoptosis was evaluated using annexin V/propidium iodide staining.
Detection of apoptosis using annexin V
An annexin V fluorescein isothiocyanate/propidium iodide (annexin V-FITC/PI) apoptosis detection commercial assay kit (Sigma, St. Louis, USA) was used to detect early stages of apoptosis. Propidium iodide (PI) was used to bind to DNA and produce red fluorescence in necrotic cells. MCF-7 cells were treated with the IC50 value of cytotoxin-II for 24 hours, washed twice with Dulbecco's phosphate buffered saline, treated with annexin V-FITC/PI, and incubated for 10 minutes at room temperature. The cells were observed using a fluorescence microscope, and the percent of living (unstained), necrotic (propidium iodide in the nucleus), early apoptotic (annexin V on the plasma membrane without propidium iodide in the nucleus), and late apoptotic (annexin V on the plasma membrane with propidium iodide in the nucleus) cells were counted [10,19].
Caspase-9 activity assay
Caspase-9 activity in the treated and control cells was measured using a caspase-9 colorimetric assay kit (Sigma) according to the manufacturer's instructions. The kit utilizes synthetic tetrapeptides labeled with p-nitroanilide. Briefly, 1×10⁶ cells were treated with different concentrations of cytotoxin-II for 24 hours. Also, 1×10⁶ cells were treated with 4 µg/mL cytotoxin-II for 6, 12, 24, 48, and 72 hours. Then, the cells were lysed in the supplied lyses buffer. The supernatant was collected and incubated with the supplied reaction buffer containing dithiothreitol and substrates at 37℃. The reaction was measured by changes in absorbance at 405 nm using a microplate reader (BioTek Instruments). For comparison, the value of the absorbance of the control group was considered as 100% activity.
Statistical analysis
Experiments were repeated at least three times and results are expressed as mean±SD. Data were analyzed by Student
t-test and an analysis of variance (ANOVA) test followed by a Tukey posttest to determine the significant differences between groups. p-values <0.05 were considered to be significant. All statistical analyses were performed using GraphPad-Prism 5 software (GraphPad-Prism Software Inc., San Diego, USA).
RESULTS
Morphological analysis
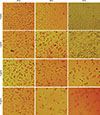
Monitoring of cytotoxin-II treated cells under normal inverted light microscopy showed significant morphological changes compared to control cells. Treated cells detached from the dish surface and exhibited rounding, cytoplasmic blebbing, and irregularity in shape. Increases in treatment dose and time reduced the cell count significantly (Figure 1).
Cell viability assay
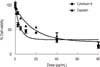
The MTT assay showed that cytotoxin-II inhibits cell proliferation in a dose and time-dependent manner. Figure 2 shows the dose-response cell viability curves for cytotoxin-II in MCF-7 cells compared to a common chemotherapeutic agent (cisplatin). As shown in Figure 2, in this cancer cell line the IC50 value of cytotoxin-II was 4.18±1.23 µg/mL while the value for cisplatin was approximately 28.02±1.87 µg/mL. These findings indicate that cytotoxin-II has a stronger inhibitory effect on cancer cell proliferation than cisplatin. The trend of increasing cytotoxicity with increasing incubation time was observed in the MCF-7 cell line (data not shown). The IC50 of cytotoxin-II in MCF10A was 18.12±2.56 µg/mL indicating that cytotoxin-II specifically inhibits cancer cell proliferation and has a minimum effect on normal cells.
Fluorescence microscopic analysis of cell death
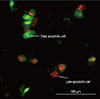
Staining of treated and control cells with acridine orange and ethidium bromide (AO/EtBr) was quantified as follows: ( 1) normal cells: bright green chromatin with organized structure; (2) early apoptotic cells: bright green chromatin that is highly condensed or fragmented; ( 3) late apoptotic cells: bright orange chromatin that is highly condensed or fragmented; and ( 4) necrotic cells: deep saturated red cells (Figure 3). At least 200 cells from randomly selected fields were counted and quantified for each data point. The results showed that cytotoxin-II can induce both necrotic and apoptotic death in MCF-7 cells. Concentrations of about 1 µg/mL had no significant effects, but at concentrations above 2 µg/mL the percentages of apoptotic cell were significantly increased and the best apoptotic/necrotic ratio was observed at 4 µg/mL. As seen in Figure 4A, at concentrations above 8 µg/mL the cell death pattern changed to necrosis, and the percentage of necrotic cells compared to apoptotic cells in the total cell population rapidly increased. Induction of apoptosis was time-dependent, and, as seen in Figure 4B, 4 µg/mL of cytotoxin-II significantly increased the percentage of apoptotic cells with increased exposure time.
Flow cytometric analysis of cell death
Cell cycle analysis of cells treated with different concentrations of cytotoxin-II showed G1 arrest and increased proportions of cells in the sub-G1 group (apoptotic cells). These effects were dose and time-dependent. The percentage of cells in the sub-G1 phase in the control (untreated) group was 3.3% compared to 88.3% in cells treated with 4 µg/mL of cytotoxin-II (Figure 5).
Detection of apoptosis using annexin V
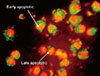
Apoptotic cells were readily identified with annexin V-FITC/PI double staining. As seen in Figure 6, approximately 28% of the cells in the cytotoxin-II treated cell population (IC50 value for 24 hours) were early apoptotic, 66% were late apoptotic, 3.5% were necrotic, and the rest were normal viable cells. These findings confirm that apoptosis is the predominant pattern of cell death induced by cytotoxin-II. Alternatively, treatment of MCF-7 cells with cytotoxin-II in the presence of glutathione (a potent ROS scavenger) showed no significant increases in apoptotic cell populations, demonstrating that ROS generation is critical for cytotoxin-II induced apoptosis.
Flow cytometric detection of mitochondrial membrane potential
The flow cytometric analysis of treated cells indicated that cytotoxin-II significantly reduced the mitochondrial membrane potential (MMP) in a dose and time-dependent manner (Figure 7) and the MMP of the treated cells remained significantly lower than the control throughout 48 hours of incubation.
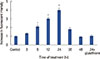
Measurement of intracellular reactive oxygen species
As shown in Figure 8, cytotoxin-II increased intracellular ROS production (up to 4 fold compared to the control). A maximum was reached at 24 hours of treatment, which decreased during the next 24 hours, to a lower level than the control.
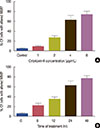
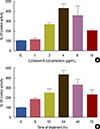
Caspase-9 activity assay
The colorimetric assay indicated that cytotoxin-II promoted caspase-9 activation in a dose-dependent manner (Figure 9). As shown in Figure 9, caspase-9 was significantly activated at doses higher than 2 µg/mL of cytotoxin-II and its maximal activity was observed at 4 µg/mL. Treatment of MCF-7 cells with the IC50 value of cytotoxin-II induced caspase-9 activation in a time-dependent manner up to 24 hours and after this time, the level of activated caspase-9 decreased slowly.
DISCUSSION
The present study is the first survey to show that cobra cytotoxin-II is active against breast carcinoma cells. The MTT assay indicated that cytotoxin-II strongly inhibits MCF-7 cell proliferation with an IC50 approximately 7-fold lower than cisplatin. This indicates that cytotoxin-II shows similar effects against cancer cells at a much lower dose than cisplatin. With regard to significant side effects of cisplatin for patients, this finding can be quite valuable.
In normal physiological conditions, homeostasis of the organs is maintained by a dynamic balance between the rate of cell proliferation and the rate of programmed cell death (apoptosis). Failure to undergo apoptosis has been implicated in tumor development and resistance to cancer therapy. Hence, agents that can induce apoptosis in tumor cells have the potential to become suitable anticancer drugs [20].
There are two fundamental apoptosis induction pathways. One involves the ligation of death ligands such as tumor necrosis factor and Fas to their cytoplasmic membrane receptors and is referred to as the extrinsic pathway [21]. The other pathway involves mitochondria and is known as the intrinsic pathway. The intrinsic pathway is initiated by the loss of MMP which leads to opening of the mitochondrial permeability transition pores and the release of effectors including cytochrome c and apoptosis inducing factor from the mitochondria into the cytosol. The cytochrome c triggers the proteolytic activity of caspase-3 and caspase-9 in the cytosol, and these activated caspases degrade (poly [ADP-ribose] polymerase) and caspase-activated-DNase, which initiates DNA degradation [22].
In the present study, significant apoptotic effects of cytotoxin-II in MCF-7 cells were demonstrated by different reliable methods. Annexin V/PI staining clearly showed translocation of phosphatidylserine from the inner side of cancer cells to the outer side after exposure to cytotoxin-II. The AO/EtBr double staining test showed classic manifestation of apoptotic cell death. There was an optimum dose and time (5 µg/mL and 24 hours) for induction of apoptosis and in higher doses the portion of necrotic cells rapidly increased. Flow cytometric analysis of cell death confirmed this finding and showed that approximately 88% of cells treated with 4 µg/mL of cytotoxin-II were in the sub-G1 phase.
At low concentrations, most toxins are endocytosed before translocation into the cytosol followed by accumulation into acidic endosome/lysosome vesicles [23]. A study by Feofanov et al. [24] showed that cytotoxin-II was endocytosed into different cancer cell line and accumulated in lysosomes. This toxin induces lysosomal membrane permeabilization and promotes the release of lysosomal hydrolytic enzymes such as cysteine cathepsins into the cell cytosol in turn triggering necrotic (in high doses) or apoptotic (in low doses) cell death process. Involvement of endosomal lysosomal cathepsins in the apoptosis process has been widely investigated [25]. The dose and time-dependent increase of intracellular ROS that was observed in MCF-7 cells after treatment with cytotoxin-II could be a consequence of lysosomal damage. On the other hand, our results showed that apoptotic cell death induced by cytotoxin-II in MCF-7 cells was a consequence of ROS generation and cotreatment of cytotoxin-II with ROS scavenger agents such as glutathione prevented apoptotic process activation. There are several reports which indicate that intracellular ROS causes mitochondrial damage and disruption of MMP due to the opening of mitochondrial membrane pores [26,27]. As seen in Figure 7, a significant number of MCF-7 cells with altered MMP were observed following cytotoxin-II treatment. Mitochondria have been reported to play a critical role in the regulation of apoptosis. The opening of mitochondrial membrane pores is followed by an increase in different apoptosis mediators and activation of downstream caspases. Our results demonstrated time and dose-dependent upregulation of caspase-9 in MCF-7 cells after cytotoxin-II treatment and these observations confirmed the possibility that apoptosis was mediated by the intrinsic pathway.
In conclusion, our results show that cobra venom-derived cytotoxin-II has potent anticancer effects in a breast carcinoma cell line. Cytotoxin-II induced these effects via the induction of apoptosis through lysosomal damage, release of lysosomal hydrolases such as cysteine cathepsins, production of intracellular ROS, mitochondrial damage, and activation of caspases. Future studies are warranted to further explore the potential of this toxin as a breast cancer treatment.


 XML Download