

 PDF
PDF ePub
ePub Citation
 Print
Print


We had previously reported the usefulness of 18F-fluorodeoxyglucose positron emission tomography (FDG-PET) for predicting the pathological complete response (pCR) of primary breast cancer in the neoadjuvant chemotherapy setting [1]. In this article, we present a close association between pathological response and the maximum tumor standardized uptake value (SUVmax) measured by FDG-PET scan prior to chemotherapy. Estrogen receptor (ER)-positive breast cancer (as determined by immunohistochemistry) presented a significantly lower baseline SUVmax (n=70; mean±SD, 6.51±3.51) than HER2 and triple-negative ones (n=24; mean±SD, 8.58±4.1; p=0.02 and n=17; mean±SD, 9.37±5.78; p=0.01, respectively). The baseline SUVmax of ER-positive tumors in which pCR was achieved (n=7; mean±SD, 9.8±4.0) was significantly higher than that in tumors in which no pCR was achieved (n=63; mean±SD, 6.4±3.1; p=0.006). Therefore, we hypothesized glucose hypermetabolism in luminal B tumors may result in chemotherapy responsiveness.
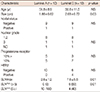
Using a single-gene expression assay, TargetPrint® (Agendia, Amsterdam, The Netherlands) and a 70-gene expression classifier, MammaPrint® (Agendia) [2,3], we divided 20 patients with ER-positive primary breast cancer into luminal A and luminal B subtypes and compared the tumor SUVmax value between the two groups. The demographics of these groups are shown in Table 1.
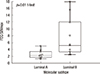
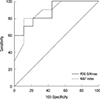
A significantly higher SUVmax was measured for luminal B tumors (n=10; mean±SD, 7.6±5.6) than for luminal A tumors (n=10; mean±SD, 2.6±1.2; p=0.01) (Figure 1). At the threshold of 5.0, the sensitivity and specificity of FDG-PET to identify tumors of the luminal B subtype were 60% and 100%, respectively. The area under the curve (AUC) analysis showed that SUVmax was an acceptable discriminator (AUC=0.878; 95% confidence interval [CI], 0.647-0.981) with results comparable with those of the Ki-67 labeling index (LI) (AUC, 0.878; 95% CI, 0.647-0.981), a proliferative marker used to discriminate luminal B tumors in clinical practice (Figure 2). When SUVmax and Ki-67 LI were combined, the diagnostic performance improved (AUC=0.933; 95% CI, 0.72-0.997).
Jin et al. [4] reported that among 273 breast cancer patients who received neoadjuvant chemotherapy, higher baseline SUVmax of the tumor and ER negativity were independent indicators of pCR. Despite the low number of ER-positive breast cancer patients who achieved pCR in that study, higher SUVmax in pCR than in non-pCR was in agreement with the results of our study. The role of glucose metabolism in ER-positive breast cancer was examined by Osborne et al. [5] from the Memorial Sloan-Kettering Cancer Center, who identified 43.7% of FDG SUV-correlated genes as ER signal-related genes by cDNA microarray analysis.
The present study has some limitations: the sample size was too small, including patients with relatively small tumors, which may have been a cofounding factor that affected the SUVmax. Standardization is required for the use of quantitative FDG-PET as an imaging biomarker.
Currently, FDG-PET scanning is used for noninvasive detection of metastasis. In combination with one-stop examination, which evaluates the clinical staging of primary breast cancer, FDG-PET may provide invaluable information on intrinsic subtyping and chemotherapy responsiveness in addition to that obtained from ER, progesterone receptor, HER2, and Ki-67 histochemical scores.
 XML Download