

 PDF
PDF ePub
ePub Citation
 Print
Print


INTRODUCTION
Mammography is the gold standard imaging tool for breast cancer screening and has reduced the mortality by as much as 30% [1-3]. Although mammography is the screening method of choice, its sensitivity ranges from 70% to 90%, depending on image quality and experience of the interpreting radiologist [4-6]. Improvements in image quality and radiologist accuracy could increase the overall sensitivity and potentially result in further reduction of the mortality rate. Compared to screen-film mammography, digital mammography has greater contrast resolution, less noise, and wider latitude. Images are immediately available [7,8], allowing the repetition of a suboptimal image without another patient visit. Despite these advantages, its adoption has been slow [7]. The Digital Mammographic Imaging Screening Trial reported that digital mammography was more accurate than screen-film mammography when it was used in women who were younger than 50 years of age, women who had dense breast tissue, or women who were perimenopausal [9,10]. At the same time, in light of the findings of several studies that double readings can increase radiologist sensitivity by 5% to 15% [11,12], computer-aided detection (CAD) has been developed to reduce false negative interpretations [13]. While digitization of film-screen images, with the attendant loss of information, is necessary before CAD can be implemented, CAD can be directly applied to digital images [14].
It is well established that CAD systems have helped to reduce the rate of false negative interpretations for the detection of masses and calcifications [13]. Most studies of CAD have involved screening mammography or screening-detected cancer patients. Because CAD has been developed to reduce missed breast cancers in screening mammography, studies involving its use in diagnostic mammography are rare. Because the imaging findings and characterization of breast cancers detected by diagnostic mammography are similar to those detected by screening, there may be similar improvement of the sensitivity of diagnostic mammography with CAD.
In this study, we analyzed the sensitivity of CAD applied to both screening and diagnostic digital mammography. We divided the patients into asymptomatic and symptomatic groups and evaluated the mammographic sensitivity according to breast tissue density, histopathological type of the breast cancer,
and tumor size.
METHODS
The Institutional Review Board approved (XC12EIMI0142O, XC12EIMI0142H) this study and required neither patient approval nor patient informed consent for the review of their images and records.
We retrospectively analyzed digital mammography and CAD images of 214 breast cancers in 210 patients who were diagnosed with breast cancer in 1 of 2 participating hospitals using the same model of digital mammography machine (Lorad Selenia; Hologic Inc., Bedford, USA) between August 2007 and July 2009. Mediolateral oblique and craniocaudal images of the involved side were obtained for each case. The CAD system R2 Image Checker version 8.1 (R2 Technology, Sunnyvale, USA) was used. This system marks suspected mass lesions with an asterisk (*), calcifications with a triangle (▲), and masses with calcifications with a cross (+). The patients in the asymptomatic group had no symptoms in their breasts and had undergone mammography for breast cancer screening. The patients in the symptomatic group had undergone diagnostic mammography for palpable lump, localized pain, or pathologic nipple discharge (unilateral breast, spontaneous, single-orifice, nonmilky discharge).
According to the American College of Radiology Breast Imaging Reporting and Data System (BI-RADS) [15], breast composition was classified into 4 different patterns according to the percentage of fat and tissue density: fatty breast tissue (P1) having less than 25% glandular densities; scattered fibroglandular tissue (P2) having approximately 25% to 50% glandular densities; heterogeneously dense breast tissue (P3) having approximately 51% to 75% glandular densities, and able to obscure the detection of small masses; and extremely dense breast tissue (P4) having more than 75% glandular densities, and able to lower the sensitivity of mammography.
Tissue diagnosis was made using 14-gauge core needle biopsy or surgical excision. According to histopathological type, the breast cancers were categorized as invasive ductal carcinoma, not otherwise specified (IDC-NOS) (78%, 167 cases), ductal carcinoma in situ (DCIS) (16.8%, 36 cases), invasive lobular carcinoma (ILC) (0.1%, 2 cases), and other types (4.2%, 9 cases), including 3 cases of mucinous carcinoma and one case each of medullary carcinoma, papillary carcinoma, tubular carcinoma, malignant neurilemmoma, lymphoma, and undifferentiated carcinoma.
The cancers were divided by size into those smaller than 1 cm, between 1 and 2 cm, and larger than 2 cm in diameter. The number of CAD markers in each patient and the false negative rate were also assessed. Two breast radiologists, with 5 and 7 years of experience in breast imaging, analyzed the digital mammographic images. They were blinded to the location, size, and histopathological type of the cancer. The CAD was judged as true positive if the software placed a CAD marker on the lesion and as false negative if a CAD marker was not placed. We also determined whether the 2 breast radiologists could detect the lesions that CAD missed.
Clinical data were described by frequencies and percentages. We presented CAD sensitivities according to breast density and compared using chi-square test for CAD sensitivities according to histopathology type. Also, trend test was performed on computer-aided detection sensitivities according to cancer size. All data were analyzed using SAS (version 9.2, SAS Institute Inc., Cary, USA) and p-value of less than 0.05 was considered statistically significant.
RESULTS
There were 41 breast cancers in the 40 patients in the asymptomatic group and 173 breast cancers in 170 patients in the symptomatic group. CAD marked 186 of 214 (86.9%) cancers: 150 of 173 (86.7%) in the symptomatic group and 36 of 41 (87.8%) in the asymptomatic group. CAD markers indicated masses in 35% of cases (59.3% of which were true positive), calcifications in 50% (38.7% true positive), and masses with calcifications in 15% marker (91.1% true positive).
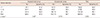
Sensitivity of CAD according to breast tissue density
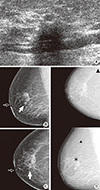
CAD in the asymptomatic group detected 36 of 41 breast cancers (87.8%). It detected 5 of 5 breast cancers (100%) in the BI-RADS P1 pattern, 8 of 9 cancers (88.9%) in the BI-RADS P2 pattern (Figure 1), 17 of 18 cancers (94.4%) in the BI-RADS P3 pattern, and 6 of 9 cancers (66.7%) in the BI-RADS P4 pattern.
CAD detected 150 of 173 breast cancers (86.7%) in the symptomatic group. It detected 19 of 21 cancers (90.5%) in the BI-RADS P1 pattern, 45 of 50 cancers (90%) in the BI-RADS P2 pattern, 71 of 82 cancers (86.6%) in the BI-RADS P3 pattern, and 15 of 20 cancers (75%) in the BI-RADS P4 pattern.
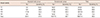
The sensitivity of CAD in parenchymal patterns P1 to P4 were 100%, 88.9%, 94.4%, and 66.7% in the asymptomatic group (p=0.207) and 90.5%, 90%, 86.6%, and 75% in the symptomatic group (p=0.141), respectively (Table 1). The difference between the CAD sensitivity in P1-P3 and P4 cancers seemed large, but this difference was not statistically significant (p=0.245 in the asymptomatic group and p=0.098 in the symptomatic group).
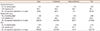
Sensitivity of CAD according to histopathological type
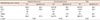
According the histopathologic type of breast cancer, CAD detected 28 of 31 IDC-NOS (90.3%) and 8 of 9 DCIS (88.9%) cases in the asymptomatic group (p=0.18). In the symptomatic group, CAD detected 120 of 136 IDC-NOS (88.2%), 24 of 27 DCIS (88.9%), and 6 of 8 other types of cancers (75%); it did not detect 2 of 2 ILC cases (p=0.002) (Table 2).
Sensitivity of CAD according to tumor size
When analyzed according to tumor size, the sensitivities of CAD in the asymptomatic group were 81.8% (9 of 11) for tumors smaller than 1 cm, 88.2% (15 of 17) for tumors between 1 and 2 cm and 92.3% (12 of 13) for tumors larger than 2 cm (p=0.533). The sensitivities of CAD in the symptomatic group were 83.3% (10 of 12) for tumors smaller than 1 cm, 82.4% (42 of 51) for tumors between 1 and 2 cm and 89.1% (98 of 110) for tumors larger than 2 cm (p=0.274) (Table 3). There was no significant difference between the 2 groups.
CAD markers and accuracy
In the asymptomatic group, there were 1.32 mass markers per image, 1.92 calcification markers per image, and 0.12 mass-with-calcification markers per image. Their true positive rates were 63.5%, 40.6%, and 80%, respectively. In the symptomatic group, there were 1.36 mass markers per image, 2.04 calcification markers per image, and 0.44 mass-with-calcification markers per image. Their true positive rates were 58.4%, 58.2%, and 91.9%, respectively (Table 4). The numbers of mass markers and calcification markers were similar between groups, but there were more mass-with-calcification markers in the symptomatic group, and most of them were judged to be true positives.
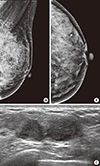
CAD failed to mark 28 of 214 breast cancers (13.1%), including 5 of 41 cancers (12.2%) of the asymptomatic group and 23 of 173 cancers (13.3%) of the symptomatic group (Figure 2). When 2 experienced radiologists, blinded to the location of the cancer or the histopathological type, reviewed the digital mammography images, 22 of 28 cancers (78.6%) that the CAD system missed were identified. The radiologists missed 3 breast cancers from 3 patients graded BI-RADS P4 in the asymptomatic group and 3 breast cancers from 3 patients with P3 or P4 pattern in the symptomatic group (Figure 3).
DISCUSSION
Mammography is currently the modality of choice for screening for breast cancer, and mammographic screening has been shown to be associated with a 30% reduction in mortality [16,17]. However, the sensitivity of this method has been inconsistent, and it produces a high proportion of false negatives. CAD systems were developed to overcome the low sensitivity of screening mammography. This study aimed to compare the performance of CAD in screening mammography with its performance in diagnostic mammography in a case mix with varying degrees of fibroglandular tissue, varying tumor size, and varying tumor histopathologic subtype. The detectability rate of CAD was expected to be lower in the cases with dense breast tissue than that in the cases with fatty breast tissue, but there was no statistically significant difference in lesion detectability among the different BI-RADS patterns. The density of breast tissue is an important factor in the sensitivity of mammography, and the false negative rate is high in mammograms of dense breasts [4,18-20]. Although CAD has increased the sensitivity of mammography [6,13,21], there has been little data about whether the sensitivity of CAD is affected by the density of breast tissue. Brem et al. [18] reported that breast density does not affect the overall CAD detection of breast cancer, but does affect the detection of breast cancers manifesting as masses. Additionally, the previous authors detected no statistically significant difference in breast cancer detection between dense and fatty breasts. Yang et al. [22] reported similar sensitivities of CAD in fatty breasts and dense breasts (95% and 98%, respectively) in a study of asymptomatic patients. These two studies classified breast tissue into only two groups, fatty and dense, and showed the sensitivities of CAD were not affected by the density of breast tissue. Ho and Lam [23], using the BI-RADS classification, reported the sensitivities of CAD in P1 to P4 as 93.3%, 93.9%, 84.8%, and 64.3%, respectively. Our results were similar: 100%, 88.9%, 94.4%, and 66.7% in the asymptomatic group and 92.3%, 89.8%, 88%, and 72% in the symptomatic group, respectively. The sensitivities of CAD in P1 to P3 pattern were similar to those found in previous studies but trended lower in P4 pattern, though not to a statistically significant extent. We think this is due to the small number of P4 cases. Studies with large sample sizes in each BI-RADS density pattern will be required to fully evaluate the effectiveness of CAD in different densities.
According to histopathological type, the sensitivity to detect IDC-NOS (90.3%) and DCIS (88.9%) was high in the asymptomatic group, and the sensitivity to detect IDC-NOS (88.2%) and DCIS (88.9%) was still relatively high in the symptomatic group. These are in agreement with the results of other studies, which have reported 85% to 96% sensitivity for detection of IDC-NOS and 93% to 95% sensitivity for detection of DCIS [24,25]. There were two ILCs in the symptomatic group in this study, but neither was identified by the CAD system. The detection rate of ILC in mammography is generally low because their appearance is quite subtle [26-28]. Several studies using CAD systems reported ILC detection rates greater than 90%, and judged the CAD systems to be extremely useful [24,25,29]. Although the CAD system in this study failed to detect the ILCs, the breast radiologists detected both of them. CAD also failed to detect a malignant neurilemmoma in the asymptomatic group and a mucinous carcinoma in a P4 breast, and a lymphoma in a P2 breast in the symptomatic group. These three cancers were also identified by both breast radiologists. The number of cases is too small to draw conclusions about the role of CAD in these unusual diagnoses.
When analyzed according to tumor size, the sensitivities of CAD to detect cancers smaller than 1 cm in the asymptomatic group and the symptomatic group were 81.8% and 83.8%, the cancers between 1 and 2 cm were 76.5% and 82.4%, and the cancers larger than 2 cm were 91.7% and 89.1%, respectively. The sensitivity for each tumor size was similar between the groups. The sensitivity for detecting cancers larger than 2 cm was slightly higher than the other sizes but not to a statistically significant degree. These data agree with several previous studies, which reported sensitivities of CAD of 83% to 92% in cancers smaller than 1 cm, 93% to 100% in cancers between 1 and 2 cm, 100% in cancers between 2 and 3 cm and 53% to 88% in cancers larger than 3 cm [24].
In both group, there were approximately 1.45 false positive markers per patient. The CAD system placed more calcification markers than any other marker type, and there were more false positive calcification markers than the other 2 types. There were fewer mass-with-calcification markers than the other two, but that included a higher percentage of true positives. The number of false positive markers in this study was smaller than previous studies (2.3-5.2 per case) [19,22,24,25].
This study has the following limitations. First, we included only breast cancer cases and excluded normal mammograms. There was unequal representation of the four BI-RADS patterns of breast density: the sample included many P2 and P3 cases but few in P1 or P4. The sensitivity of CAD can be affected by such imbalanced sample sizes, as the density of breast tissue is one of the most influential factors on the sensitivity of mammography. It is possible that the efficacy of the CAD system was underestimated, because the sample was skewed to produce a higher rate of false negatives.
In conclusion, after dividing patients into asymptomatic and symptomatic group and determining the sensitivity of CAD applied to digital mammography, we found that. CAD showed similar sensitivities between the symptomatic and asymptomatic groups in detecting different sizes of IDC-NOS or DCIS lesions in tissue of varying density.

 XML Download