

 PDF
PDF ePub
ePub Citation
 Print
Print


INTRODUCTION
Although 5-year survival rate of breast cancer is relatively high, the recurrence rate of it is also high (about 20% to 30%, depending on stage) [1]. One of the major challenges in breast cancer management is to classify patients into correct risk groups, for better treatment and follow-up planning. Appropriate risk assessment is critically important, not only to avoid breast cancer recurrence, but also to optimize patient's health and the use of medical resources. A variety of prediction models for breast cancer prognosis have been developed and utilized. These can be categorized as international treatment guidelines, gene expression profiles and computer-based risk calculators [2]. However all of these approaches have their own strength and weakness.
International treatment guidelines, including St. Gallen guidelines, were prepared by the clinical expert panels. Since 1978, the St. Gallen international expert consensus proposed St. Gallen guidelines for the selection of the optimal adjuvant systemic treatments for each specific patient group [3,4]. By the guideline, adjuvant chemotherapy is the recommended treatment for patients with lymph node-negative breast cancer. In spite of its simplicity to be applied in clinical setting, ethnic differences have been noted in the prognosis of lymph node-negative breast cancer. Iwamoto et al. [5] demonstrated that the prognoses of patients with lymph node-negative breast cancer in Japan tended to be more positive than those of their Western counterparts. Thus, they concluded that the use of St. Gallen guidelines may result in overtreatment [5-8].
Microarray technology is increasingly contributing to our understanding of cancer biology, specifically via the study of gene expression. Gene expression profiles, including Oncotype DX (Genomic Health Inc., Redwood City, USA) and Mamma-Print (Agendia, Amsterdam, The Netherlands) allow for a more quantitative and rationalized approach to individualized breast cancer treatments, by identifying gene activity patterns. MammaPrint is a commercial gene-expression diagnostic test that employs a 70-gene prognostic signature to classify the recurrence of breast cancer, as low-risk or high-risk [9,10]. However, MammaPrint is rather expensive, and is constrained to women with age 61 years or younger with primary invasive breast cancer of tumor size <5 cm, stage 1 or 2, and up to 3 positive lymph nodes. Both Oncotype DX and MammaPrint are also limited in that they assign almost all estrogen receptor (ER)-negative patients into high-risk group [11].
The Nottingham prognostic index (NPI) and Adjuvant! Online are computer-based models used for the prognosis of breast cancer recurrence [12-18]. The NPI is based on multivariate analysis, and has been employed broadly in clinical practice. However, the NPI employs only three prognostic factors (tumor size, tumor grade, and lymph node status) [12]. Adjuvant! Online is a web-based software application that calculates patients' 10-year survival probability, which is based on the patient's age, tumor size, grade, ER status, and nodal status [13].
The regression analysis is one of the most widely used multivariate analysis method, assuming linear relationships between the independent and dependent variables. However, it has been demonstrated that much of biomedical variables are non-linear in nature. Thus, regression method cannot be readily adapted to non-linear problems [19]. The support vector machine (SVM) method was recently suggested by Cortes and Vapnik [20]. It has been well established that SVM evidences superior prediction performance in both linear and non-linear problems [21]. The SVM is a firmly established data mining algorithm, which is widely used in a variety of fields, not only in the biomedical area, but also in the fields of engineering [22,23]. Despite its superior prediction performance, the SVM is relatively unfamiliar to the prognostic model field for cancer. Brief descript of SVM is provided in the methods section. However, detailed description of it is quite complex and requires long lists of sequential equations and notations, which are quite beyond the scope of this journal.
The aims of this study were to develop a novel prognostic model, which is based on SVM named 'breast cancer recurrence prediction based on SVM (BCRSVM)' for the prediction of Korean breast cancer recurrence within 5 years after breast cancer surgery, and to compare the predictive performance of the model with the previously established models, including Adjuvant! Online, NPI, and St. Gallen guidelines. We also identified relevant prognostic factors in breast cancer patients after surgical interventions, and calculated the importance of the prognostic factors by normalized mutual information [24].
METHODS
Study population
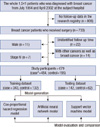
This study used a longitudinal observation data of 733 patients, whose information was maintained in a breast cancer center of a Korean tertiary teaching hospital. A subset of 808 patients, out of the total 1,541 diagnosed, was excluded in the study group because there was no clinical data in the research registry, as a result of unidentified and/or incomplete follow-up. Identifiable personal data of the patients were removed from the data before analysis. The protocol of this study were reviewed and approved by the Ajou University Hospital Institutional Review Board (AJIRB-MED-MDB-10-226). These data were relevant to the cohorts of breast cancer patients, who underwent breast cancer surgery, between July 1994 and April 2002, with a follow-up period of at least 60 months, and a median follow-up period of 86 months. The disease-free survival was 79.9% at the 5 years follow-up from the surgery. The mean disease-free survival was 93.3±1.6 months for patients who developed recurrent breast cancer. Recurrent breast cancer includes any of ipsilateral breast tumor recurrence, contralateral breast tumor recurrence, regional lymph node metastasis and distant metastasis. Of the 733 study population, 54 subjects were excluded from the study participants, through the following exclusion criteria: male patients (11), with other multiple cancers (14), stage IV cancer (7), and unidentified follow-up time (22). Thus the resulting 679 subjects with invasive breast cancer were included in the study population (Figure 1).
Prognosis factor selection
Previously established clinical knowledge and univariate analyses were used to select relevant variables for independent variables to the prediction model. Of the 193 available variables in the data set, which were composed of administrative, epidemiologic, clinical and pathologic data, 38 clinically relevant variables were preliminarily selected by one of the authors. Through second-rounds of consensus meeting between the authors including physician, surgical pathologist and breast surgeon, 14 variables were selected. Although the use of established clinical knowledge is one of the most representative methods for preliminary screening of independent variable selection, however, this would introduce a significant bias in the selection process. Therefore, as a final stage of variable selection, univariate analyses based on Kaplan-Meier analysis for categorical variables and univariate Cox regression for continuous variables were applied. Resulting statistically significant (p-value <0.05) variables included histological grade, local invasion of tumor, number of tumors, tumor size, lymphovascular invasion (LVI), ER status, and the number of metastatic lymph. 'Local invasion of tumor' was defined as not only immovability of tumor at palpation, due to chest wall fixation through pathological direct tumor invasion, but also radiologically suspicious invasion to pectoralis muscle or skin. LVI was defined as the unequivocal presence of tumor cells within any of endothelial-lined space in the breast tissue around the invasive carcinoma. All of the 7 variables were employed to the construction of the prediction model.
Selection of data mining algorithm
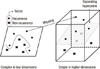
Although many data mining algorithms have been developed, this study entailed a comparison of the SVM, artificial neural network (ANN), and traditional Cox-proportional hazard regression model (Cox regression). The primary purpose of the SVM is to minimize the upper boundary of the generalization error by maximizing the margin by the decision boundary, called the hyperplane, which separates the subjects of one class (or group) from another, and by minimizing the empirical classification error by taking into consideration the inherent complexity of the model. The SVM employs a non-linear mapping to transform the original training data into higher-dimensional data and searches for the linear optimal separating hyperplane within this new dimension. With appropriate non-linear mapping to a sufficiently high dimension, a decision boundary can separate data into two classes (Figure 2). The SVM finds this decision boundary using support vectors and margins. In this study, the goal of SVM modeling is to classify patients who have high risk of breast cancer recurrence. The result of this classification shows recurrence probability of breast cancer within 5 years after breast cancer surgery. The ANN is a traditional data mining algorithm, and is employed extensively in a variety of clinical areas [25]. Usually SVM or ANN does not consider time-to-event. However, several approaches have been proposed to analyze data with time-to-event. The present study used single time-point approach for the output prediction of breast cancer recurrence within 5 years after the breast cancer surgery. This approach can be used to produce the estimates of outcome at a specific time of follow-up. The status (dependent) variable has either recurrent or non-recurrent within 5 years of follow-up. The Cox regression is a standard statistical model that reveals the relationships between different prognostic factors and patient survival on the basis of time-to-event. All of the selected 7 variables were entered into the Cox regression model. Clementine 12 (SPSS Inc., Chicago, USA) was employed for model construction and comparison.
Previously established recurrence prediction models
To compare the performance of the proposed models, 3 previously well-known prediction or classification models were selected: St. Gallen guidelines, NPI, and Adjuvant! Online. The International Consensus Panel, which was developed during the 2009 St. Gallen Conference, defines low clinical-risk factors, as node-negative, positive ER and positive progesterone receptors (PR), histological grade 1, low proliferation, no peritumoral vascular invasion, and tumor size of ≤2 cm [4]. Because PR, proliferation and peritumoral vascular invasion were unavailable in our data set, the 4 available factors were considered in this study.
The NPI is a prognostic model based on tumor size, histological grade, and lymph node status. The NPI point calculation equation is as follows: tumor size (cm)×0.2+histological grade+lymph node point (negative nodes=1; 1-3 positive nodes=2; ≥4 positive nodes=3). The patients were divided, according to NPI points, into the low-risk (NPI point <3.4) and high-risk groups (NPI point ≥3.4) [12].
Adjuvant! Online is a computer-based prognostic model that can be used to estimate the risk of breast cancer recurrence and death. Patients were divided into a low-risk (recurrence probability <30%) and a high-risk group (recurrence probability ≥30%), using Adjuvant! Online for comparison with other prognostic models.
Prediction model validation and comparison
The holdout method was employed to reduce overfitting in the model and to derive a reliable estimate of the performance of the model. The holdout method randomly splits the entire data sample into two mutually exclusive training set (70%) and testing set (30%). The training set was utilized to generate the prediction model and the remaining 30% of the data (testing set) was employed to estimate the model's accuracy. The accuracy, sensitivity, specificity, positive predictive value (PPV), negative predictive value (NPV), area under the curve (AUC), and Kaplan-Meier analysis of each of the models were calculated for performance comparison between the proposed BCRSVM, Adjuvant! Online, NPI, and St. Gallen.
Estimation of prognostic factor importance by normalized mutual information index
The normalized mutual information index (NMI), which is based on mutual importance, in addition to its role in calculating the correlation coefficient, is also used to determine the importance of an explanatory prognostic factor for the prediction of recurrence [24,26,27]. Mutual information is a quantitative measure for the mutual dependence of the variables. In the biomedical field, it is also employed to find functional genomics clusters in the RNA expression data [27]. We computed the entropy of the prediction results of breast cancer recurrence and the mutual information between prognostic factor patterns for prediction results, after which, the calculated mutual information was normalized. The expected fraction of uncertainty reduction, due to prognostic factors, is the NMI. This NMI ranges between 0 and 100%. If the NMI approaches to 100%, then the 2 variables are profoundly related in some form, either linearly or nonlinearly.
Statistical analysis
Disease-free survival (DFS) curves were estimated by the Kaplan-Meier method, and were compared using the log-rank test. The p-values of all statistical tests were two-tailed, and p-values equal to or less than 0.05 were employed to evaluate statistical significance. SPSS version 18.0 software (SPSS Inc., Chicago, USA) and R package (R Development Core Team, 2010) were used for all statistical analyses.
RESULTS
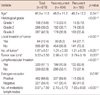
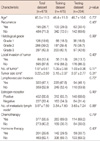
The clinicopathologic findings of the study participants are listed in Table 1. The mean age was 46.5±11.5. The mean tumor size and number of tumors were 3.22±2.50 cm and 1.07±0.51 cm, respectively. There was a total of 197 of the 679 cases (28.6%) recurred during the study period. Statistically significant difference between the training data set (n=475) and test data set (n=204) was not found (Table 2).
The selected prognostic factors were as follows: histological grade, local invasion of tumor, number of tumors, tumor size, LVI, ER, and number of metastatic lymph nodes. The clinicopathologic features differed significantly between the recurrent and the non-recurrent groups (Table 1).
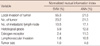
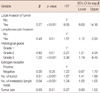
The significance of the selected prognostic factors was compared. Local invasion of tumor was identified unanimously among the 3 algorithms, as the most important factor in the prediction of recurrence (Tables 3, 4). In the SVM and ANN algorithms, local invasion of tumor (NMI: 55.3%, 21.5%), number of tumors (NMI: 23.2%, 21.5%), number of metastatic lymph nodes (NMI: 10.5%, 17.1%), the histological grade (NMI: 5.9%, 11.5%), ER (NMI: 2.4%, 11.5%), LVI (NMI: 1.8%, 10.8%), and tumor size (NMI: 0.9%, 4.8%) affected the models for the prediction of breast cancer recurrence. For the Cox regression, histological grade, local invasion of tumor, number of tumors, LVI, and number of metastatic lymph nodes were associated with higher likelihoods of recurrence (Table 4).
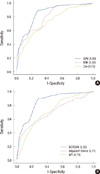
On the basis of accuracy and AUC, SVM outperformed the ANN and Cox regression algorithms (accuracy=84.6%, 81.4%, and 72.6%; AUC=0.85, 0.80, and 0.73, respectively) (Table 5, Figure 3A).
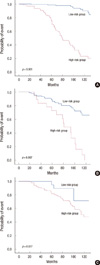
Owing to its superb performance, we developed a prediction model based on SVM for predicting the recurrence of breast cancer, and named it as BCRSVM. The BCRSVM model was then compared with other well-established prognostic models. The BCRSVM proved superior to other models (AUC=0.85). Adjuvant! Online and NPI evidenced similar AUC (0.70, 0.71, respectively) (Table 5). As the St. Gallen guidelines could divide patients only into low- and high-risk groups, the AUC could not be calculated. Its sensitivity and NPV were both 1, but its specificity and PPV were quite low (0.01, 0.13, respectively). Receiver operating characteristic (ROC) curves for each model, except for St. Gallen, are plotted in Figure 3B. The DFS estimated by the Kaplan-Meier curve revealed better discrimination of the high-risk group from the low-risk group in the BCRSVM than in the Adjuvant! Online or NPI models (Figure 4). Since the low-risk group identified via the St. Gallen guidelines included only 2 patients, the DFS curves constructed via St. Gallen guidelines could not be plotted.
DISCUSSION
This study compared a variety of machine learning algorithms to develop a novel prognostic model that is superior to that of the previously employed models for the prognosis of breast cancer recurrence. Among the various machine learning algorithms, the SVM proved superior to that of the other algorithms utilized herein. Comparing the BCRSVM based on SVM with Adjuvant! Online, St. Gallen, and NPI, the BCRSVM demonstrated superior performance. These results reveal that the BCRSVM may prove to be an effective method for the prediction of breast cancer recurrence.
In spite of the superior performance of machine learning algorithms, use of such algorithms in daily clinical practice has been quite limited, because they cannot be easily calculated with traditional calculator. For the convenience of clinicians interested in the BCRSVM, we developed a tool realizing the BCRSVM and embedded it in the webpage (http://ami.ajou.ac.kr/bcr/), as shown in Figure 5.
For non-linear modeling, ANN was proposed as a supplement or alternative to the Cox regression [14-16]. Recently, SVM has been employed for non-linear modeling in a variety of fields, most notably bioinformatics [22,23]. The SVM has been well established in the field of machine learning, but is almost completely unknown, as a cancer predictive and prognostic method. Thus far, no prognostic models based on clinicopathologic data using SVM have been developed. The SVM was first proposed by Cortes and Vapnik [20], and was identified as a type of a universal feed forward network. It provides us with a mathematical understanding of the inputs, for which the learning method is employed. SVM also evidences the relatively of high recognition ability for practical problems. In particular, the SVM method is particularly well suited to problems of a non-linear nature. The SVM helps to create a high degree of feature space to linearize the non-linear input spaces, and suggests an optimal segregation aspect for each feature [22]. One important advantage of the SVM is that the computational complexity, which is inherent to SVM, can be reduced via a quadratic optimization problem. SVM tends to be less prone than ANN to over-fitting problems. Owing to these advantages, the BCRSVM based on SVM (AUC=0.85) also evidenced performance superior to that of the ANN-based (AUC=0.80) and the Cox regression-based model (AUC=0.73).
Seven prognostic factors in the BCRSVM were selected, and their importance was calculated by NMI (Table 4). Histological grade, tumor size, and number of metastatic lymph nodes were employed for all other prognostic models, including NPI, Adjuvant! Online, St. Gallen guidelines and the BCRSVM. Thus, they appear to be important and consistent prognostic factors. ER was applied as a prognostic factor in the above three models, with the exception of NPI. Local invasion of tumor and number of tumors has not previously been included in other models, except for the BCRSVM. Based on the NMI results, 'local invasion of tumor' appears to be an important prognostic factor for the prediction of recurrence, because it accounts for 55.3% and 21.5% of importance in the SVM and ANN models, respectively. Furthermore, the hazard ratio of 'local invasion of tumor' in the Cox regression model was also top-ranked (9.691). However, it was not used in other previous prognostic models, because the local invasion of tumor is a subjective measure, rather than an objective one. Thus, the variable may evoke controversy in deciding its' positivity. However, crude definition of the variable, such as defined in this study, may be possibly sufficient, as it is demonstrated in this study. The process of defining the local invasion of tumor, in a more precise and objective manner, seems to be yet another challenge that remains ahead, or another model using purely objective variables may be required. ER status and tumor size are well known prognostic factors, however they were not significant at the Cox regression model. Discrepancy of prognostic factors between prognostic score systems, based on multivariate analysis, are not unusual, because of the effects of other prominent covariates or multi-collinearities between the variables. Possible differences in the characteristics of study participants, between the studies, may be one of the causes.
We compared and validated the prognostic accuracy of the SVM and ANN models to those of the other models, including Adjuvant! Online, St. Gallen guidelines, and NPI. The St. Gallen guidelines evidenced the highest levels of sensitivity and NPV. However, via the application of the 2009 St. Gallen guidelines to test the dataset (n=204), only 2 patients were allocated to the low-risk group. In the previous study of Ishitobi et al. [28], the proportion of low-risk patients, according to the 1998 and 2009 St. Gallen guidelines, were 0% and 7%, respectively. Additionally, in other studies, only 10% of patients were classified as low-risk [7,29]. This discrepancy in the population of the high-risk group could result in overtreatments in clinical practice [6-8,28]. Jung et al. [6] reported that only a few patients could avoid adjuvant chemotherapy via the strict application of St. Gallen guidelines. Although the NPI employs only three prognostic factors (tumor size, tumor grade, and lymph node status), its AUC was ranked similarly to that of Adjuvant! Online. Although the NPI evidenced an AUC similar to that of Adjuvant! Online, the discrepancy in the prediction values was due to the threshold value, which is used to demarcate the low-risk and the high-risk groups. It may be necessary, in future studies, to make efforts to readjust the threshold values. Adjuvant! Online is a well-known web-based prognostic model, and was validated using external data [13,18]. We also attempted to validate Adjuvant! Online using our dataset, as Adjuvant! Online has yet to be validated in Korea. The AUCs of Adjuvant! Online were 0.66 [9] and 0.66 [30], respectively. In our study, the AUC of Adjuvant! Online was 0.70, which is similar to or somewhat higher than the previous results. The AUC of the BCRSVM (0.85) was higher than that of Adjuvant! Online (0.7) or NPI (0.71). It also exhibited relatively high predictive values for other indicators (Table 5).
Regarding the superior performance of the BCRSVM, relative to other models, several points could be considered. The BCRSVM, which involves the SVM algorithm, utilizes more factors than Adjuvant! Online or NPI. Additionally, as we employed only one hospital's data for model development and evaluation, the BCRSVM might be adjusted to our data. Therefore, in future studies, it will be necessary to validate the BCRSVM with external data, such as that acquired from other hospitals. The BCRSVM's parameters can be readily adjusted with different subject populations. It may prove beneficial to adjust prognostic models of breast cancer recurrence for each race or country, rather than imposing a universal predictive model for each. The study was also limited by the possible selection bias, which is related with the exclusion of 808 patients, who had no follow-up in the research registry.
In this study, the BCRSVM based on SVM for breast cancer recurrence was developed, and its performance was compared with that of the other prognostic models. The BCRSVM could be easily employed to assist clinicians and patients in making decisions, regarding breast cancer treatment through internet connection to the webpage (http://ami.ajou.ac.kr/bcr). The authors are currently preparing to conduct a study that would externally validate such results, with those from other hospitals.


 XML Download