

 PDF
PDF ePub
ePub Citation
 Print
Print


INTRODUCTION
The estrogen receptor (ER), progesterone receptor (PR), and HER2 have been clinically and statistically proven to be of prognostic value in breast cancer and have been useful in clinical management.(1,2) Laboratory testing for ER/PR is an established procedure in the routine treatment of patients with breast cancer, primarily to predict responses to hormonal therapy, which has been shown to improve overall survival and disease-free survival.(3,4) For a decade, immunohistochemistry (IHC) for ER/PR has been considered to be the gold standard; however, well-known limitations exist that can lead to inaccurate results in up to 20% of total cases.(5,6) These results tend to be influenced by tissue fixation status, the use of various primary antibodies and detection systems, and interpretation methods. In the American Society of Clinical Oncology (ASCO) 2007 update, the committee acknowledged the deficits in the standardization of ER and PR assays and made further efforts to identity the defining of reproducibility and accuracy for particular reagents as important priorities.(4)
Since the late 1990s, mRNA levels of ER and PR in fresh cancer tissue have been measured by RT-PCR and these results have shown good correlation with the results measured by ligand binding assay or IHC. The benefit of measuring mRNA of ER in patients with breast cancer in addition to performing IHC is that it may give objective and quantitative information about ER.
The branched-chain assay QuantiGene reagent system, which is an USA Food and Drug Administration (FDA)-approved clinical diagnostic product, has been used in the US for quantitative viral load determination of HIV, hepatitis C virus and hepatitis B virus, with a detection sensitivity of <50 transcript molecules.(7-9) The QuantiGene reagent system, a sandwich nucleic acid hybridization platform in which targets are captured through cooperative hybridization of multiple probes, detects RNA directly, without either a reverse transcription step or polymerase chain reaction process.(10) It is relatively simple procedure and can be performed in a small laboratory.
Routine testing for HER2 in newly diagnosed and metastatic breast cancer cases has been recommended by the ASCO since 2001.(11,12) The recommended test algorithm for HER2 first involves IHC, and upon a score of 2, fluorescence in situ bybridization (FISH) is used for confirmation. However, about 5% of HER2 IHC 0/1+ cases are actually HER2 amplified using the FISH test, and 5-22% of HER2 IHC 3+ cases are actually HER2 non-amplified using the FISH test.(13-18) If there was a simple way to measure HER2 RNA levels as well as HER2 IHC, it would be useful for preventing the possible misclassification of HER2.
In the current study, we used the QuantiGene Reagent System to detect ER, PR, and HER2 RNA levels in formalin-fixed, paraffin-embedded (FFPE) tissue to evaluate its value as a clinical test.
METHODS
We evaluated 40 patients who had undergone breast cancer surgery between January 2008 and December 2008 at Seoul St. Mary's Hospital. Carcinoma in situ and other precancerous lesions such as ductal hyperplasia were excluded.
IHC assay for ER, PR, and HER2
Sections from whole block tissues and paraffin-embedded tissue arrays were deparaffinised and rehydrated in a graded series of alcohol. Endogenous peroxidase activity was blocked using 0.3% hydrogen peroxide and the tissue arrays were processed in an automatic IHC staining machine using standard procedures (Lab Vision autostainer; Lab Vision Co., Fremont, USA) with a DAKO ChemMate™ EnVision™ system (DAKO, Carpinteria, USA). The following antibodies were used: ER (1:100, 6F11; Novocastra, Newcastle, UK) PR (1:50, PgR636; DAKO) and HER2 (1:200, polyclonal; DAKO). The sections were visualized with 3-3'-diaminobenzidine (DAB) and counterstained with Mayer hematoxylin. The ER and PR were scored using the Allred scoring system.(5) When an Allred score of ER and PR was >2, the IHC results for ER and PR were considered positive, respectively. The HER2 expression level was classified into four groups according to the scoring guidelines of the HercepTest™.(11)
FISH for the HER2 gene
FISH was performed using the PathVysion™ HER2/CEN probe (Vysis Inc., Downers Grove, USA). A FISH ratio (HER2 gene signals to chromosome 17 signal ratio) was measured by counting at least 40 nuclei from the tumor cells. A FISH ratio of more than 2.2 was considered HER2 positive, and a FISH ratio of less than 1.8 was considered HER2 negative. A FISH ratio between 1.8 and 2.2 was considered equivocal.
The branched-chain QuantiGene 2.0 assay
Tissue homogenates were prepared according to the procedure described in the QuantiGene sample processing kit for FFPE tissues (Panomics Inc., Fremont, USA). Briefly, from 7 µm slide section, a total of 200 mm2 of tumor area was selectively dissected and incubated for 3 hr after adding 900 µL of homogenizing solution and 9 µL of proteinase K (50 µg/µL). The tissue homogenate was separated from paraffin and debris by centrifugation, and transferred to a fresh microfuge tube.
Probe design software was used to design specific oligonucleotide probe sets for target genes to be used in QuantiGene 2.0 reagent systems (Panomics Inc.). The QuantiGene 2.0 assay was performed according to the recommended protocol of QuantiGene 2.0 reagent systems (Panomics Inc.).(19) To capture target RNA from tissue homogenates, 40 µL of tissue homogenate was mixed with 33.3 µL of Lysis Mixture, l µL of Blocking Reagent, 0.3 µL of 2.0 Probe Set, and 25.4 µL of nuclease-free water. The reactions were placed in a 96-well capture plate covalently coated with capture probe oligonucleotide (5'-CACTTCA CTTTCTTTTCCAAGAG-3') and incubated for 16 hours at 55℃. Wells were washed three times with wash buffer to remove unbound material. For signal amplification and hybridization, we added 100 µL of 2.0 Pre-Amplifier Working Reagent, 100 µL of Amplifier Working Reagent and 100 µL of Label Probe Working Reagent to each well and incubated the reactions for 1 hr at 55℃, 55℃, and 50℃, respectively. To detect signal, we added 100 µL of 2.0 Substrate to each well of the capture plate and incubated the reactions for 5 min after sealing. Luminescence from each well was measured using a luminometer (Victor Light; PerkinElmer, Waltham, USA). Duplicate assays were performed for all samples and homogenizing buffer and pure RNA extracted from the breast cancer cell line MDA-MB-435 (known as ER negative(20) and HER2 non-amplified(21) were used as background and negative controls, respectively.
To verify that the resulting assay signals were linearly proportional to sample input, a two-fold dilution series of each sample was performed.
The RNA levels of ACTB, GUSB, and TBP were measured to normalize the RNA levels of ER, PR, and HER2. Normalization was done in the following manner:
Adjusted values for ER=100×(Average of values for ER-Average of values for background control)/values for reference genes*
Adjusted values for PR=1000×(Average of values for PR-Average of values for background control)/values for reference genes*
Adjusted values for HER2=100×(Average of values for HER2-Average of values for background control)/values for reference genes*
*Values for reference genes=1/3×[(Average of values for ACTB-Average of values for background control)+(Average of values for GUSB-Average of values for background control)+(Average of values for TBP-Average of values for background control)]
Statistical analysis
All statistical analyses were performed using SPSS version 15.0 (SPSS Inc., Chicago, USA) for Windows. An independent samples T test was used to compare the RNA levels of ER, PR, and HER2 between ER, PR, and HER2 IHC-negative and ER, PR, and HER2 IHC-positive samples. A Pearson correlation was used to determine correlations between Allred scores of ER and PR and RNA levels of ER and PR, respectively, and between the HER2/CEP17 ratio of HER2 FISH and RNA levels of HER2. Results were considered statistically significant at p<0.05.
RESULTS
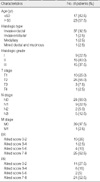
Clinicopathologic characteristics have been presented in Table 1. With regard to the age distribution, there were 17 (42.5%) patients less than 50 yr old and 23 (57.5%) patients 50 yr and older. Thirty-seven cases (92.5%) were diagnosed as invasive ductal carcinoma, not otherwise specified. Regarding histologic grade, nine cases were well differentiated (22.5%), 16 cases were moderately differentiated (40.0%) and 15 cases were poorly differentiated (37.5%). Regarding TMN stage, 10 cases (25.0%) were T1, 26 cases (65.0%) were T2, 3 cases (7.5%) were T3 and 1 case (2.5%) was T4. Twenty-four cases (60.0%) showed no lymph node metastasis and 15 cases (40%) showed lymph node metastasis.
IHC results for ER, PR and IHC and FISH results for HER2
The IHC results for ER were negative in 25% (10/40) and positive in 75% (30/40) whereas the IHC results for PR were negative in 27.5% (11/40) and positive in 72.5% (29/40) (Table 1). The IHC results for HER2 were negative (score 0 or 1) in 47.5% (19/40), equivocal that need to be confirmed by HER2 FISH (score 2) in 27.5% (11/40), and positive (score 3) in 25% (10/40). The HER2 gene was found to be amplified in 30% of cases (12 out of 40) according to FISH. When the IHC results for HER2 were negative (score 0 or 1), all of the cases were HER2 gene non-amplified (19 out of 19 cases); when the IHC results of HER2 were equivocal (score 2), 18.2% of the cases were HER2 gene amplified (2 out of 11 cases); and when the IHC results of HER2 were positive (score 3), all of the cases were HER2 gene amplified (10 out of 10 cases).
Results with QuantiGene 2.0
Normalization and reproducibility of assay
A plot of background-subtracted signals for ER and HER2 vs. the amount of sample used was made with a two-fold dilution series of the sample, and a straight line (r2≥0.95) was drawn. The coefficient of variation (CV) was measured to show assay precision. The mean CVs for ER, PR, and HER2 were 5.23 (median, 3.14; range, 0.01-22.85), 5.65 (median, 4.11; range, 0.00-18.66) and 5.37 (median, 4.22; range, 0.27-16.34), respectively.
ER, PR, and HER2
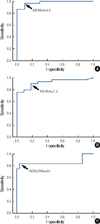
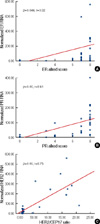
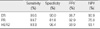
The ER RNA levels ranged from 0.07 to 1734.53. We considered the result of ER obtained from IHC to be the gold standard. The RNA levels in cases that were ER IHC-positive were significantly higher than those cases that were ER IHC-negative (176.8±344.03 vs. 2.4±2.4, p=0.01). With respect to ER RNA levels, an ROC was drawn to identify the cut-off value for negative vs. positive with the highest sensitivity and specificity (Figure 1A). With a cut-off value of 5.0 for the ER RNA level, the QuantiGene 2.0 Assay for ER showed sensitivity, specificity, positive predictive value (PPV), and negative predictive value (NPV) of 96.6%, 90%, 96.7%, and 90.9%, respectively (Table 2). The Allred scores for ER staining on whole sections were correlated with ER RNA levels (p=0.046, r=0.32; Figure 2A).
The PR RNA levels ranged from 0.00 to 399.99. We considered the PR status obtained from whole sections using Allred scoring to be the gold standard. The RNA levels in cases that were PR IHC-positive were significantly higher than those cases that were PR IHC-negative (95.3±90.2 vs. 5.4±7.3, p<0.001). For the PR RNA levels, an ROC was drawn to identify the cut-off value for negative vs. positive with the highest sensitivity and specificity (Figure 1B). With a cut-off value of 7.2 for the PR RNA level, QuantiGene 2.0 Assay for PR showed sensitivity, specificity, PPV and NPV of 89.7%, 81.8%, 92.9%, and 75%, respectively (Table 2). The Allred scores for PR staining of whole sections were correlated with PR RNA levels (p<0.001, r=0.61; Figure 2B).
The RNA levels for HER2 ranged from 0.00 to 560.0. We considered the HER2 FISH results to be the gold standard. The RNA levels of cases with amplified HER2 were significantly higher than those cases with non-amplified HER2 (219.3±166.8 vs. 20.9±16.7, p=0.00). For the HER2 RNA levels, an ROC was drawn to identify the cut-off value for negative vs. positive with the highest sensitivity and specificity (Figure 1C). With a cut-off value of 50 for the HER2 RNA level, the QuantiGene 2.0 Assay for HER2 showed sensitivity, specificity, PPV and NPV of 83.3%, 96.4%, 90.9%, and 93.1%, respectively (Table 2). The HER2 FISH ratio was correlated with HER2 RNA levels (p=0.00, r=0.75; Figure 2C).
DISCUSSION
In 1998, a final rule for classification and reclassification of immunochemistry reagents and kits was established by the FDA. As such, those IHC stains that do have accepted scientific validation (for example, in ER, there has been evidences that IHC provides results that are clinically relevant and superior to older cytosol-based methods) have been included in class II and examples cited include ER and PR.(22) Until now, IHC of ER and PR have been a practical method for measuring ER and PR for hormone therapy. However, IHC also has had well-known limitations such as issues surrounding divergent primary antibodies and the detection system as well as a lack of a standardized interpretation method. Measuring ER and PR RNA levels is another way of determining the ER/PR status for hormonal therapy, and there has been a high degree of concordance between quantitative RT-PCR and IHC (93-95%).(15) However, one important goal of ER IHC has become high sensitivity, since Harvey et al.(5) demonstrated that as few as 1% positively stained tumor cells were sufficient to predict a significant benefit from endocrine therapy. A highly sensitive ER IHC procedure resulted in a bimodal distribution of ER scores, leading to a nonlinear correlation with a ligand binding assay.(23, 24) Further, ER and PR RNA levels are continuous variables and quantitative measurement of ER levels can help predict the tamoxifen benefit in women with ER IHC-positive and node-negative breast cancer.(25) Recently Oncotype Dx® was reported to give quantitative ER and PR scores and recurrence scores, given that patients with high quantitative ER and a low recurrence score benefit the most from tamoxifen, while patients with low quantitative ER and a high recurrence score benefit less.(25) Oncotype Dx® is a good way to measure the ER RNA levels; however, it is expensive and it must be performed by a specific American-based laboratory, thus adding additional costs and turnaround times.
QuantiGene platforms, TagMan assays and Standardized RT-PCR are quantitative measurement platforms for gene expression and had been shown to have high assay specificity, detection sensitivity, and a broad linear dynamic range.(10,26,27) Knudsen et al. (28) compared QuantiGene assay system measurements in frozen tissues and FFPE tissues from the same xenografts and showed excellent reliability coefficients in both tissues, demonstrating that formalin treatment of RNA does not affect the reproducibility of the QuantiGene assay. The QuantiGene reagent system demonstrated high precision and accuracy in comparison to TaqMan in FFPE tissues.(28) and since the QuantiGene 2.0 assay does not require an RNA extraction step, it uses FFPE samples, and does not need expensive modern equipment besides a basic luminometer, it is easy to perform even in a small scale laboratory. Even though it is an FDA approved method for the quantitative measurement of infectious agents, there have been few studies performed with patients regarding the quantitative measuring of prognostic and/or predictive factors.(29) Paik et al.(29) used the QuantiGene plateform to measure HER2 mRNA in breast cancer cases with HER2 positive (tested by other laboratory) and demonstrated that HER2 mRNA levels in cases of HER2 negative (re-tested by central laboratory) were significantly lower than those in cases of HER2 positive (re-tested).
We analyzed the utility the QuantiGene 2.0 assay in measuring major tumor markers of breast cancer, ER, PR, and HER2. We used three reference genes (ACTB, GUS-B, and TBP) for normalization of QuantiGene 2.0 data.(30) The ER and PR RNA levels measured by the QuantiGene 2.0 system were reproducible, with a mean CV for ER and PR of 5.23% and 5.65%, respectively. With a cut-off value of 5.0 for the ER RNA level, the QuantiGene 2.0 Assay showed sensitivity, specificity, PPV, and NPV of 96.6%, 90%, 96.7%, and 90%, respectively; with a cut-off value of 7.2 for the PR RNA level, it showed a sensitivity, specificity, PPV, and NPV of 89.7%, 81.8%, 92.9%, and 75%, respectively. The Allred scores for ER and PR were correlated with the RNA levels (p=0.046, r=0.32 and p<0.001, r=0.61, respectively). Collins et al.(23) stained 825 cases of breast cancers by 6F11 primary antibody and showed that most cases belonged to complete negative (Allred score 0, 19%) or diffuse strong positive (Allred score 7 or 8, 80.1%). Since the most important consideration in ER IHC is correct grouping of cancers even those with low levels of ER into the ER positive, the 6F11 is a reasonable clone to use in ER IHC. In this study, we also used 6F11 primary antibody and the Allred score of ER was 0 or 7 or 8 in 87.5% and showed bimodal distribution. This would explain why the Allred scores for ER showed weak correlation with the RNA levels of ER, even though the PPV and NPV of ER QuantiGene 2.0 assay were quite high. We compared HER2 RNA levels to HER2 FISH results, which were considered to be the gold standard. With a cut-off value of 50 for the HER2 RNA level, the QuantiGene 2.0 Assay showed sensitivity, specificity, PPV, and NPV of 83.3%, 96.4%, 90.9%, and 93.1%, respectively. The HER2/CEP17 ratio for HER2 FISH was correlated with the RNA levels (p<0.001, r=0.75). Even though our study is limited by the small number of cases, we have demonstrated the possibility of a clinical use of a branched-chain assay in measuring and confirming the status of important markers such as ER, PR, and HER2. Further large-scale studies using additional available markers would clarify the usefulness of this assay.
CONCLUSION
We demonstrated that ER, PR, and HER2 RNA levels as measured by the QuantiGene 2.0 assay were reproducible and that they correlated well with IHC and FISH results. Measuring ER, PR, and HER2 RNA levels using the QuantiGene 2.0 assay, which is a simple step that can be performed in most laboratories, may be a helpful adjunct in determining the status of ER, PR and HER2 in breast cancer.
 XML Download