Abstract
Objectives
To evaluate the surgical outcomes and image by mid- sagittal MRI in patients with cervical myelopathy who were more than 70 years of age.
Summary of literature Review
Surgical outcomes of cervical myelopathy in the elderly patients were worse than in the younger patients, but decompression surgery is helpful for improving neurologic function in the elderly.
Materials and Methods
Nine patients more than 70 years of age who underwent surgery were reviewed. Neurologic deficits after surgery were assessed using a scoring system proposed by Japanese Orthopaedic A ssociation(JOA) and clinical results and morphological changes on MRI were compared with those of patients less than 70 years old age.
Results
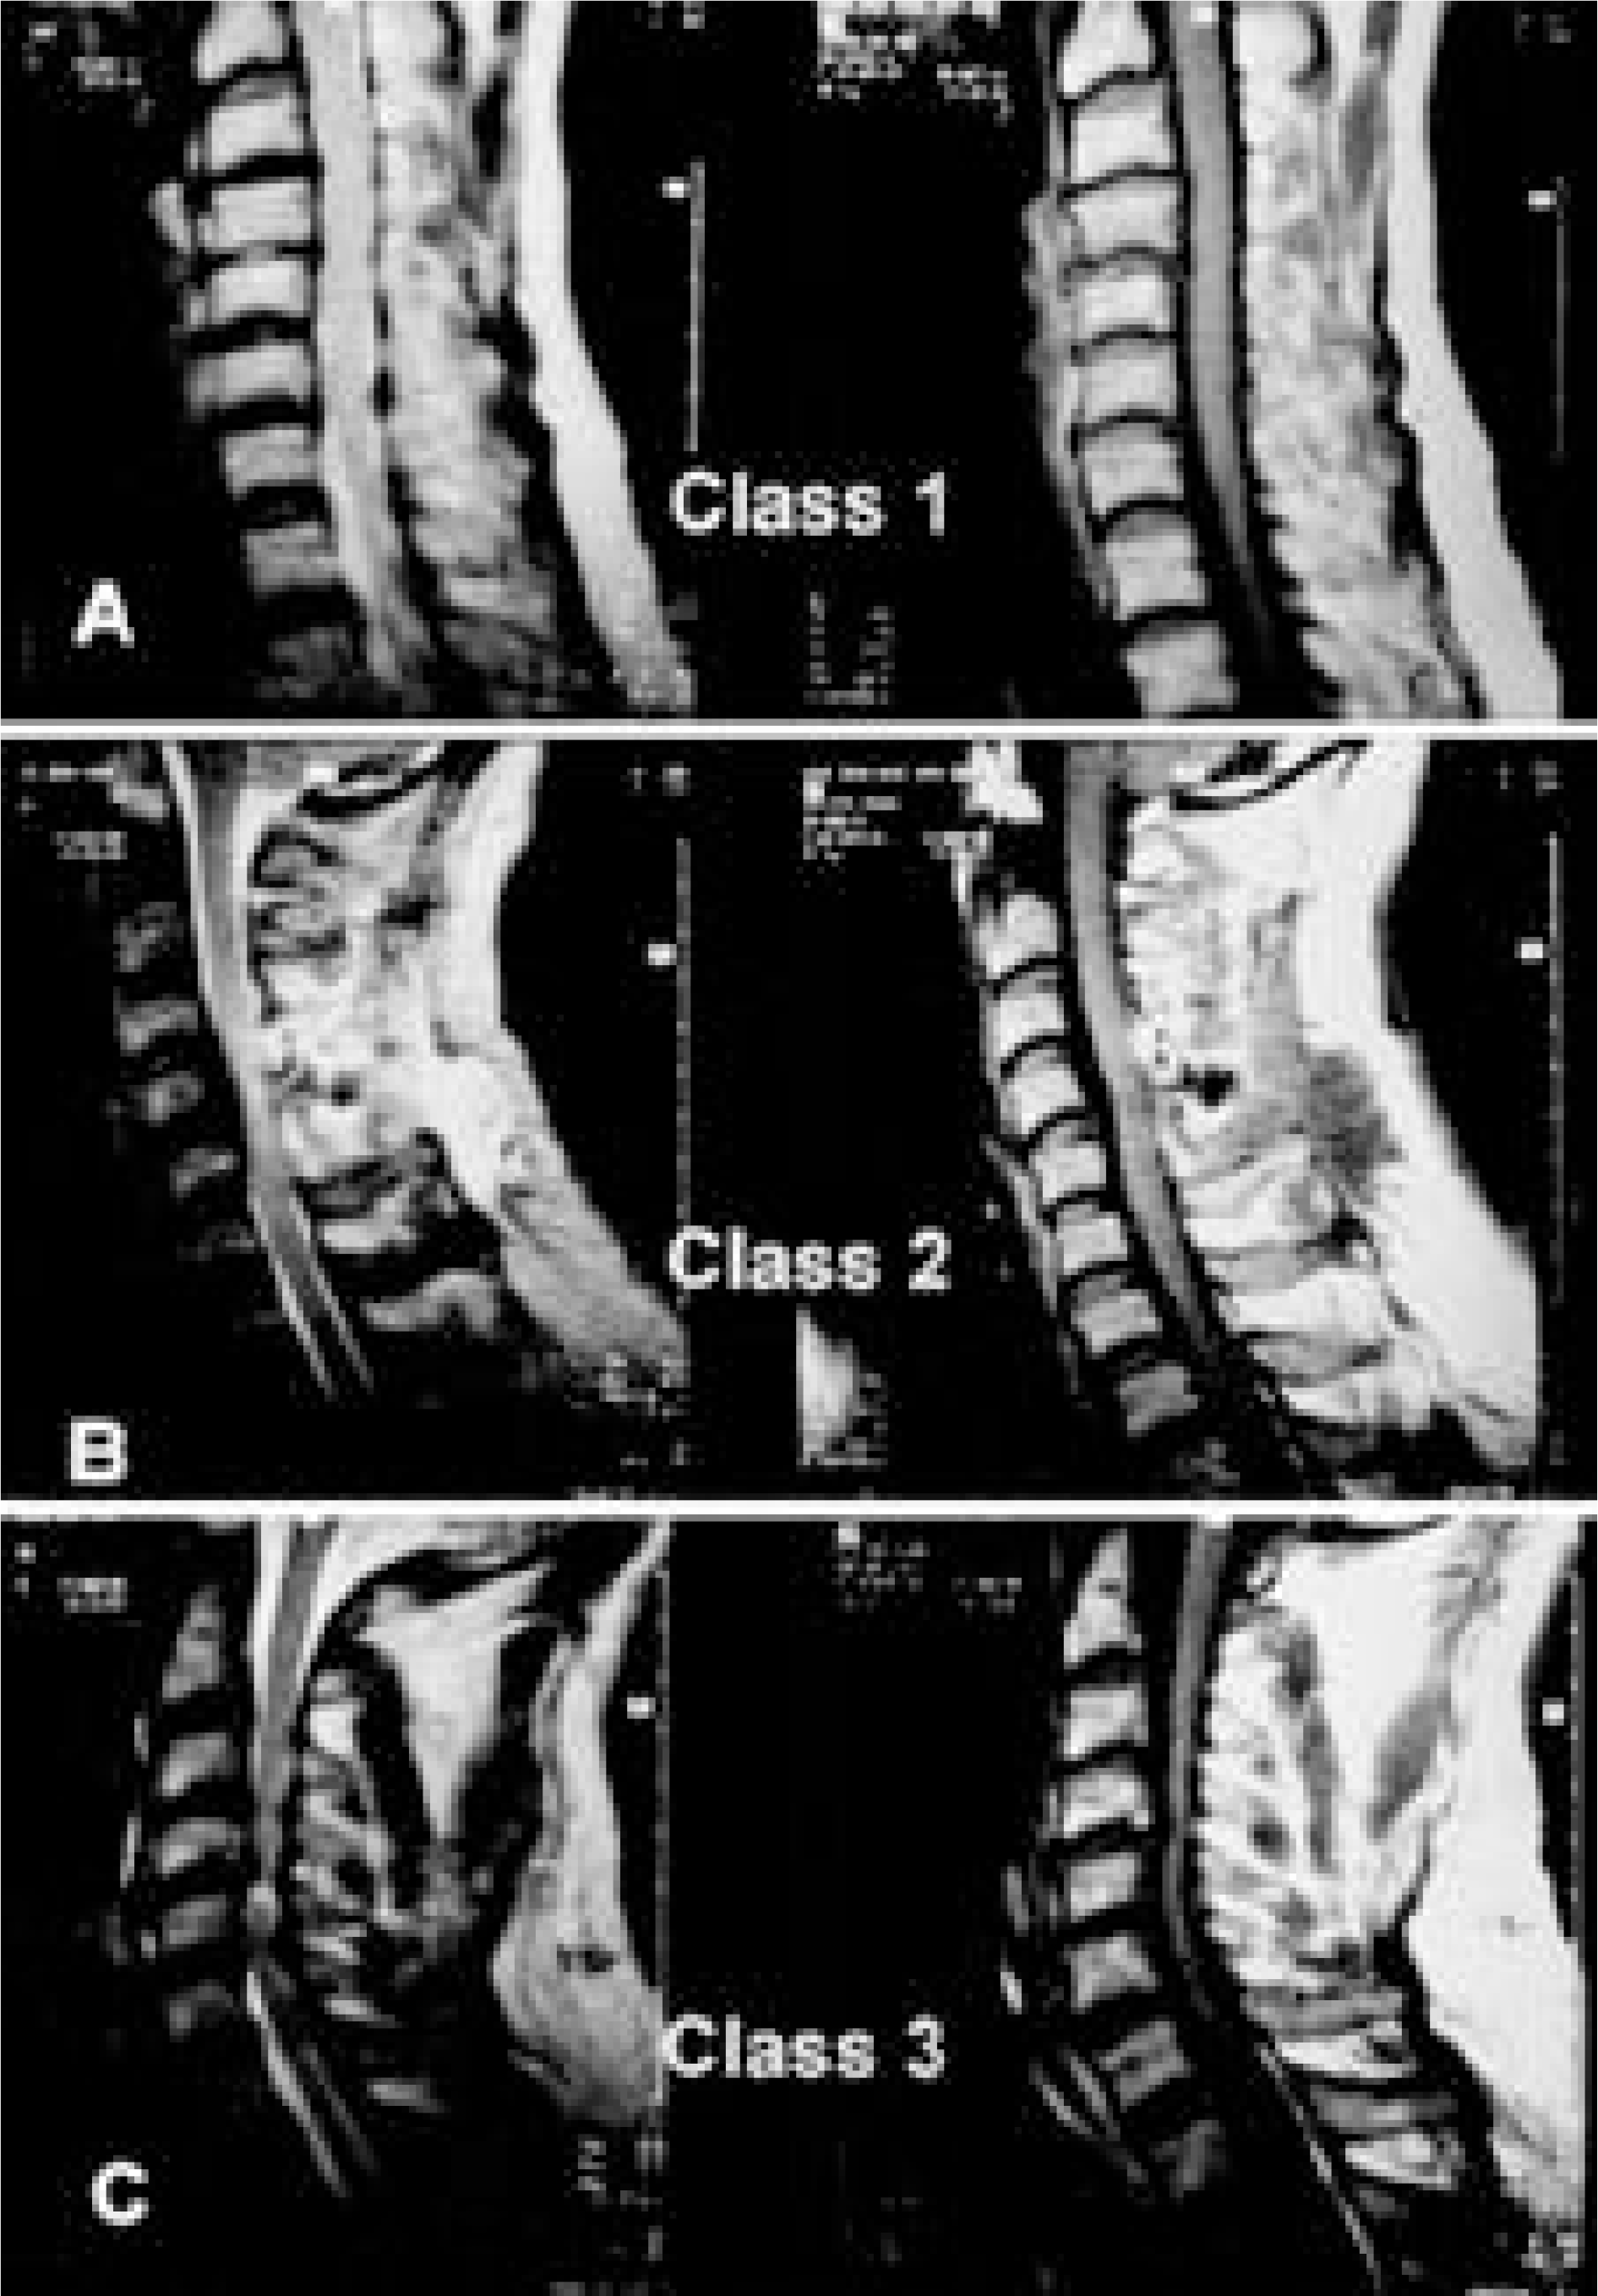
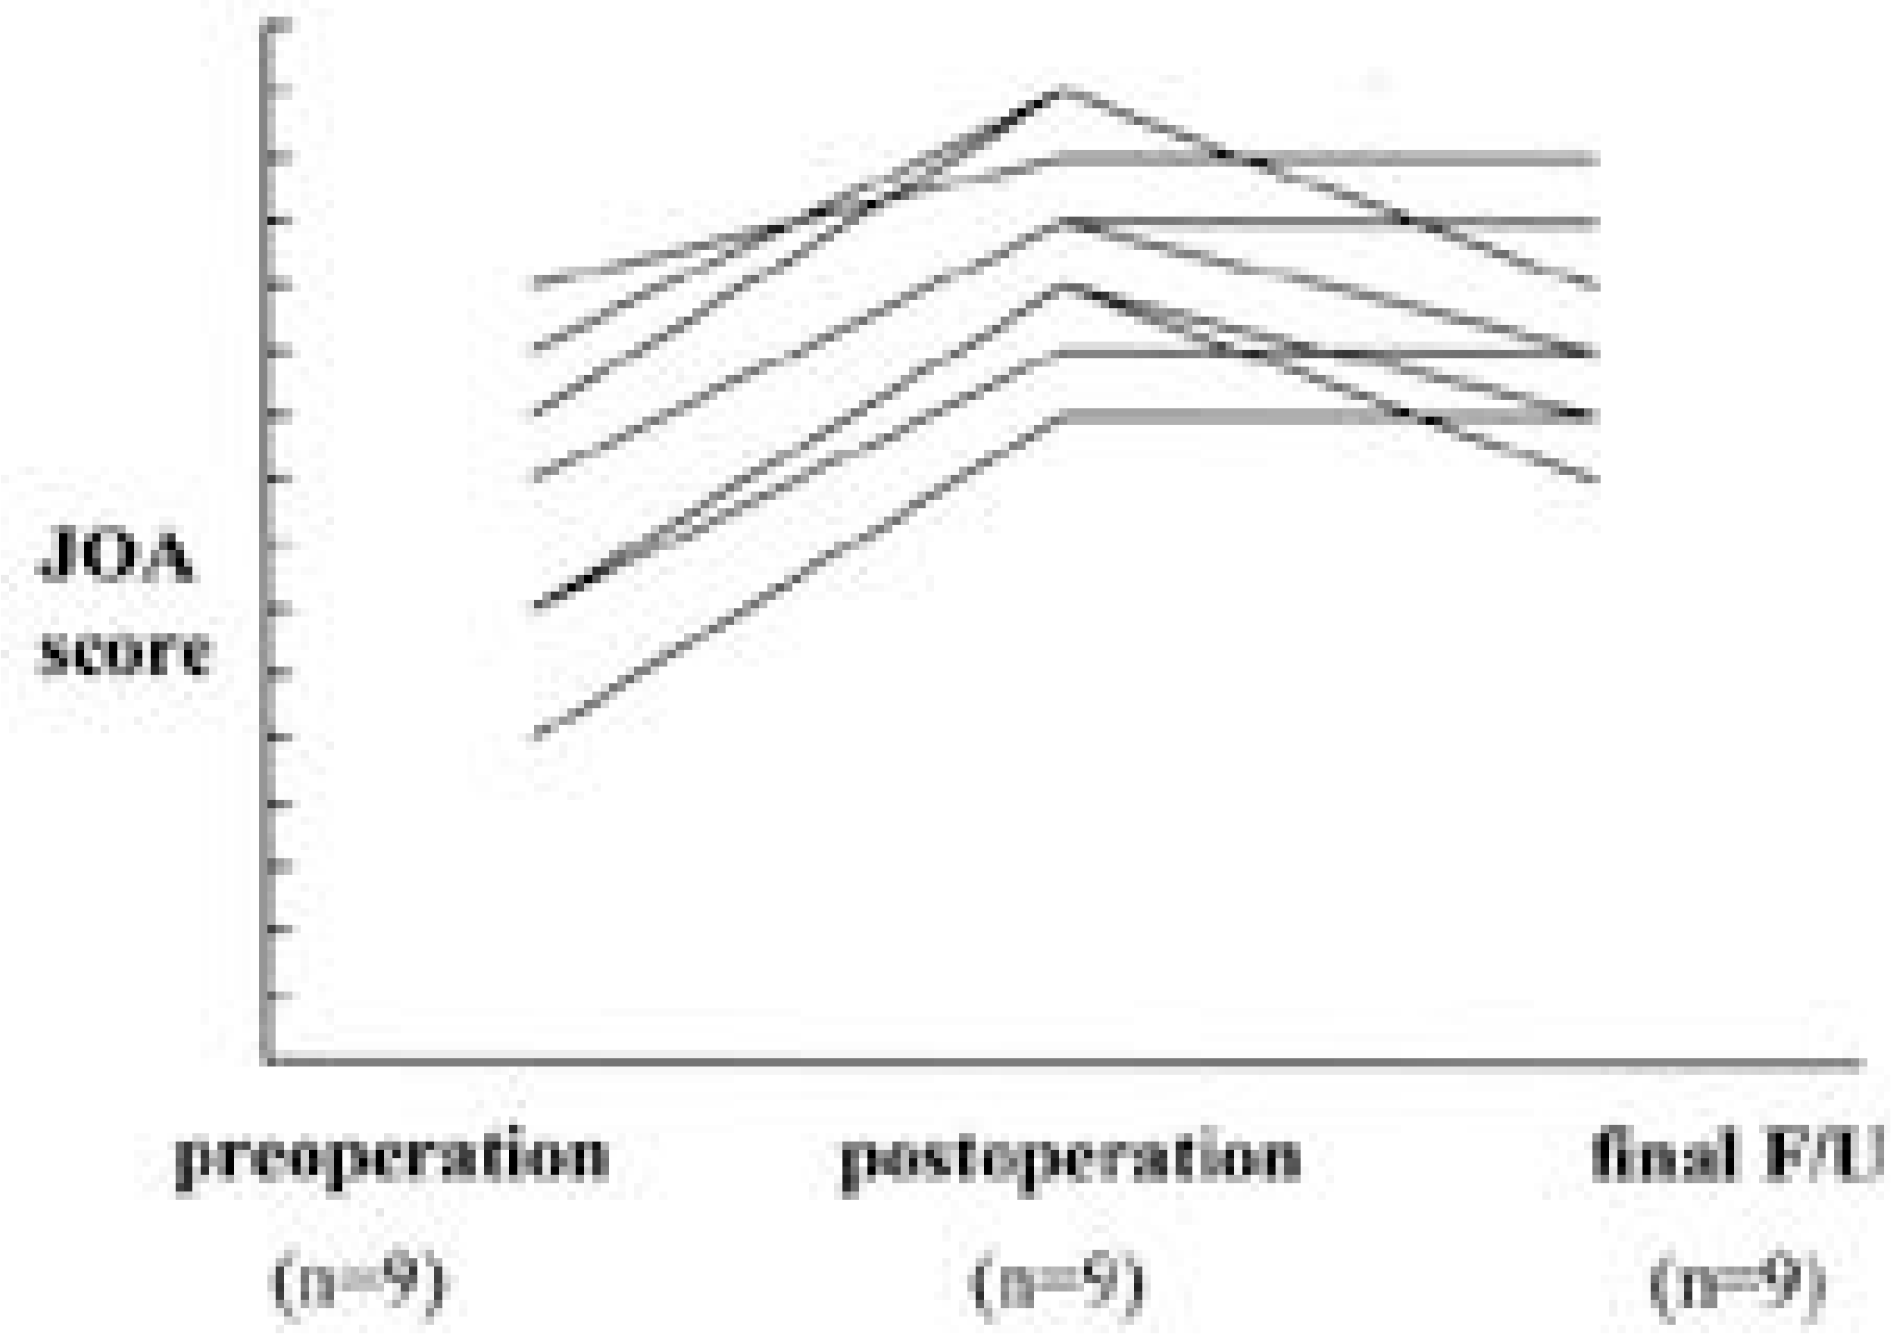
The preoperative mean JOA score was 8.5 and the postoperative mean JOA score 12.8 and the maximum recovery rate was 51.1%, but these were significantly inferior to scores in those less than 70 years of age. A t the time of final follow up, the mean JOA score had decreased 11.3 and the recovery rate was 32.6%. All patients except one were improved their daily living function. On the postoperative midline T1 sagittal MRI, morphological improvement was seen in 44% in patients more than 70 years of age, while 69% of patients were improved in the control group.
Go to : 
REFERENCES
1). Bernhardt M, Hynes RA, Blume HW and White AA III. Current concept review: Cervical spondylotic myelopathy. J Bone Joint Surg [Am]. 75:119–128. 1993.
2). Harada A and Mimatsu K. Postoperative changes in the spinal cord in cervical myelopathy demonstrated by magnetic resonance imaging. Spine. 17:1275–1280. 1992.
3). Kawamura Y, Watanabe S, Takagi K and Takahashi Y. The morphometry of anterior horn cell bodies of spinal cord of man. Morphological changes of alpha and gamma motoneurons with age. Clin Neurol. 19:504–510. 1979.
4). Law MD, Bernhardt M and White AA III. Evaluation and management of cervical spondylotic myelopathy. J Bone Joint Surg [Am]. 76:487–493. 1994.

5). Machada H, et al. A study of surgical treatment of cervical myelopathy and its complications on old aged patient. J West Jap Research Society for Spine. 12:136–139. 1986.
6). Makino M, Mimatsu K, Saito H, Konishi N and Hashizume Y. Morphometric study of myelinated fibers in human cervical spinal cord white matter. Spine. 21:1010–1016. 1996.

7). Nagata K, et al. Clinical value of magnetic resonance imaging for cervical myelopathy. Spine. 15:1088–1096. 1990.

8). Nagata K, Ohashi T, Abe J, Morita M and Inoue A. Cervical myelopathy in elderly patients: Clinical results and MRI findings before and after decompression surgery. Spinal Cord. 34:220–226. 1996.

9). Takada S. The follow-up study on cervical osteochondro -sis &cervico-omobrachialgia(Non-operative cases). Cent Jpn J Orthop Trauma. 18:1–17. 1975.
10). Tera S, Sobue G, Hashizume Y, Shimada N and Mitsuma T. Age-related changes of the myelinated fibers in the human corticospinal tract: A quantitative analysis. Acta Neuropathol. 88:137–142. 1994.

11). Tera S, Sobue G, Hashizume Y, Li M, Inagaki T and Mitsuma T. Age-related changes in human spinal ventral horn cells with special reference to the loss of small neu -rons in the intermediate zone: A quantitative analysis. Acta Neuropathol. 92:109–114. 1996.
12). Zhang C, Goto N and Zhou M. Morphometric analysis and aging process of nerve fibers in the human posterior funiculus. Okajima Folia Anat jpn. 72:259–264. 1995.
13). Zilger JE, Capen DA and Rothman SL. Spinal diseases in the aged. Clin Orthop. 316:70–79. 1995.
Go to : 
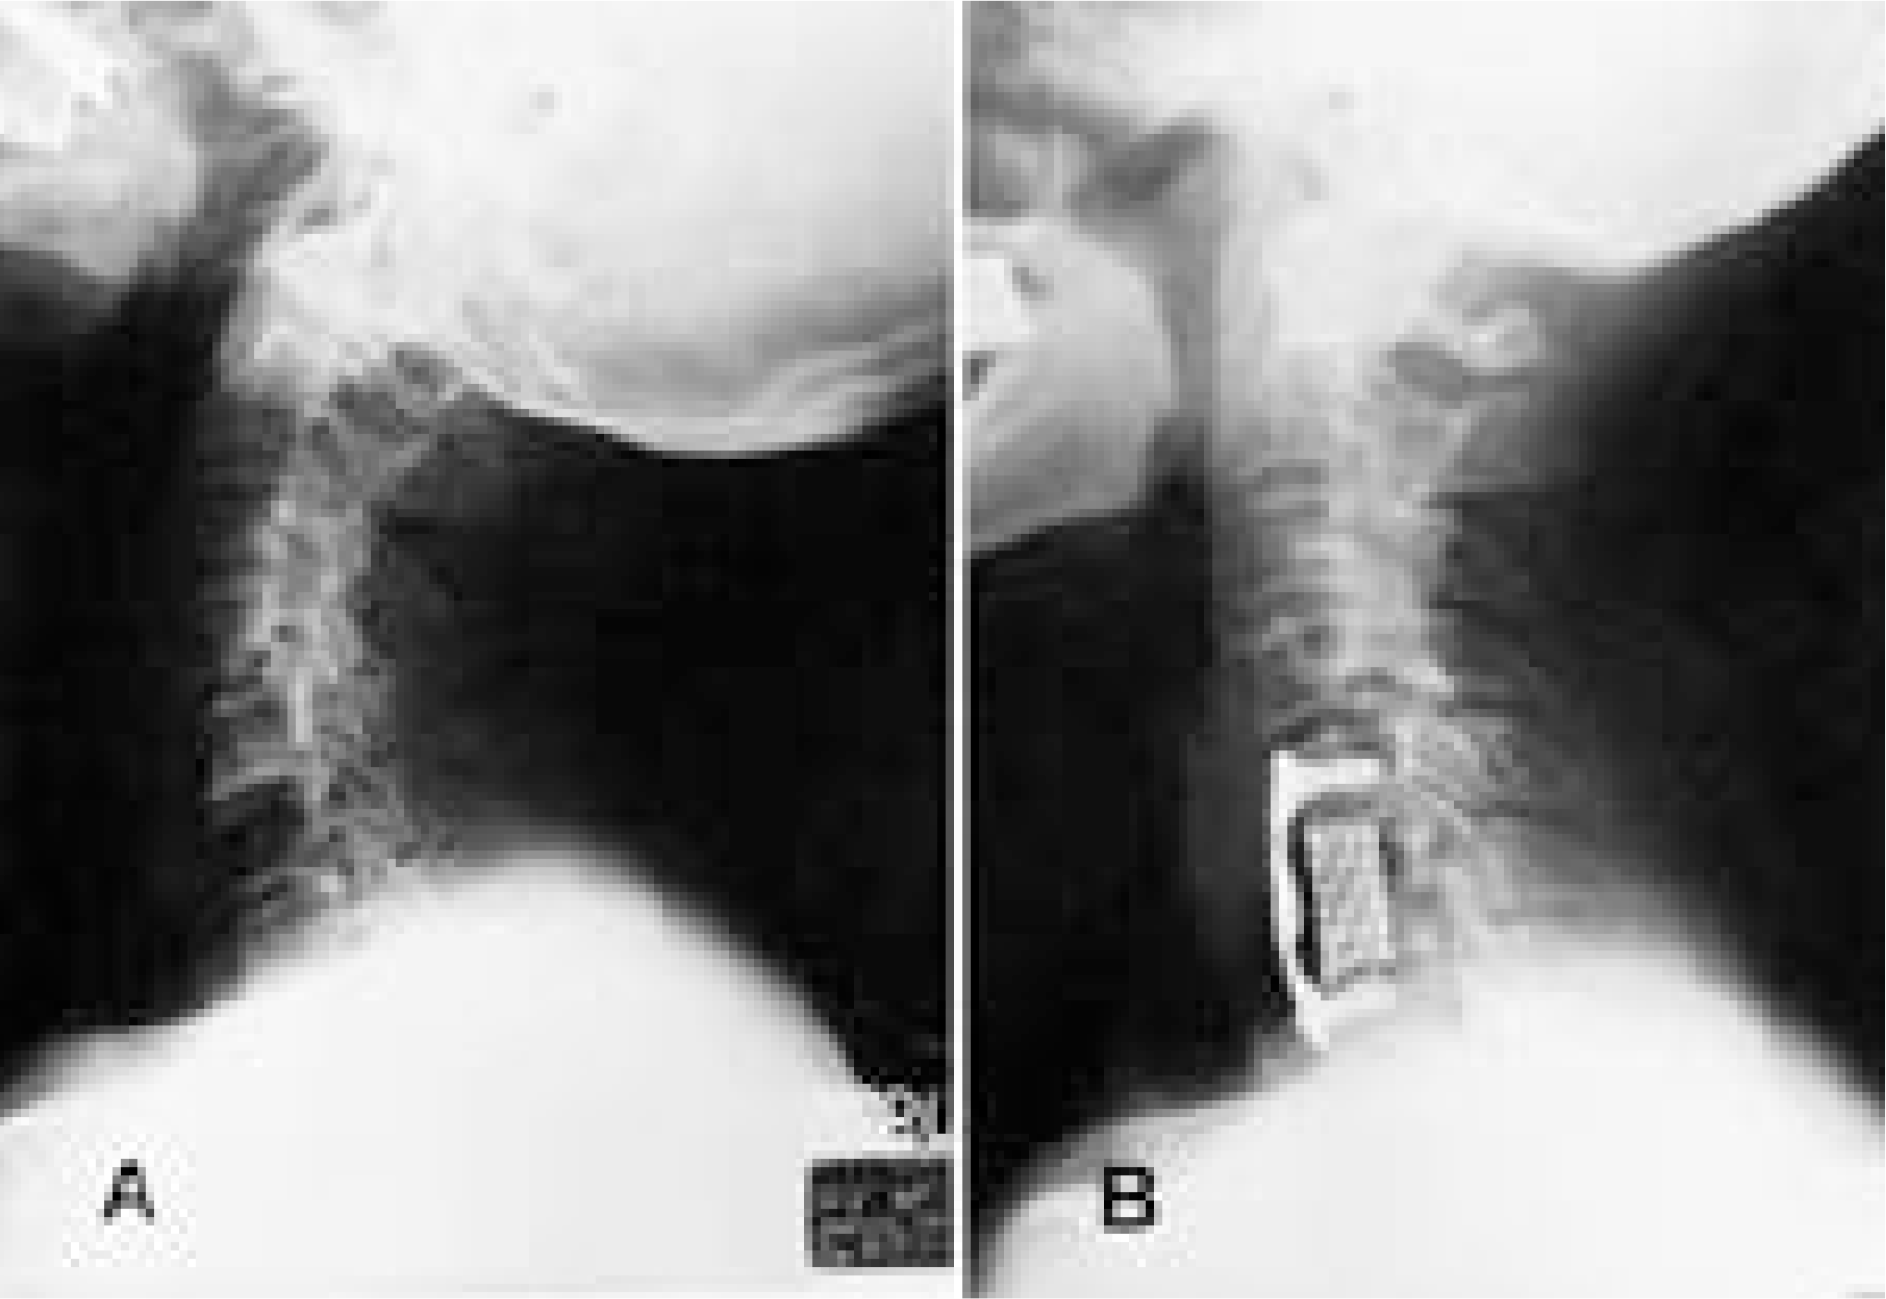 | Fig. 3.72-year-old woman. A. preoperative lateral radiograph. B. postoperative lateral radiograph. |
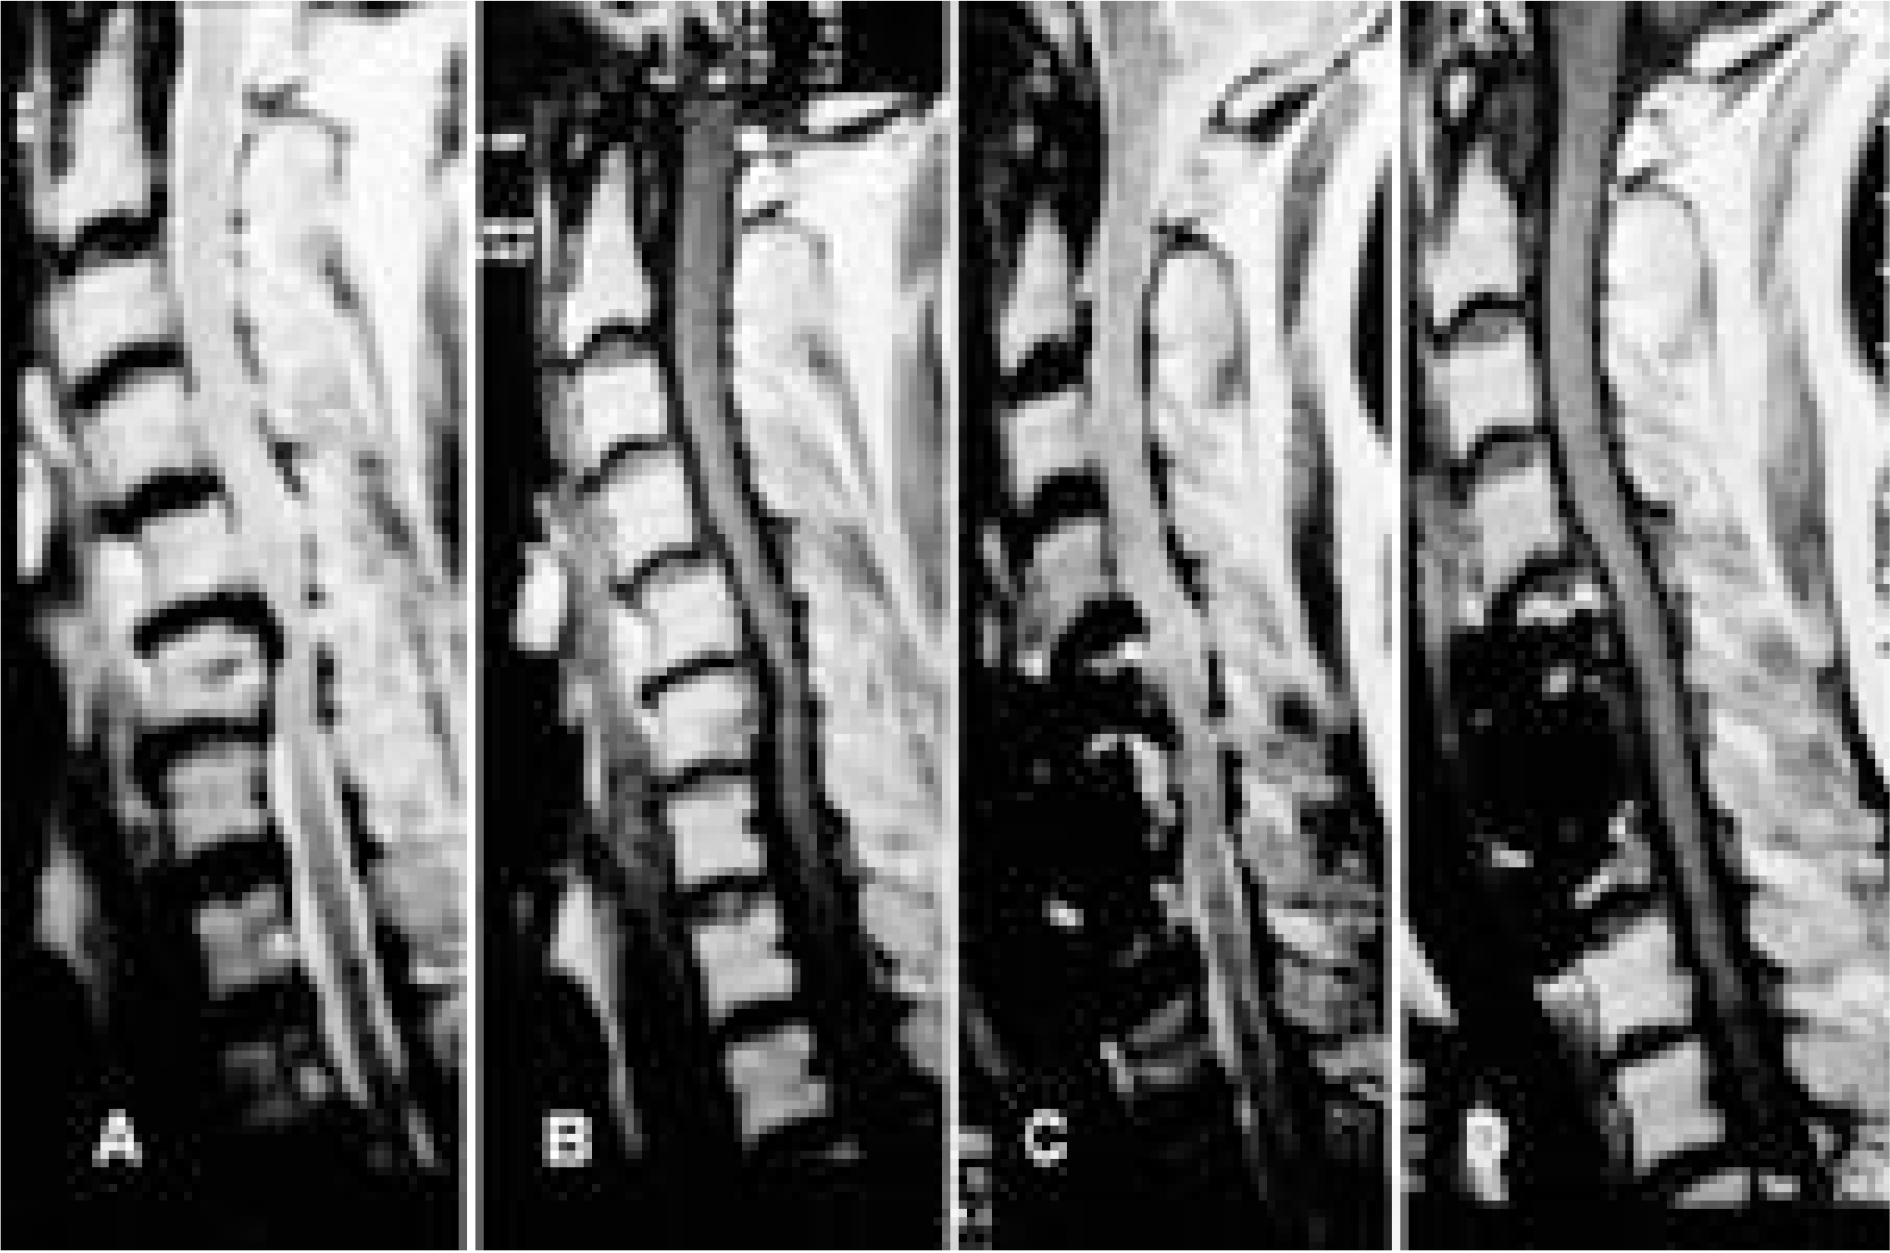 | Fig. 4.72-year-old woman. A, B. preoperative sagittal MRI. C, D. postoperative sagittal MRI |
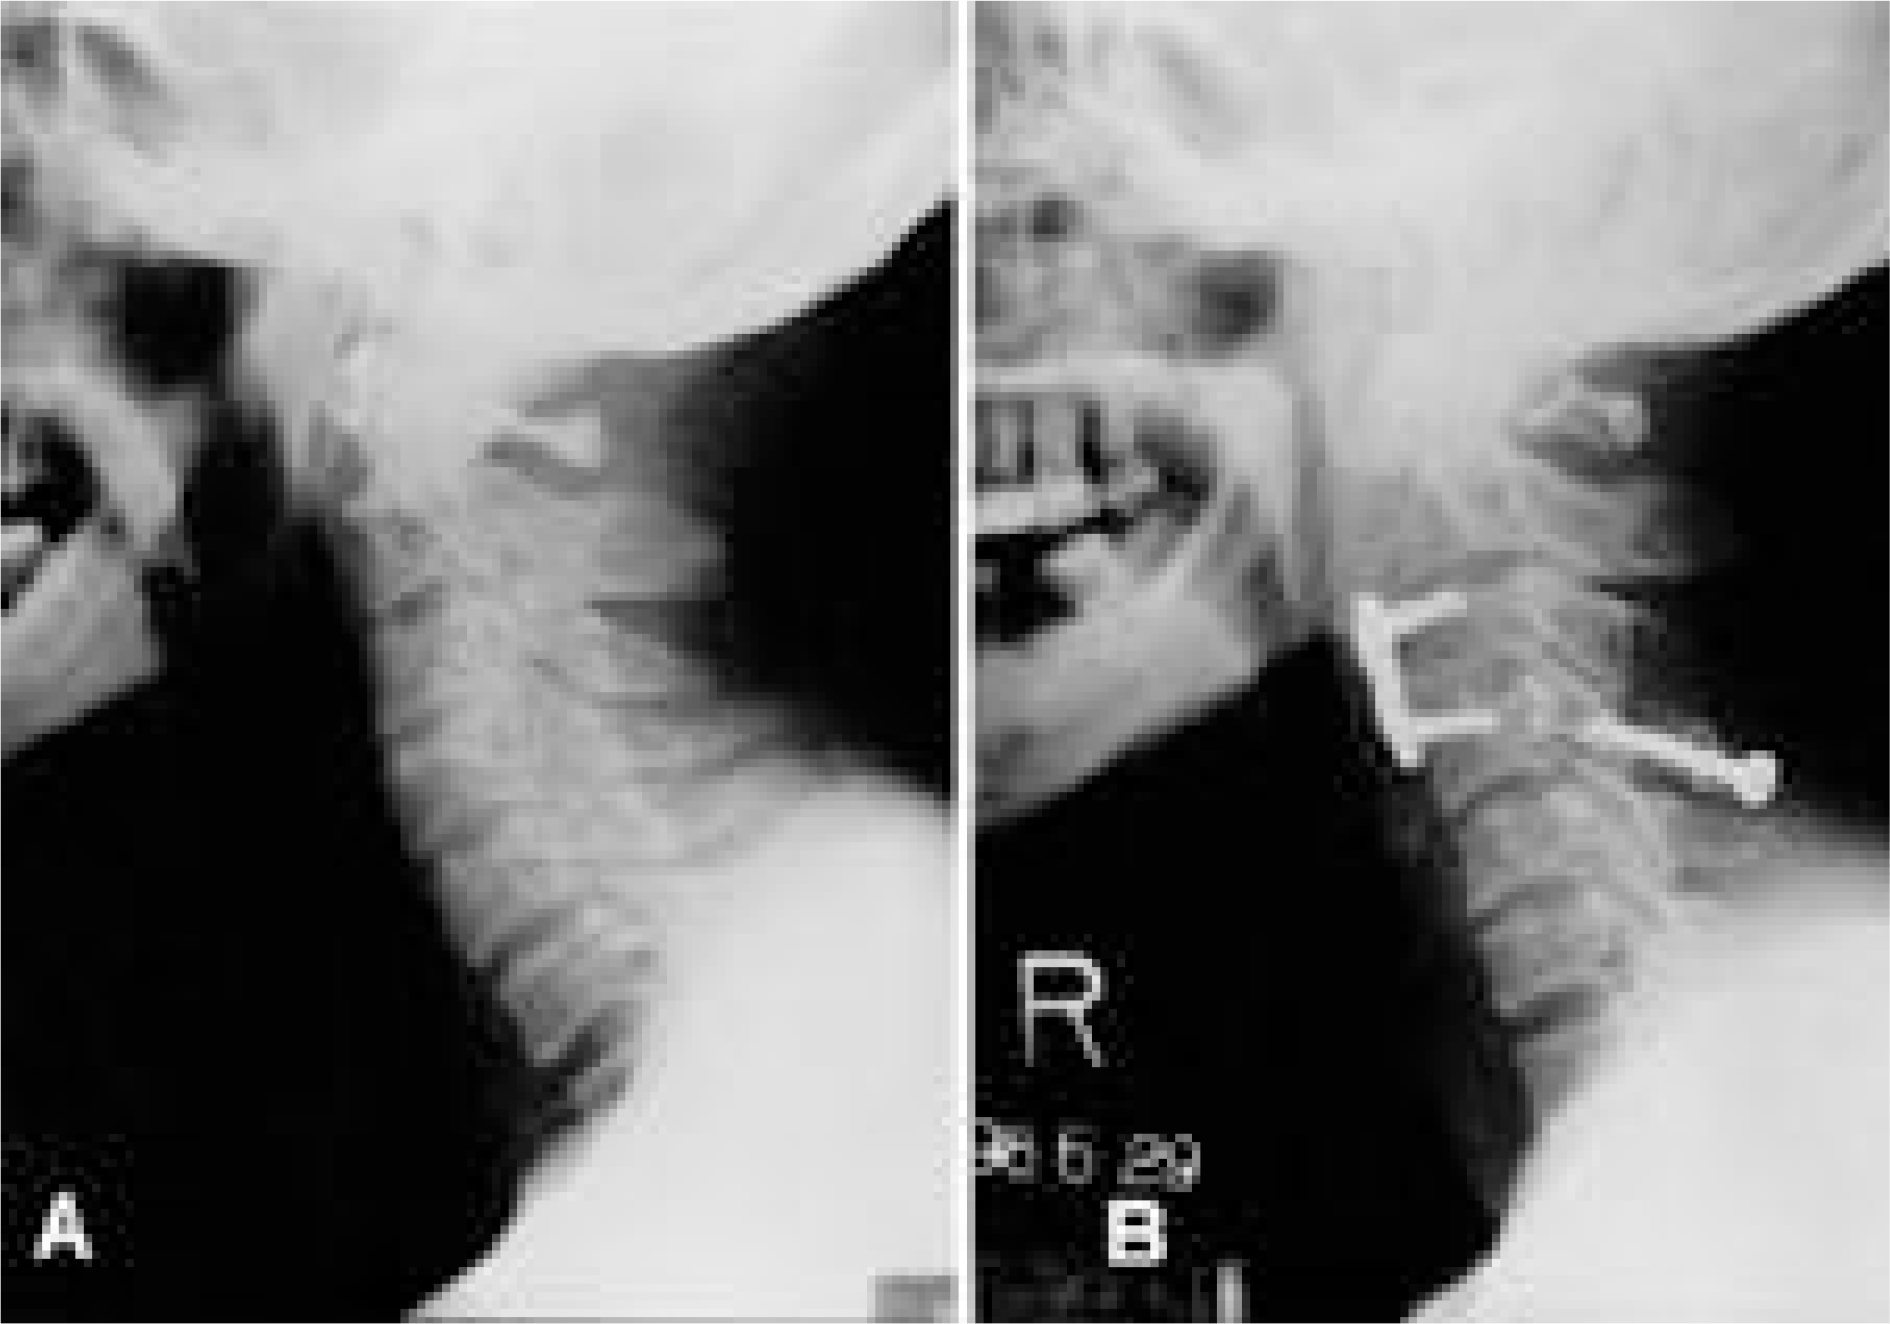 | Fig. 5.71-year-old man. A. preoperative lateral radiograph. B. postoperative lateral radiograph. |
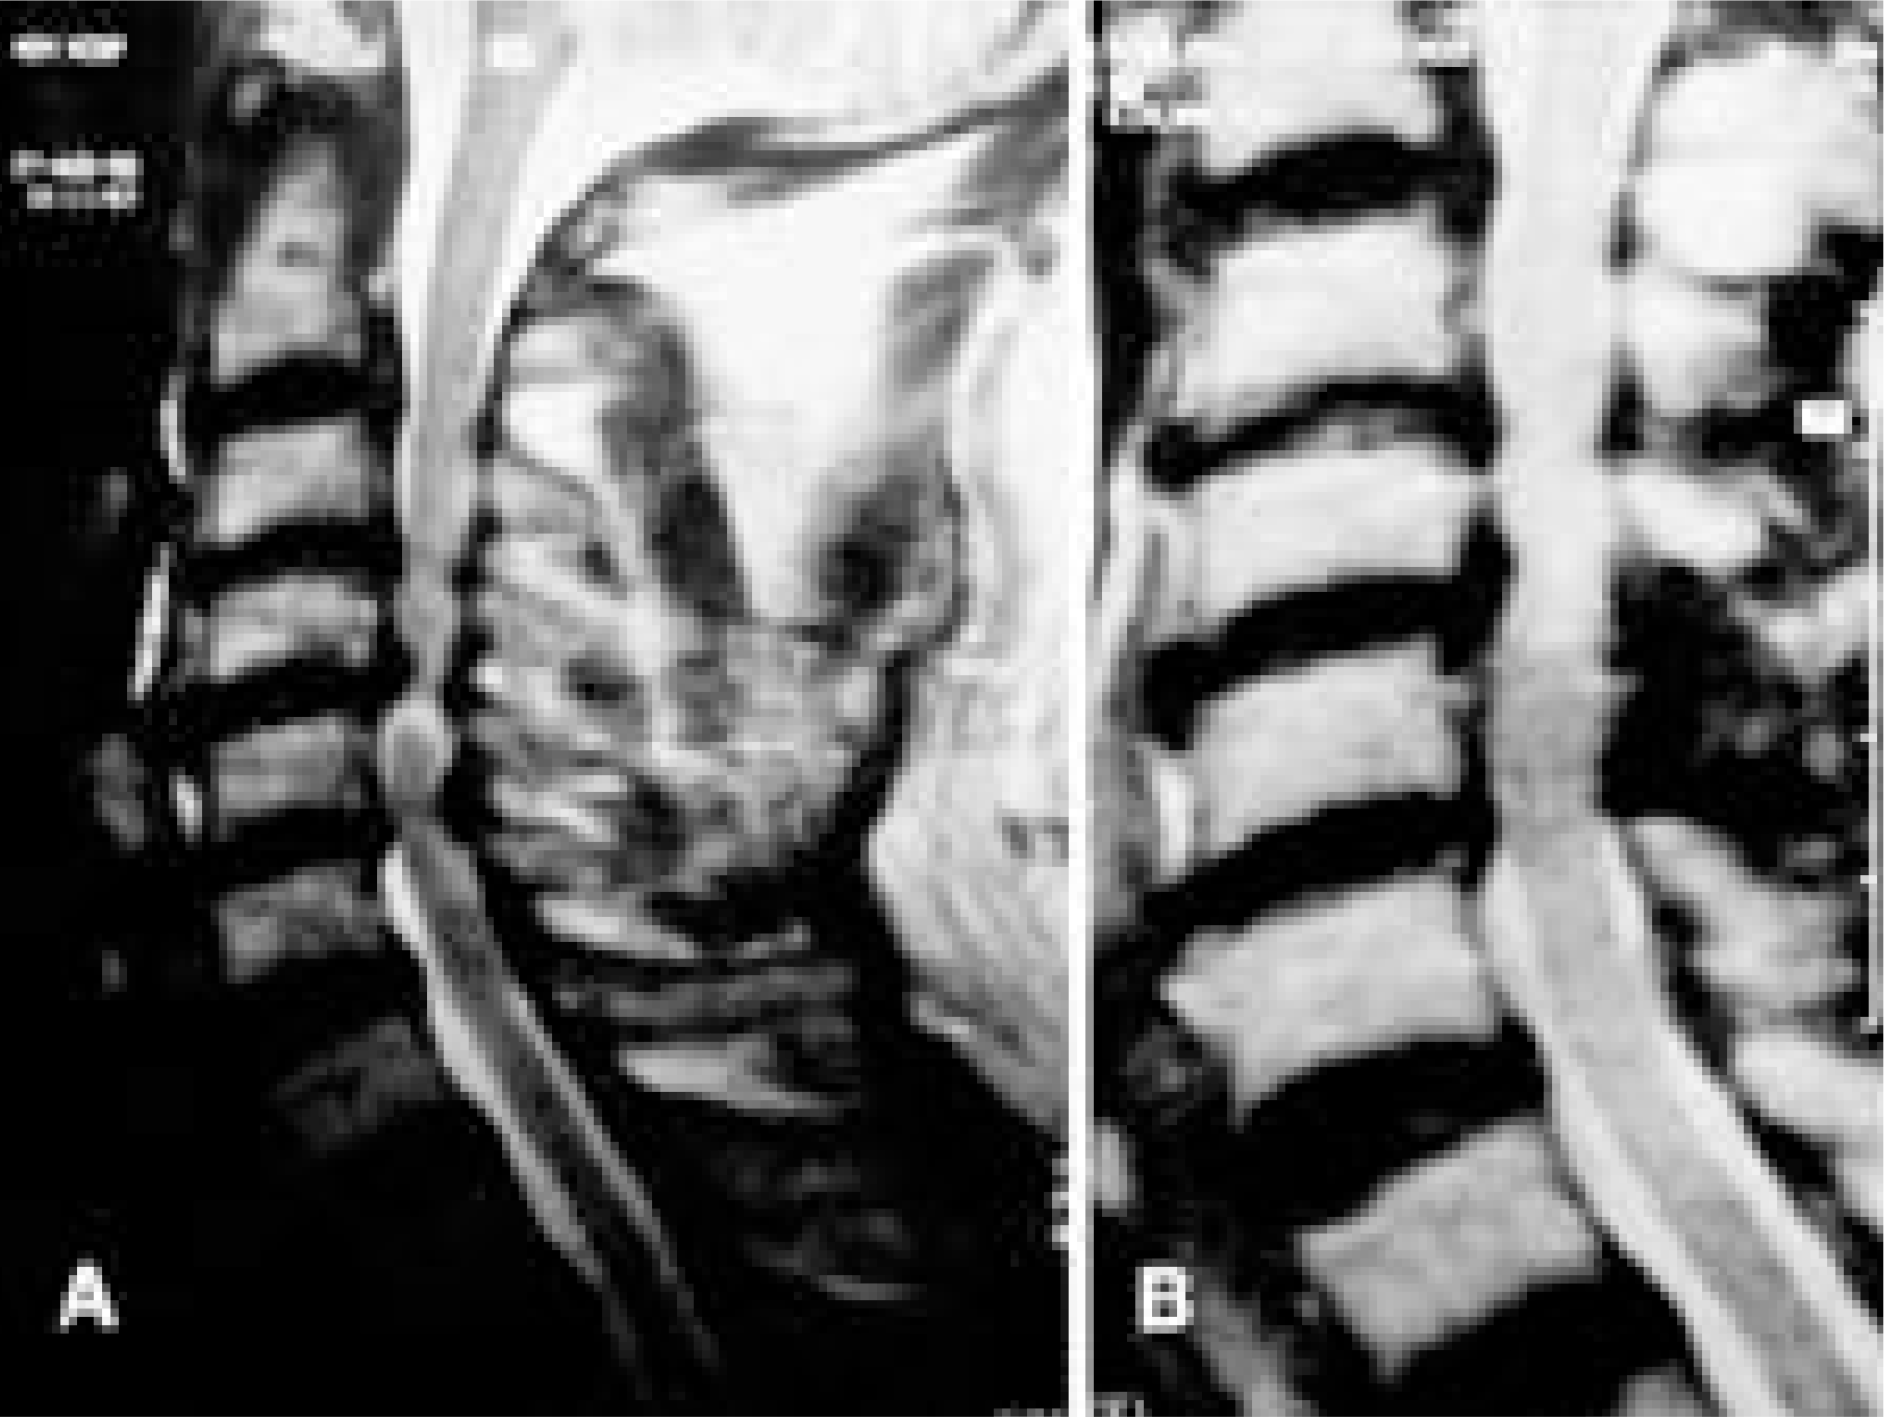
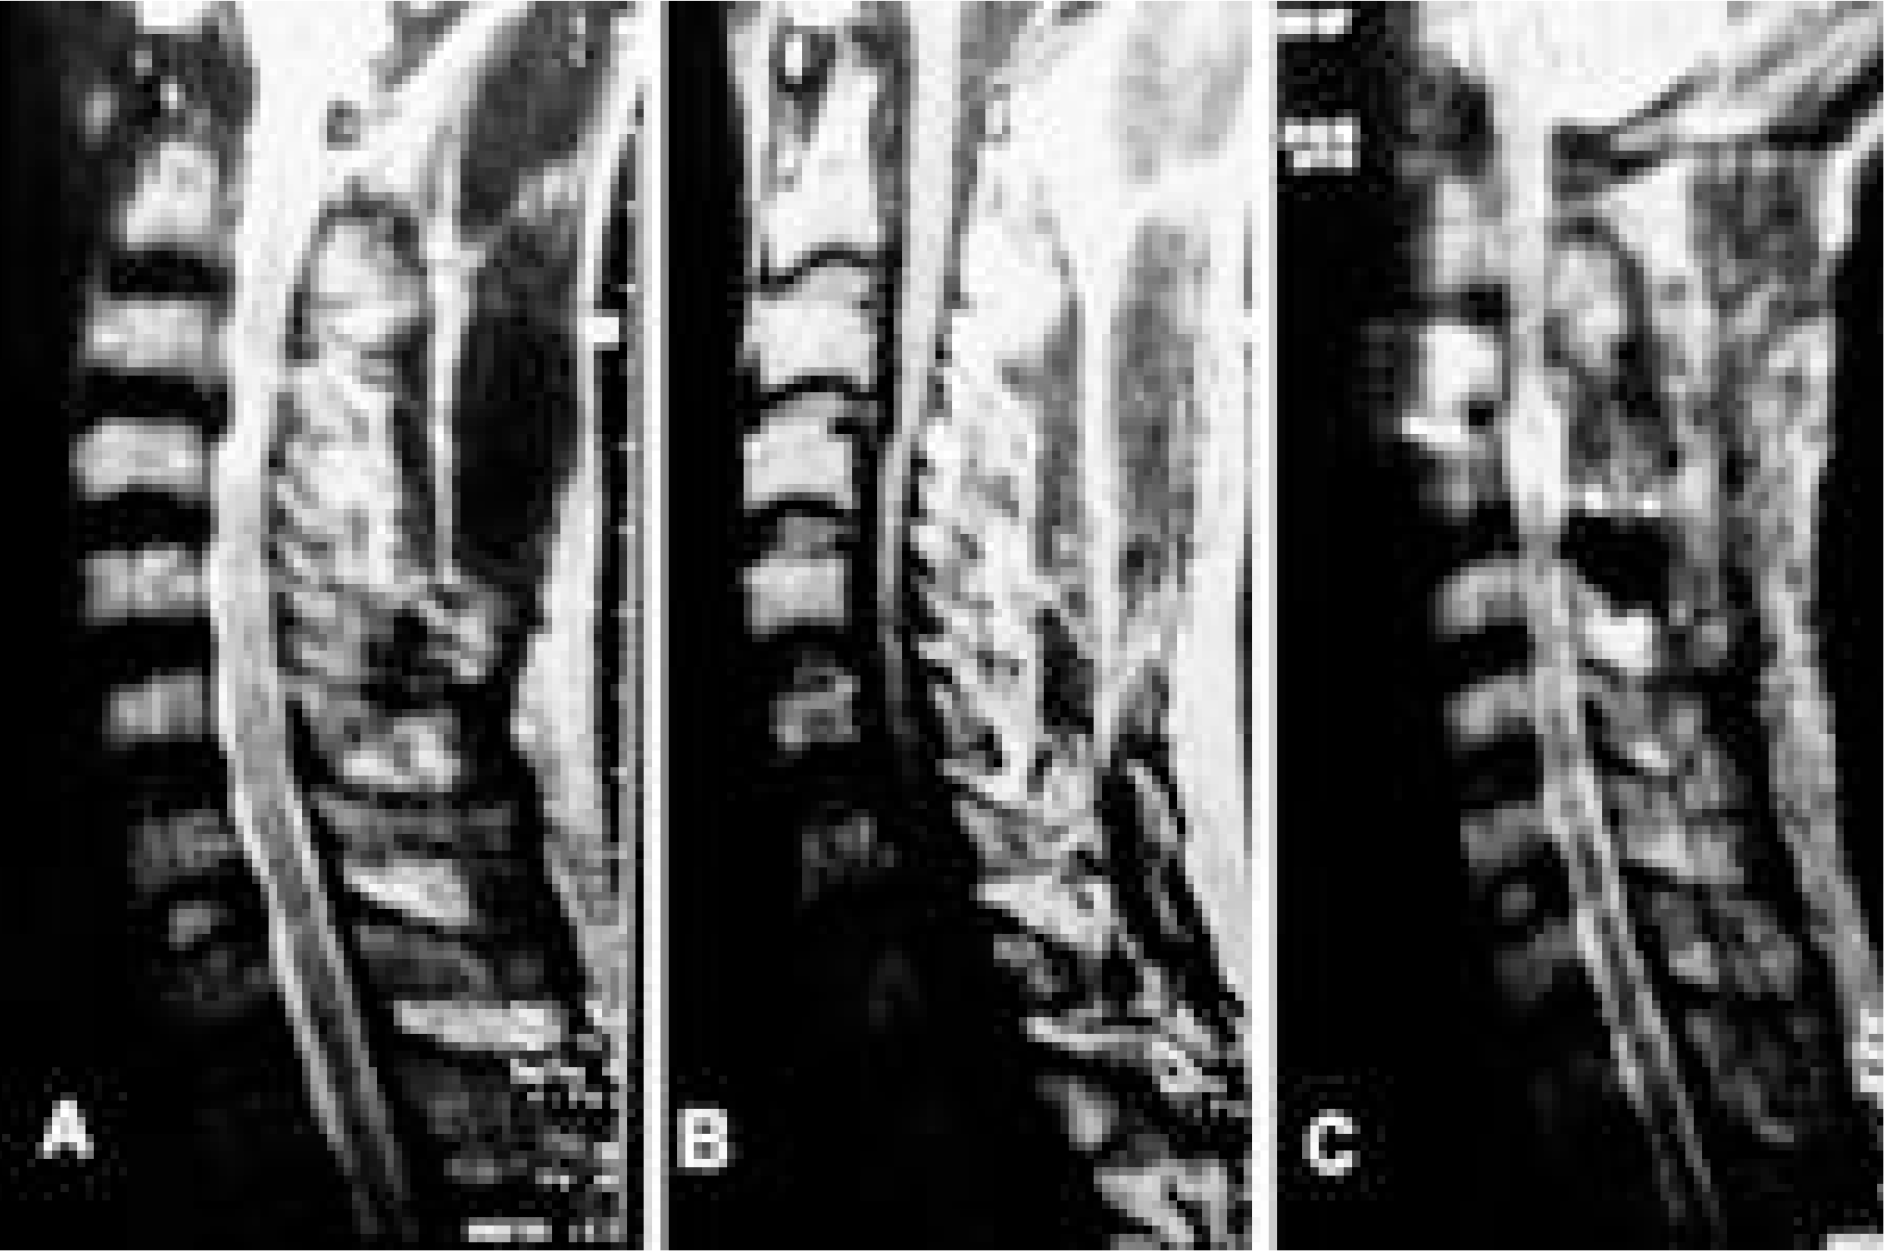 | Fig. 6.71-year-old man. A. preoperative sagittal T2-weighted MRI showed high signal area. C. postoperative sagittal T2-weighted MRI showed no signal change. |
Table 1.
JOA scoring system & Recovery rate in Cervical Myelopathy
Table 2.
The clinical results in aged and control group


 PDF
PDF ePub
ePub Citation
 Print
Print


 XML Download