

 PDF
PDF ePub
ePub Citation
 Print
Print


Abstract
Objectives
To explore the pattern of pain distribution in HNP and spinal stenosis with or without degenerative spondylolisthesis (DS), and to evaluate the diagnostic value of pain drawings in predicting the presence of a painful nerve root.
Summary of Literature Review
The usefulness of pain drawing as a tool to predict the presence of painful nerve root compression is unclear.
Materials and Methods
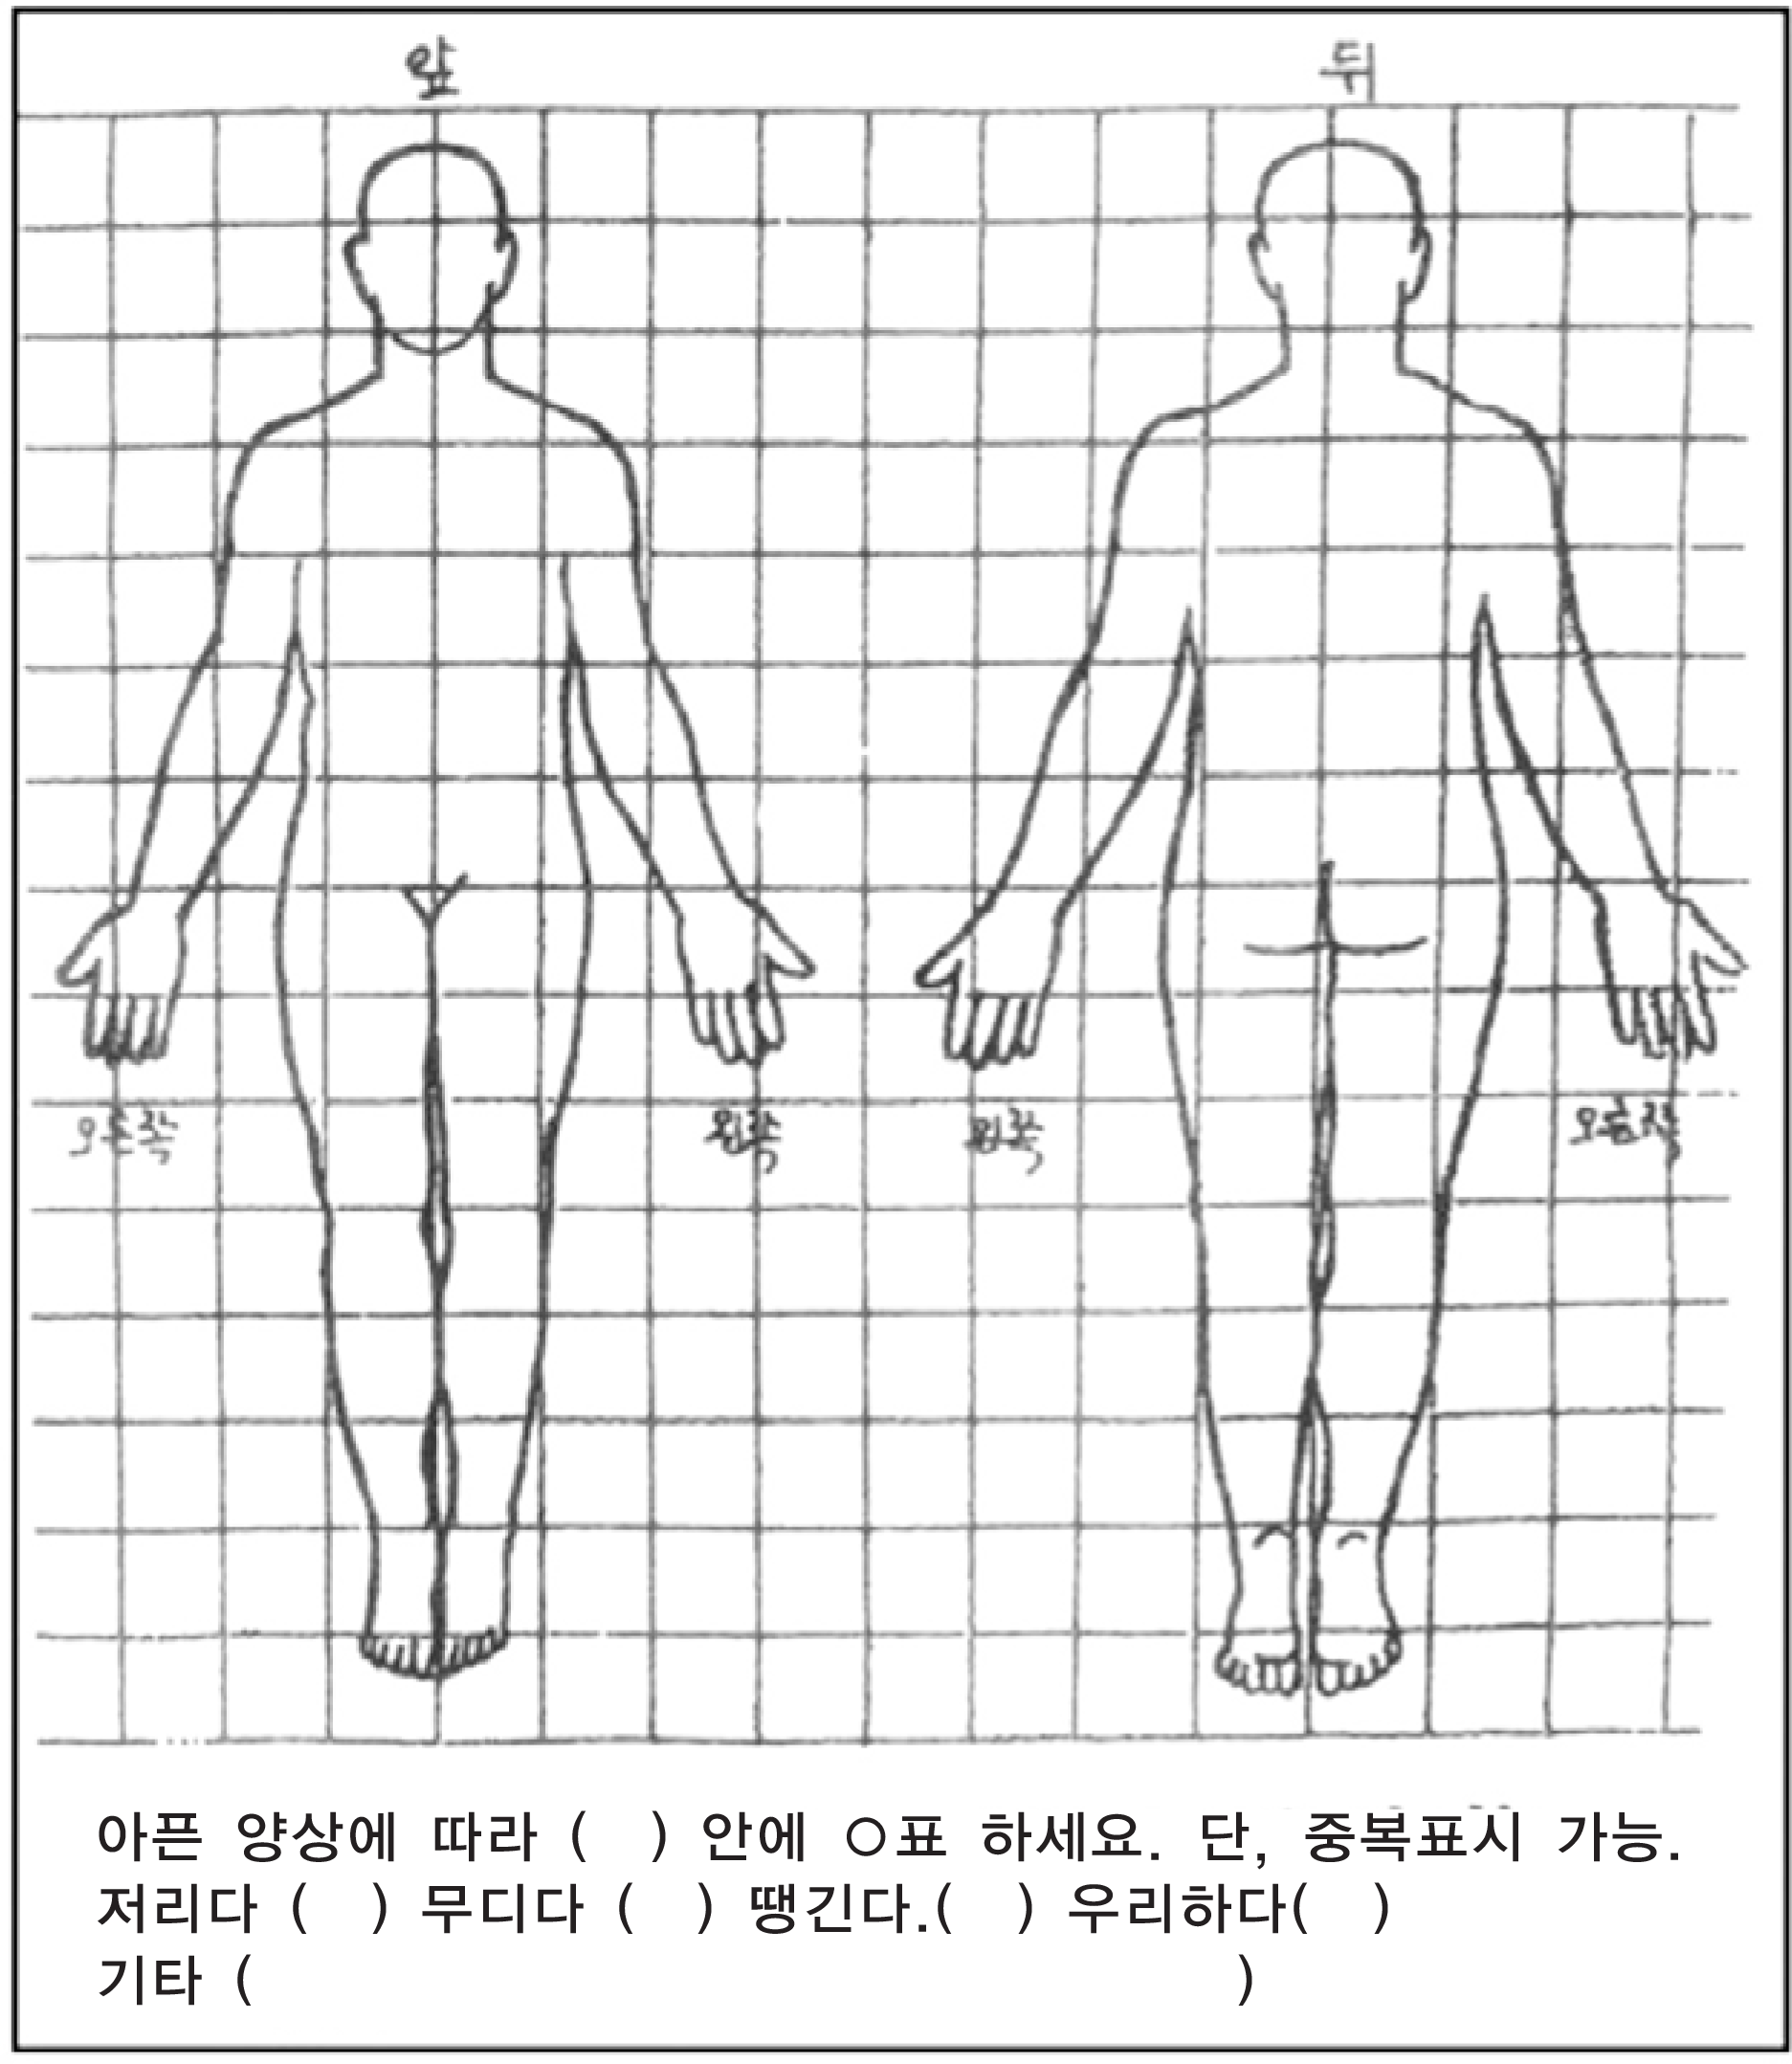
Fifty-seven patients (27 HNP, 21 pure spinal stenosis, and 9 spinal stenosis with DS) with leg pain were recruited. The presence of painful nerve root compression was judged based on MRI and clinical findings. Each grid of the pain drawing is assigned an area code, and discriminant analysis was performed to explore indications of painful nerve root. Diagnostic values were evaluated by calculating sensitivity, specificity, positive predictive value (PPV), and negative predictive value (NPV).
Results
Pain distribution was characterized by a dermatomal pattern in HNP and variable in the spinal stenosis group. Pares-thesia on the sole was extracted as a discriminant factor indicating painful compression of the S1 nerve root. In HNP, the sensitivity, specificity, PPV, and NPV of this factor were 62%, 100%, 100%, and 74% respectively. In the spinal stenosis group, they were 80%, 56%, 27%, and 93%, respectively.
Go to : 
REFERENCES
1). Zileli B, Ertekin C, Zileli M, Yunten N. Diagnostic value of electrical stimulation of lumbosacral roots in lumbar spinal stenosis. Acta Neurol Scand. 2002; 105:221–227.

2). Ransford AO, Cairns D, Mooney V. The pain drawing as an aid to the psychologic evaluation of patients with low-back pain. Spine. 1976; 1:127–134.
3). Hildebrandt J, Franz CE, Choroba-Mehnen B, Temme M. The use of pain drawings in screening for psychological involvement in complaints of low-back pain. Spine. 1988; 13:681–685.
4). Schwartz DP, DeGood DE. Global appropriateness of pain drawings: blind ratings predict pattern of psychological distress and litigation status. Pain. 1984; 19:383–388.
5). Von Baeyer CL, Bergstrom KJ, Brodwin MG, Brodwin SK. Invalid use of pain drawings in psychological screening of back pain patients. Pain. 1983; 16:103–107.
6). Kim HT, Park BH, Chun DW, Lee HS, Jeon HB. The use of pain drawing in low back disorder. J Korean Soc Spine Surg. 1994; 1:93–101.
7). Ohnmeiss DD, Vanharanta H, Guyer RD. The association between pain drawings and computed tomographic/disco-graphic pain responses. Spine. 1995; 20:729–733.
8). Leavitt F, Garron DC. Psychological disturbance and pain report differences in both organic and non-organic low back pain patients. Pain. 1979; 7:187–195.
9). Mann NH 3rd, Brown MD, Herz DB, Enger I, Tomp-kins J. Initial-impression diagnosis using low-back pain patient pain drawings. Spine. 1993; 18:41–53.
10). Margolis RB, Chibnall JT, Tait RC. Test-retest reliabil-ity of the pain drawing instrument. Pain. 1988; 33:49–51.
11). Margolis RB, Tait RC, Krause SJ. A rating system for use with patient drawings. Pain. 1986; 24:57–65.
12). Uden A, Landin LA. Pain drawing and myelography in sciatic pain. Clin Orthop Relat Res. 1987; 216:124–130.
13). Vucetic N, Maattanen H, Svensson O. Pain and pathology in lumbar disc hernia. Clin Orthop Relat Res. 1995; 320:65–72.
Go to :
Figures and Tables%
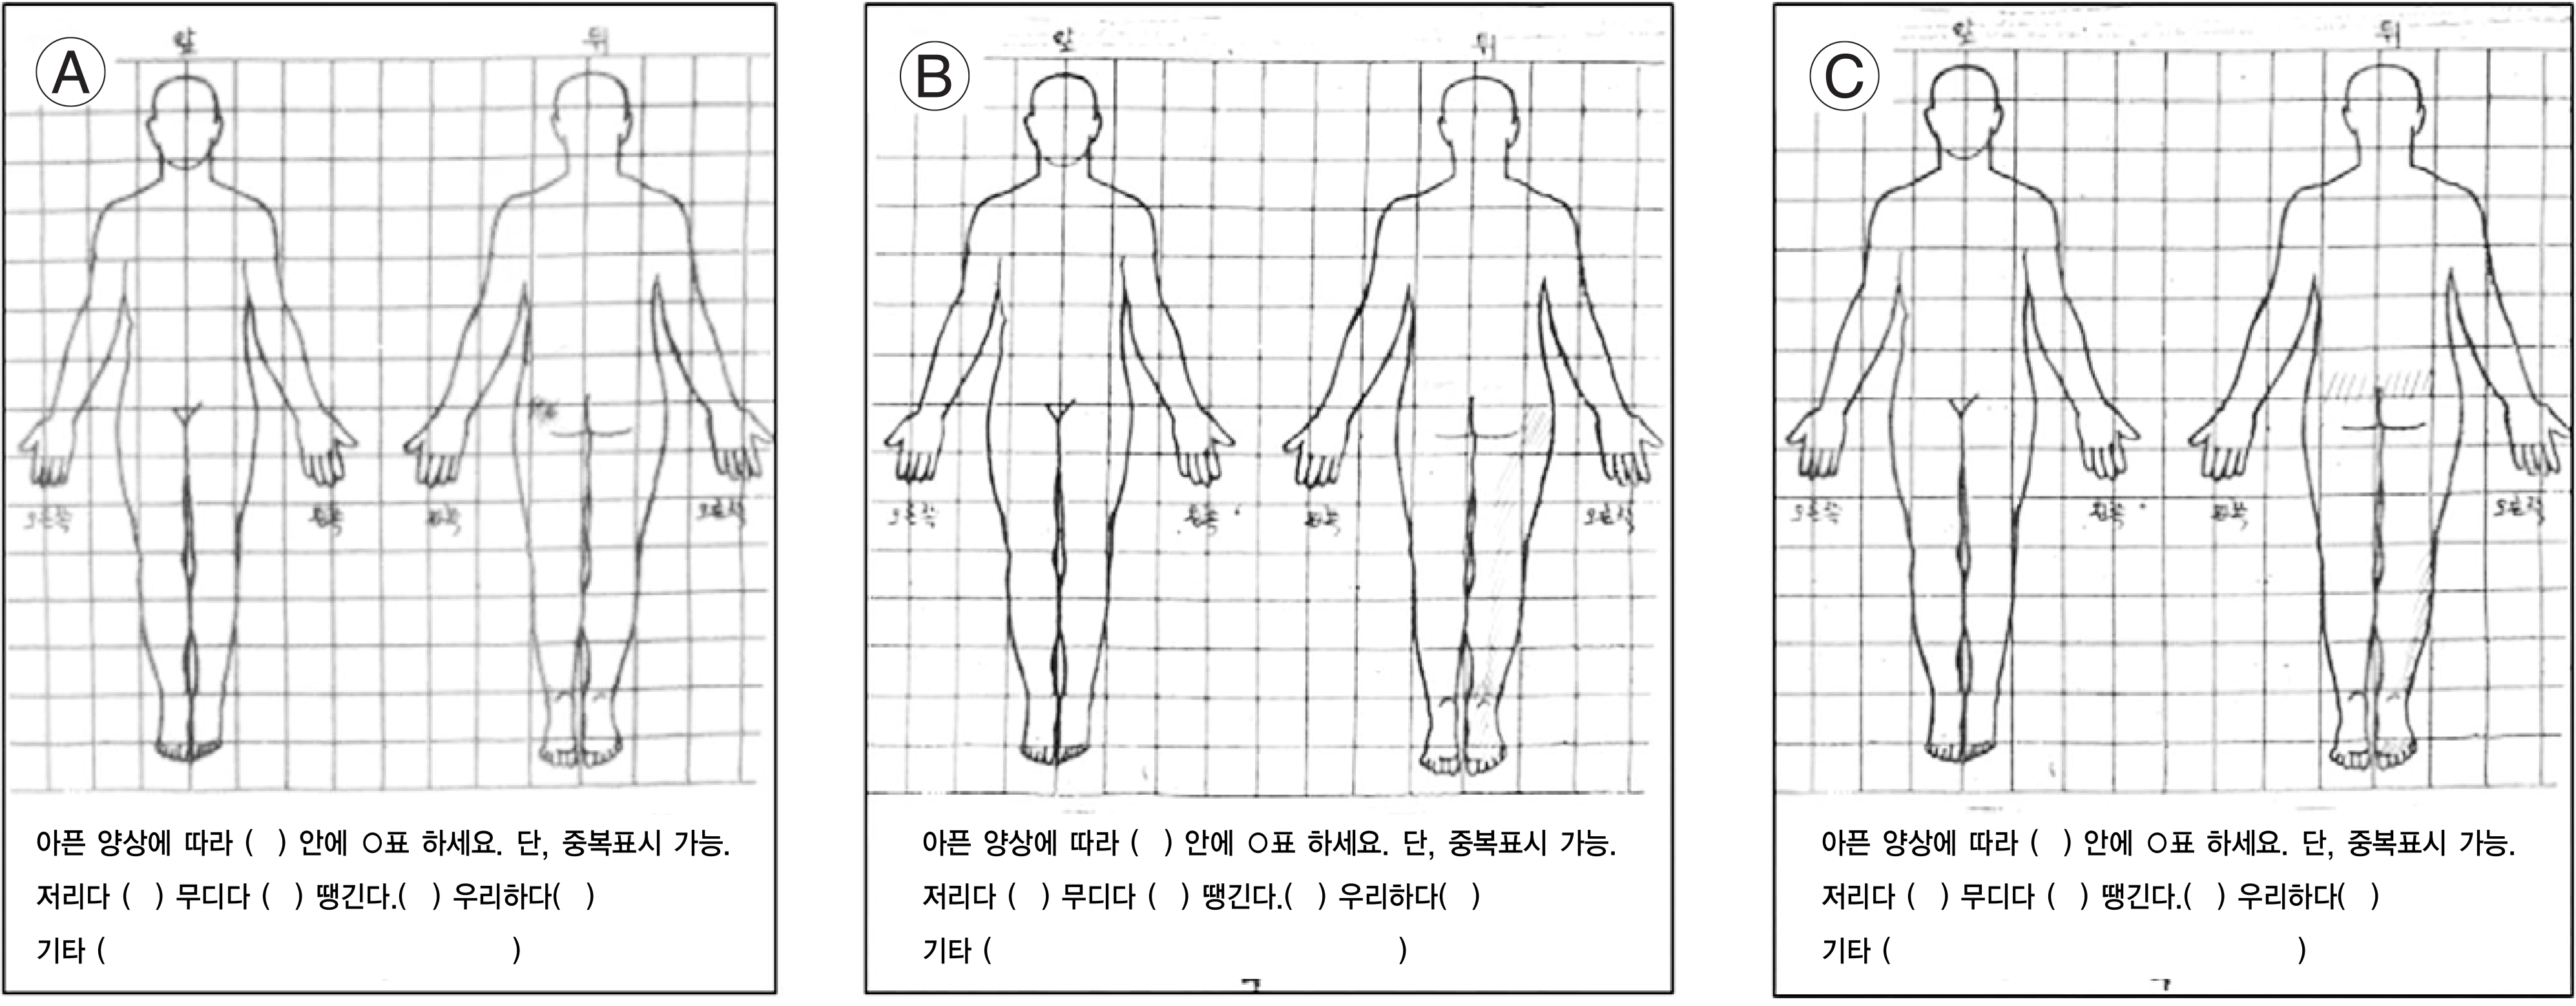 | Fig. 2.Pain drawing according to pain distribution pattern (A) focal type (B) wide type (C) dermatomal type |
Table 1.
Patient distribution with relation to disease entities & anatomical level
| Disease | L3-4 | L4-5 | L5-S1 | Multilevel | Total | ||
|---|---|---|---|---|---|---|---|
| HNP | case number affected nerve root | 2 L4 root | 12 L5 root | 13 S1 root | 0 | 27 | |
| Spinal | Pure | case number | 0 | 6 | 5 | 10 | 21 |
| stenosis | affected nerve root | L4 root | L5 root | S1 root | |||
| stenosis | case number | ||||||
| group* | DS† | case number affected nerve root | 0 | 7 L5 root | 0 | 2 | 9 |
| Total | 2 | 25 | 18 | 12 | 57 | ||
Table 2.
Pain distribution pattern with relation to the disease entities
| Disease | Pain distribution pattern | |||
|---|---|---|---|---|
| Focal | Wide | Dermatomal | Total | |
| HNP | 5 | 16 | 16 | 27 |
| Spinal stenosis group* | 8 | 14 | 18 | 30 |
Table 3.
Numbness on the sole with relation to MRI examination in HNP
| Numbness on the sole | Compressed level based on MRI examination | ||
|---|---|---|---|
| Lumbar | Sacral | Total | |
| Absent | 14 | 15 | 19 |
| Present | 10 | 18 | 18 |
| Total | 14 | 13 | 27 |
 XML Download