Abstract
Objectives
This study evaluated the relationship between the bone mineral density (BMD) and low back pain and between BMD and the spinal fractures of postmenopausal women and to determine threshold value of the fracture.
Summary and Literature Review
Low back pain was not associated with a decreased BMD, and BMD of the spine fracture group with osteoporosis was significantly lower than the non fracture group. The threshold of fracture was 99 mg/cm3 in the 90th percentile.
Materials and Methods
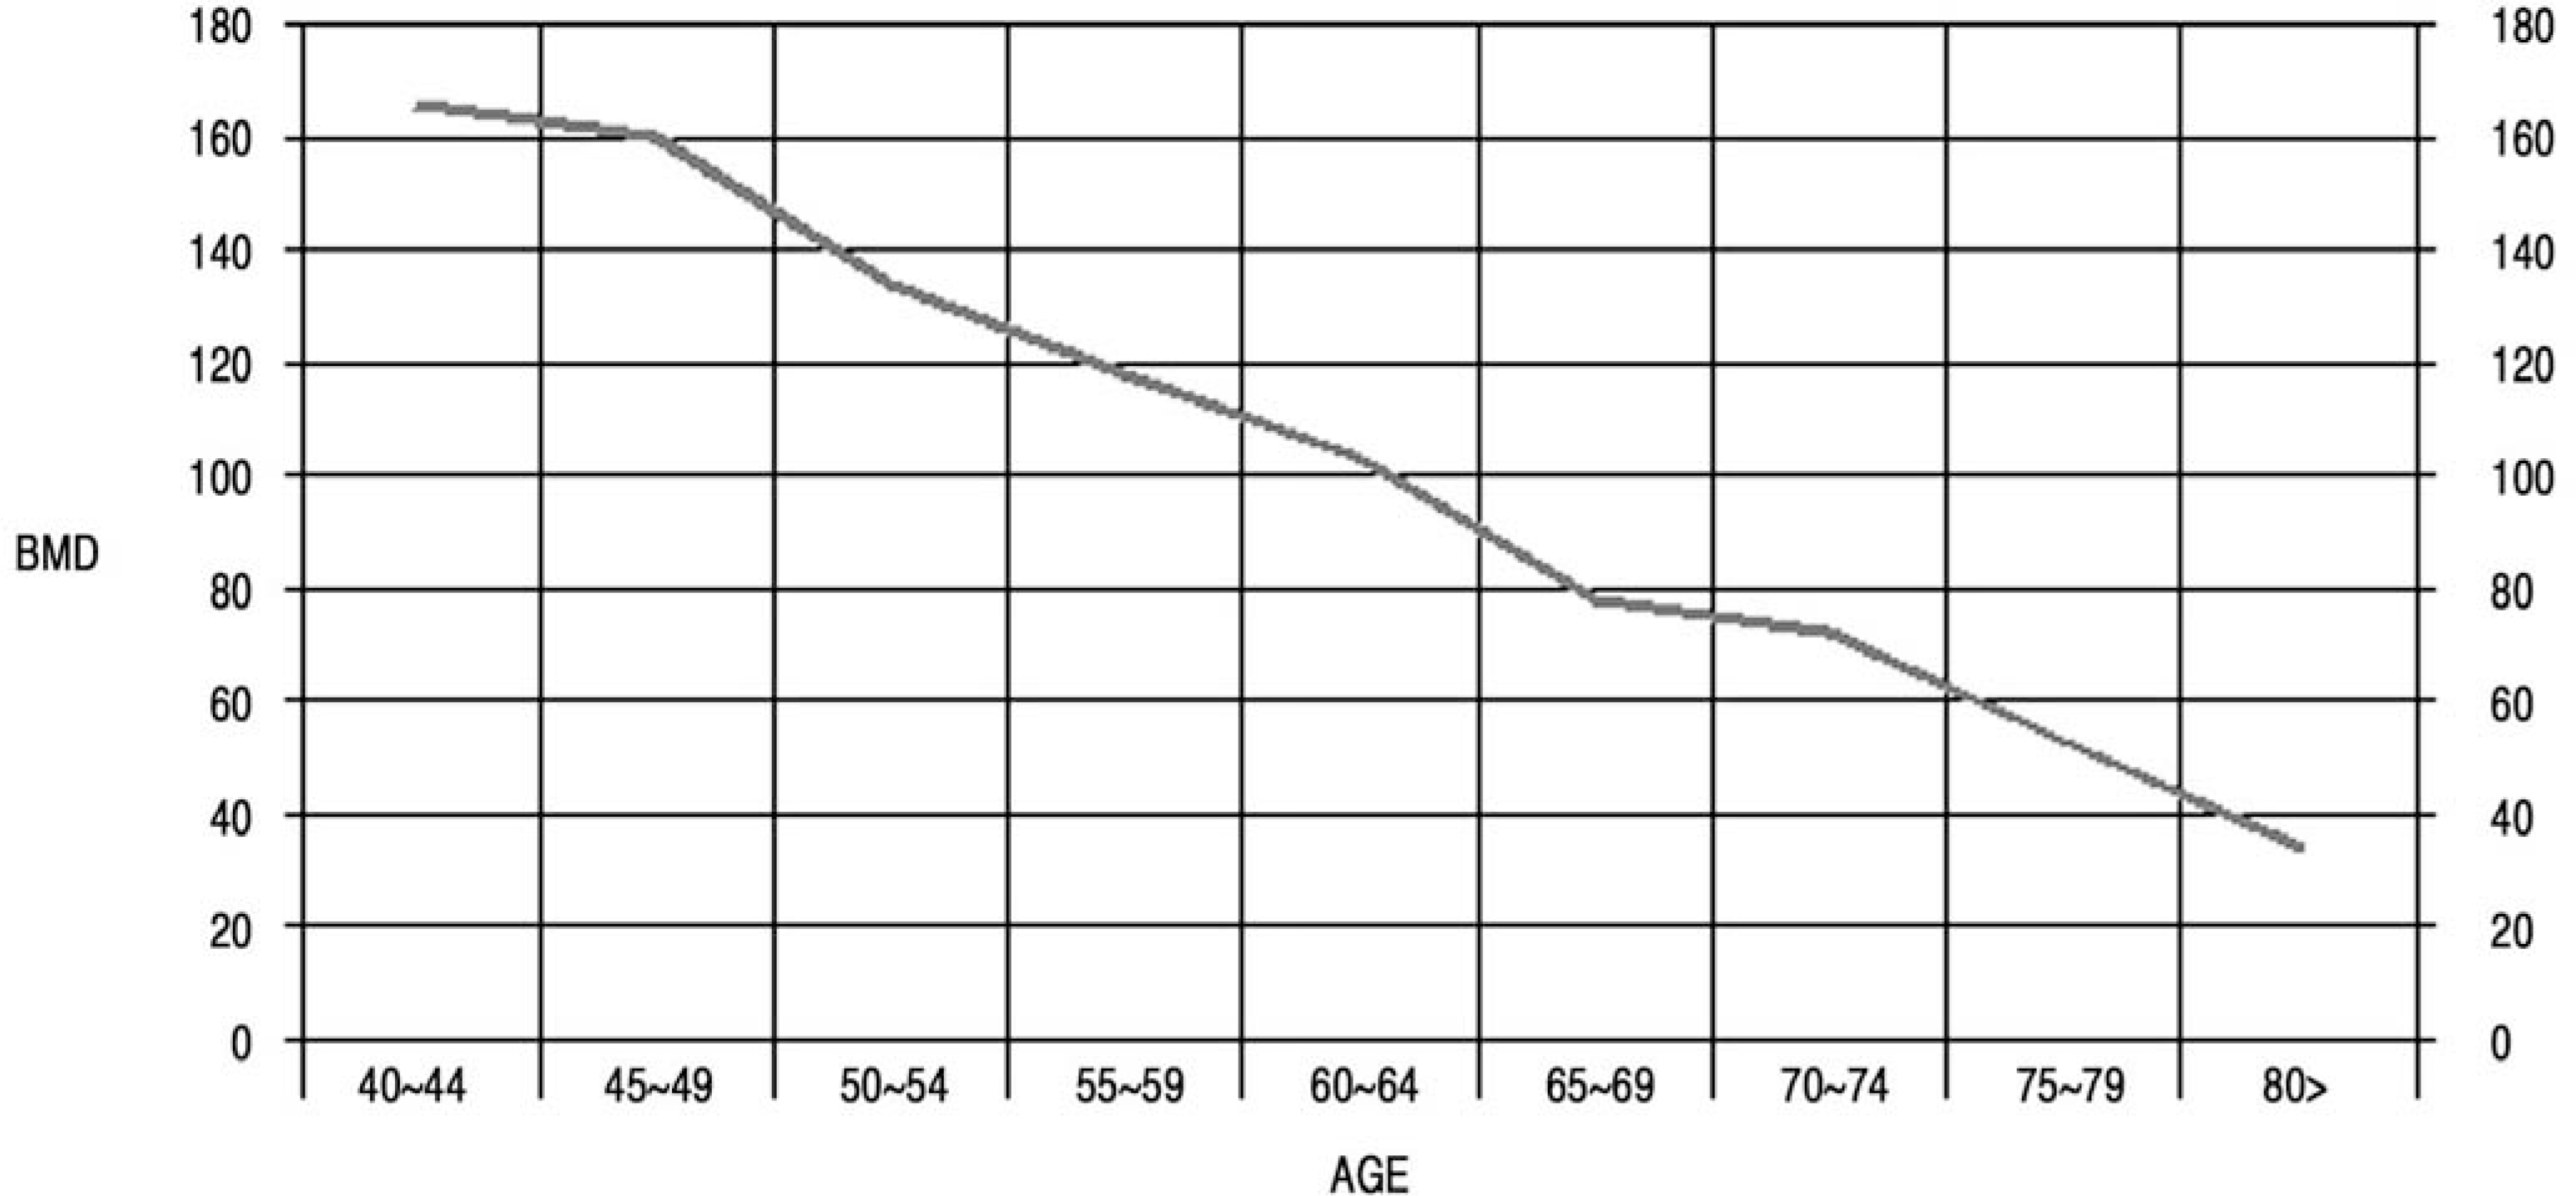
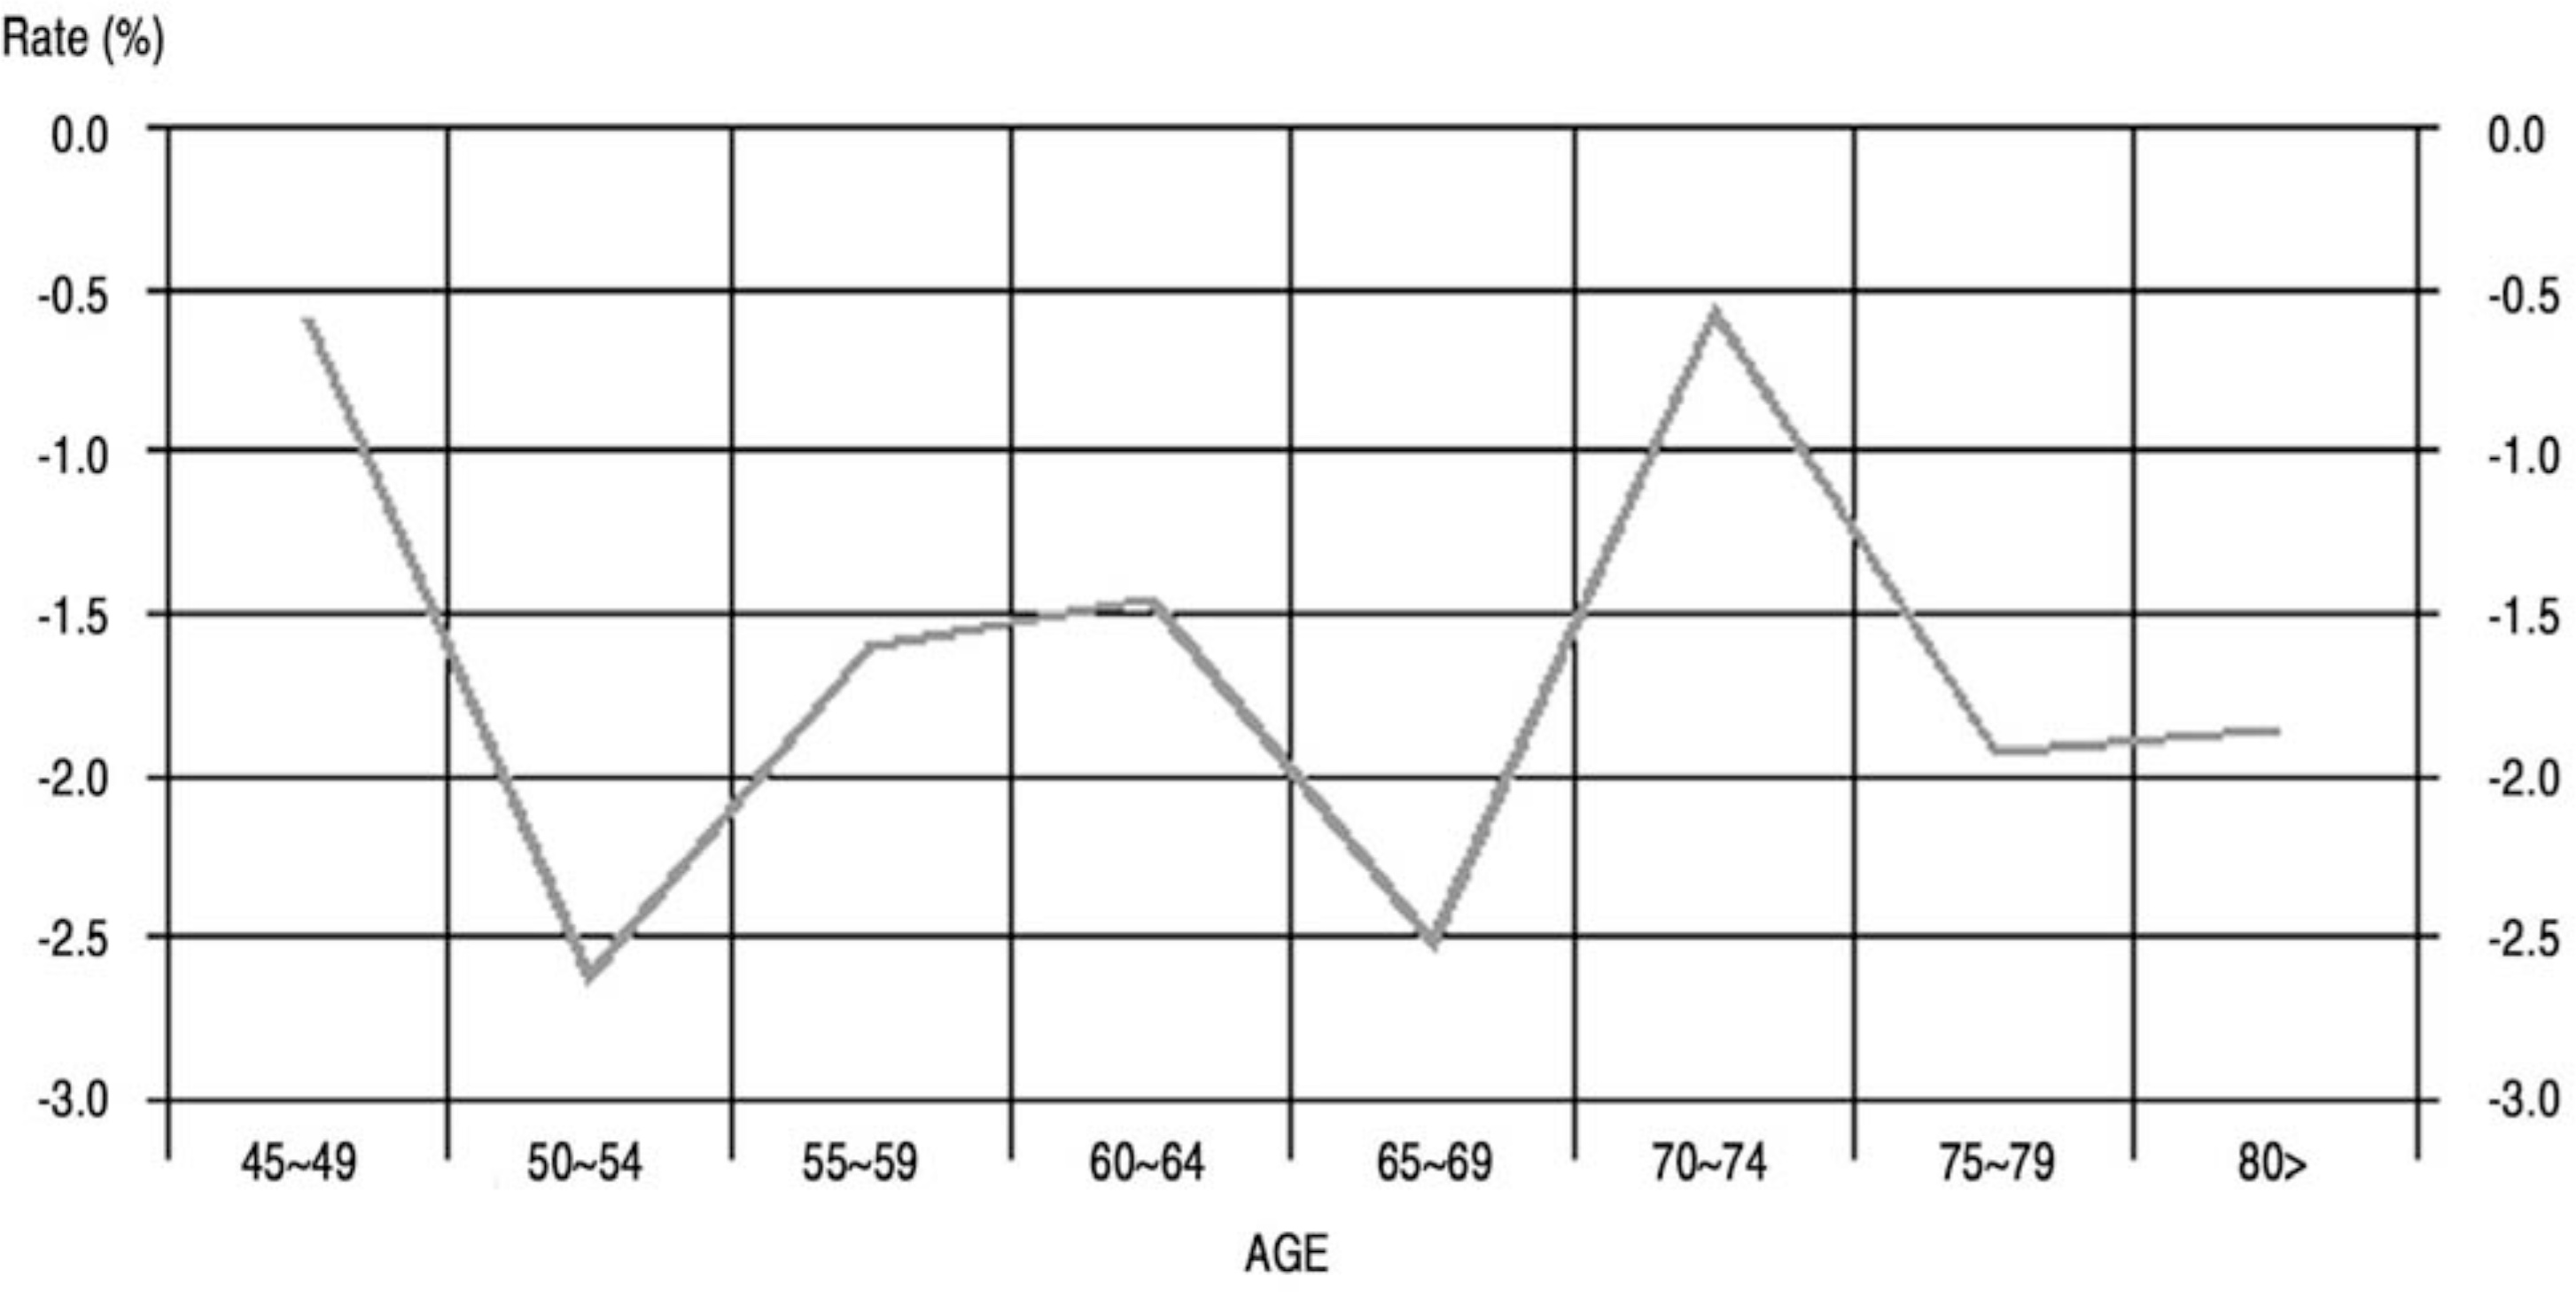
Of 324 subjects between January 2003 to December 2004, postmenopausal women, in whom the mean value of BMD and lumbar vertebrae (L2, L3, L4) were measured by quantitative computed tomography (QCT), were given a questionnaire regarding the level of low back pain over the previous twelve months. The low back pain was divided several groups according to frequency: none, some of the time and most of the time. The spinal fracture was assessed by a simple radiology measurement and divided its into the fracture group and non fracture group. In addition, statistical analysis of the BMD with low back pain and with a spinal fracture was performed. The threshold value of the fracture was calculated using the Riggs method.
Results
Of the 324 subjects, there were 34 cases of spinal fractures in whom the fracture was not caused by high energy trauma. Among the non-fracture groups, low back pain was not associated with a lower BMD. The BMD of the spinal fracture group with osteoporosis was significantly lower than in the non fracture group (p�0.01). The threshold of fracture was 99 mg/cm3 in the 90th percentile.
Go to : 
REFERENCES
1). Min YK, Chung HY, Jang HC, Han IK. Lateral Measurement of Lumbar Bone Mineral Density by Dual-ener-gy X-ray Absorptiometry in Korean Women. Kor J of Bone Metabolism. 1994; 1:70–76.
2). Wanich RD, Ross PD, Heibrun LK, Vogel JM. Prediction of postmenopausal fracture risk with use of bone mineral measurements. Am J Obstet Gynecol. 1985; 153:745–751.
3). Ruegsegger P, Dambacher MA, Ruegsegger E, Fisher JA, Anliker M. Bone loss in premenopausal and postmenopausal women-A cross sectional and longitudinal study using quantitative computed tomography. J Bone Joint Surg Am. 1984; 66(7):1015–1023.
4). Riggs BL, Dunn WL, Mazess RB, Offord KP, MeltonⅢ LJ. Differential changes in bone mineral density of the appendicular and axial skeleton with aging. J Clin Invest. 1981; 67:328–335.
5). Cummings SR, Kelsey JL, Nevitt MC, O'Dowd KJ. Epidemiology of osteoporosis and osteoporotic fractures. Epidemiology Reviews. 1985; 7:178–208.

6). Lim SK, Chung HC, Lee MK, Kim HM, Lee HC, Huh KB. Risk Factors for Osteoporosis in Korean Women. Kor J of Internal Med. 1988; 34(4):444–451.
7). Crilly RG, Frances RM, Nordin BF. Steroid hormons, aging and bone. Clin Endocrinol Metab. 1981; 10:115–139.
8). Jahng JS, Moon SH. Measurement of Bone Mineral Density in Osteoporotic Fracture of the Spine using Dual Energy X-ray Absorptiometry -Evaluation of 154 Post-mentopausal and senile Women-.J Kor Orthop Assoc. 1992; 27:57–64.
9). Bruce E, Dennis MB, Michael CN, et al. Contribution of vertebral deformities to chronic back pain and disability. J Bone Miner Res. 1992; 7:449–456.

10). Ettinger B, Block JE, Smith R, Cummings SR, Harris ST, Genant HK. An examination of the association between vertebral deformities, physical disabilities and psychosocial problems. Maturitas. 1988; 10:283–296.

11). Leidig G, Minne HW, Sauer P, Wuster C, Wuster J, Lojen M, et al. A study of complaints and their relation to vertebral destruction in patients with osteoporosis. Bone Miner. 1990; 8:217–229.

12). Saville PD. A quantitative approach to simple radiographic diagnosis of osteoporosis; its application to the osteoporosis of rheumatoid arthritis. Arthritis and Rheumatism. 1967; 10:416–422.

13). Singh M, Nagrath AR, Maini PS. Changes in trabecular pattern of the upper end of the femur as index of osteoporosis. J Bone Joint Surg Am. 1970; 52(3):457–467.
14). Gamble CL: Osteoporosis. Making the diagnosis in patients at risk for fracture. Geriatrics. 1995; 50:24–33.
15). Riggs BL, MeltonⅢ LJ. Osteoporosis. 2nd ed.Philadelphia: Lippincott-Raven Co;p. 278–283. 1995.
16). Yates AJ, Ross PD, Lydick E, Epstein RS. Radiographic absorptiometry in the diagnosis of osteoporosis. Am J Med. 98(suppl 2A):41S–47S. 1995.

17). Borenstein DG, Wiesel SW, Boden SD. Low back pain.2nd ed. Philadelphia: WB Saunders Co;432-435. 1995.
18). Cann CE, Genant HK, Ettinger B, Gordan GS. Spinal mineral loss in oophorectomized women. Determination by quantitative computed tomography. J Am Med Assoc. 1980; 224:2055–2059.
19). Fujii Y, Tsutsumi M, Tsuenenari T, Fukase M, Yoshi-moto Y, Fujita T, Genant HK. Quantitative computed tomography of lumbar vertebrae in japaneses patients with osteoporosis. Bone and Mineral. 1989; 62:87–94.
20). Ku YM, Jee WH, Choe BY, el al. Relationship between bone mineral density of lumbar spine and fatty replacement of lumbar paraspinal muscles by Quantitative computed tomography. J Korean Radiol Soc. 1998; 38:163–167.
21). Song SH, Shim CG, Seo H. Change in bone mineral density according to aging in Korean women -Study of Using Quantitative Computerized Tomography- J Kor Orthop Assoc. 2000; 35:277–282.
22). Riggs BL, Wahner JW, Sterman JE, et al. The change in bone mineral density of the proximal femur and spine with aging. J Clin Invest. 1983; 70:716–723.
23). Yong SJ, Lim SK, Hug KB, Park BM, Kim NH. Bone Mineral Density of Normal Korean Adults. J Kor Med Assoc. 1988; 31-12:1350–1358.
24). Kwon DJ, Yoo YO, Kim JH, et al. pre-and postmenopausal bone mineral density of the spine in normal Korean women. Korean J of Obstetrics and Gynecology. 1994; 37:2395–2399.
25). Genant HK, Ettinger B, Cann CE. Osteoporosis: assessment by quantitative tomography. Orthop Clin North America. 1985; 16:557–568.
Go to : 
Figures and Tables%
Table 1.
Prevalence of back pain by BMD Z-score in non fracture group
Table 2.
Comparison of BMD and frequency of spinal fracture in each age group


 PDF
PDF ePub
ePub Citation
 Print
Print


 XML Download