Abstract
Objectives
To validate a treatment plan by analyzing the clinical outcome of conservative treatment for patients with osteoporotic vertebral compression fractures at thoracolumbar junctions.
Summary of Literature Review
Osteoporotic vertebral compression fractures, without neurological symptoms, have been treated by conservative management; however, serious sequelae of the osteoporotic vertebral compression fractures have been reported by many investigators.
Materials and Methods
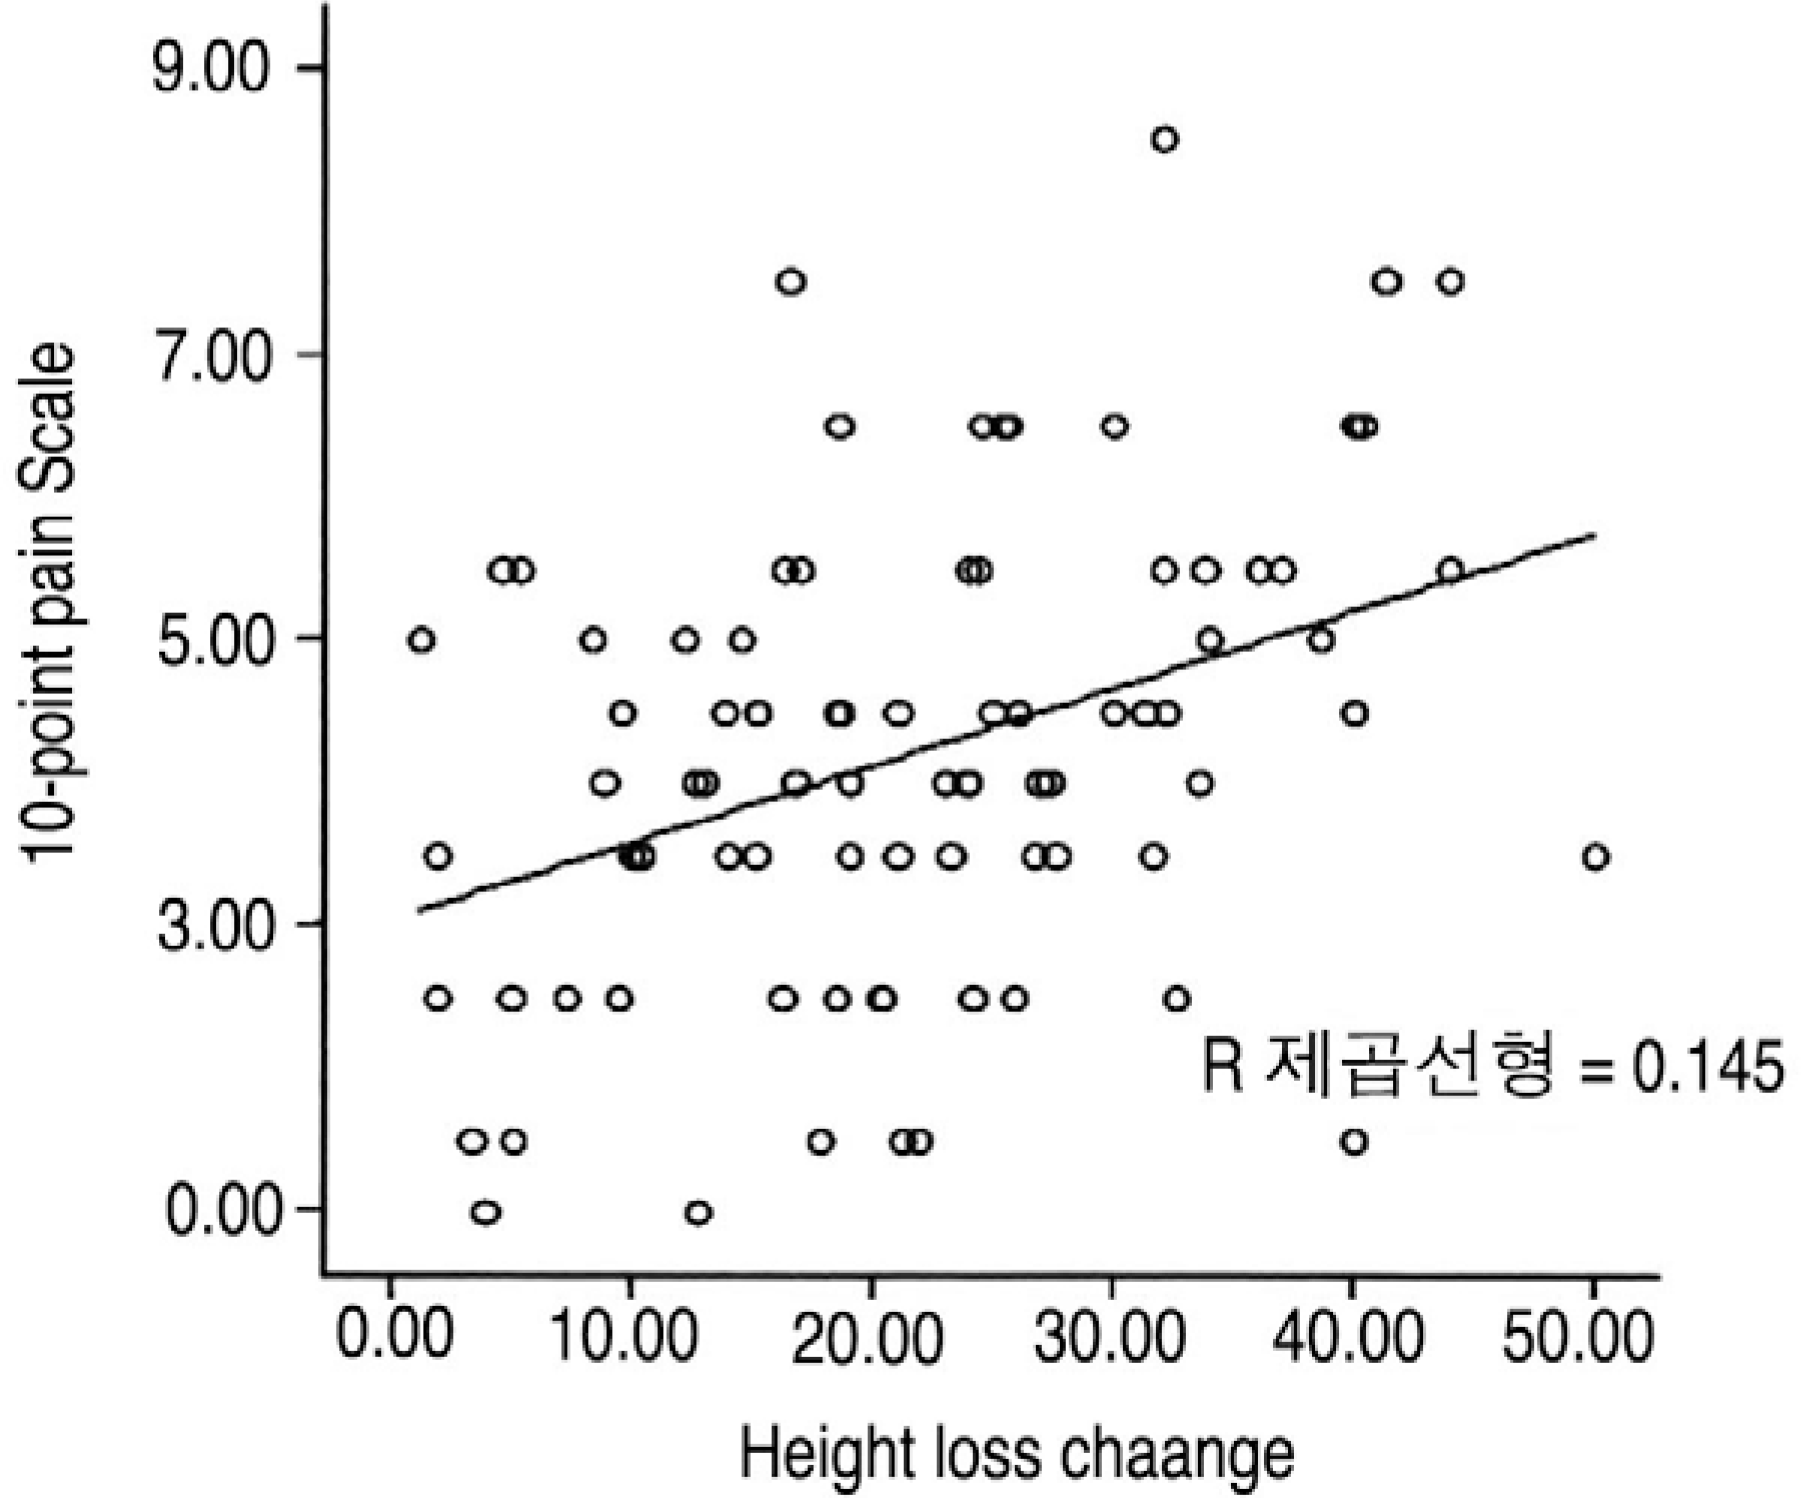
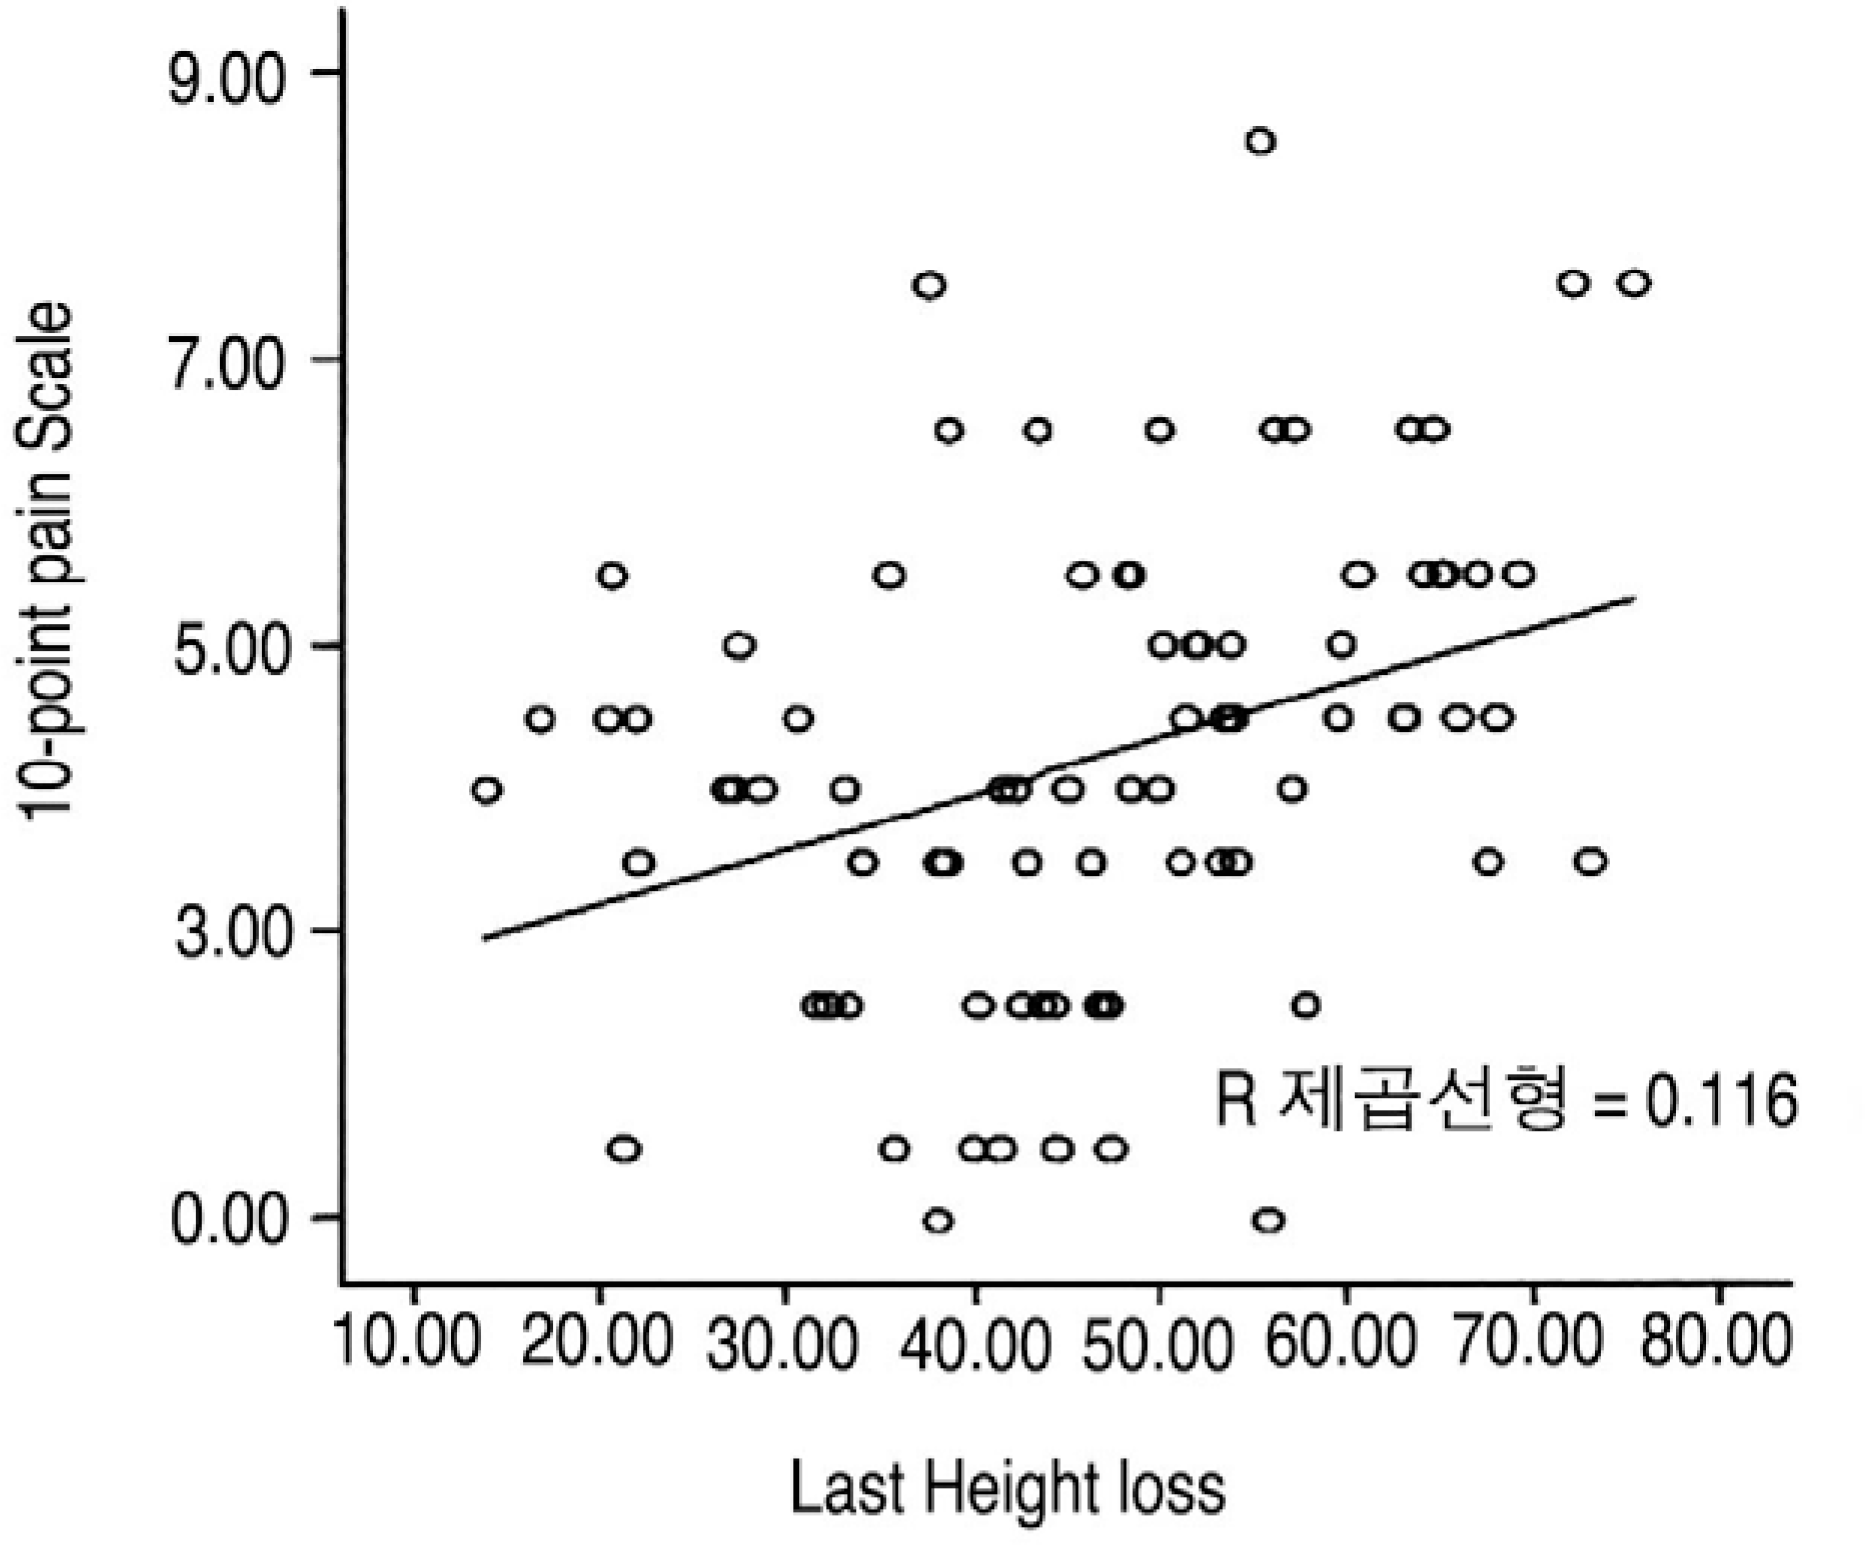
We evaluated 83 cases; 68 patients had an average age of 71.1 years (58 to 99 years). After conservative treatment of the osteoporotic compression fractures, and based on the clinical outcome derived from a 10-point pain rating scale at last follow up, the group was subdivided into two groups. Group A (N=28): had a score of above five points on the pain scale. Group B (N=55): had a score of less than five points on the pain scale. Evaluation of the correlation between the clinical outcome and factors affecting outcome such as vertebral body height loss, change in height loss, BMD and bracing were recorded at the initial and follow up assessment.
Results
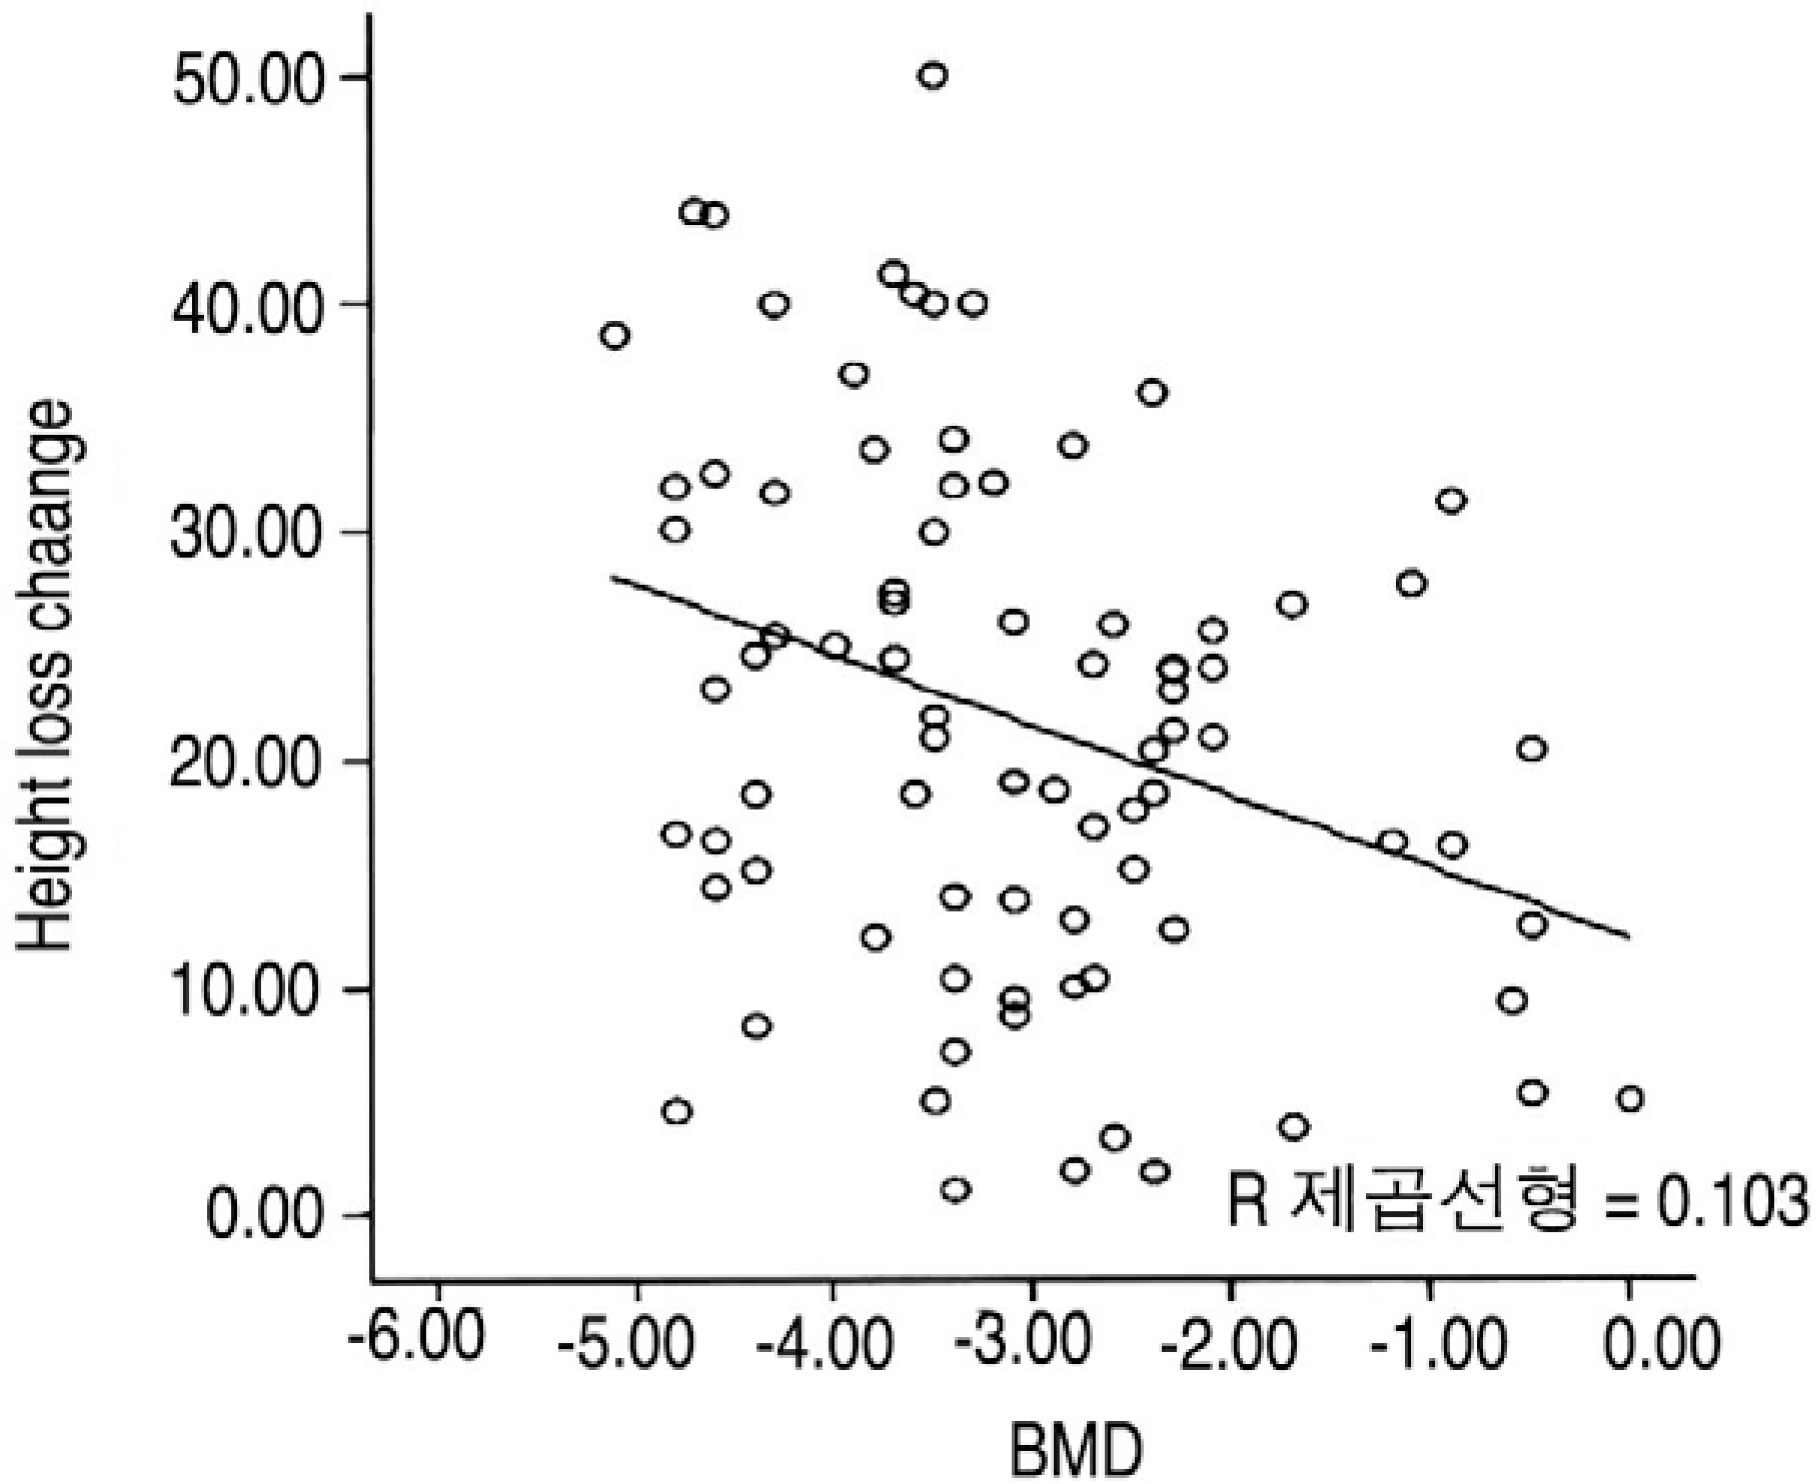
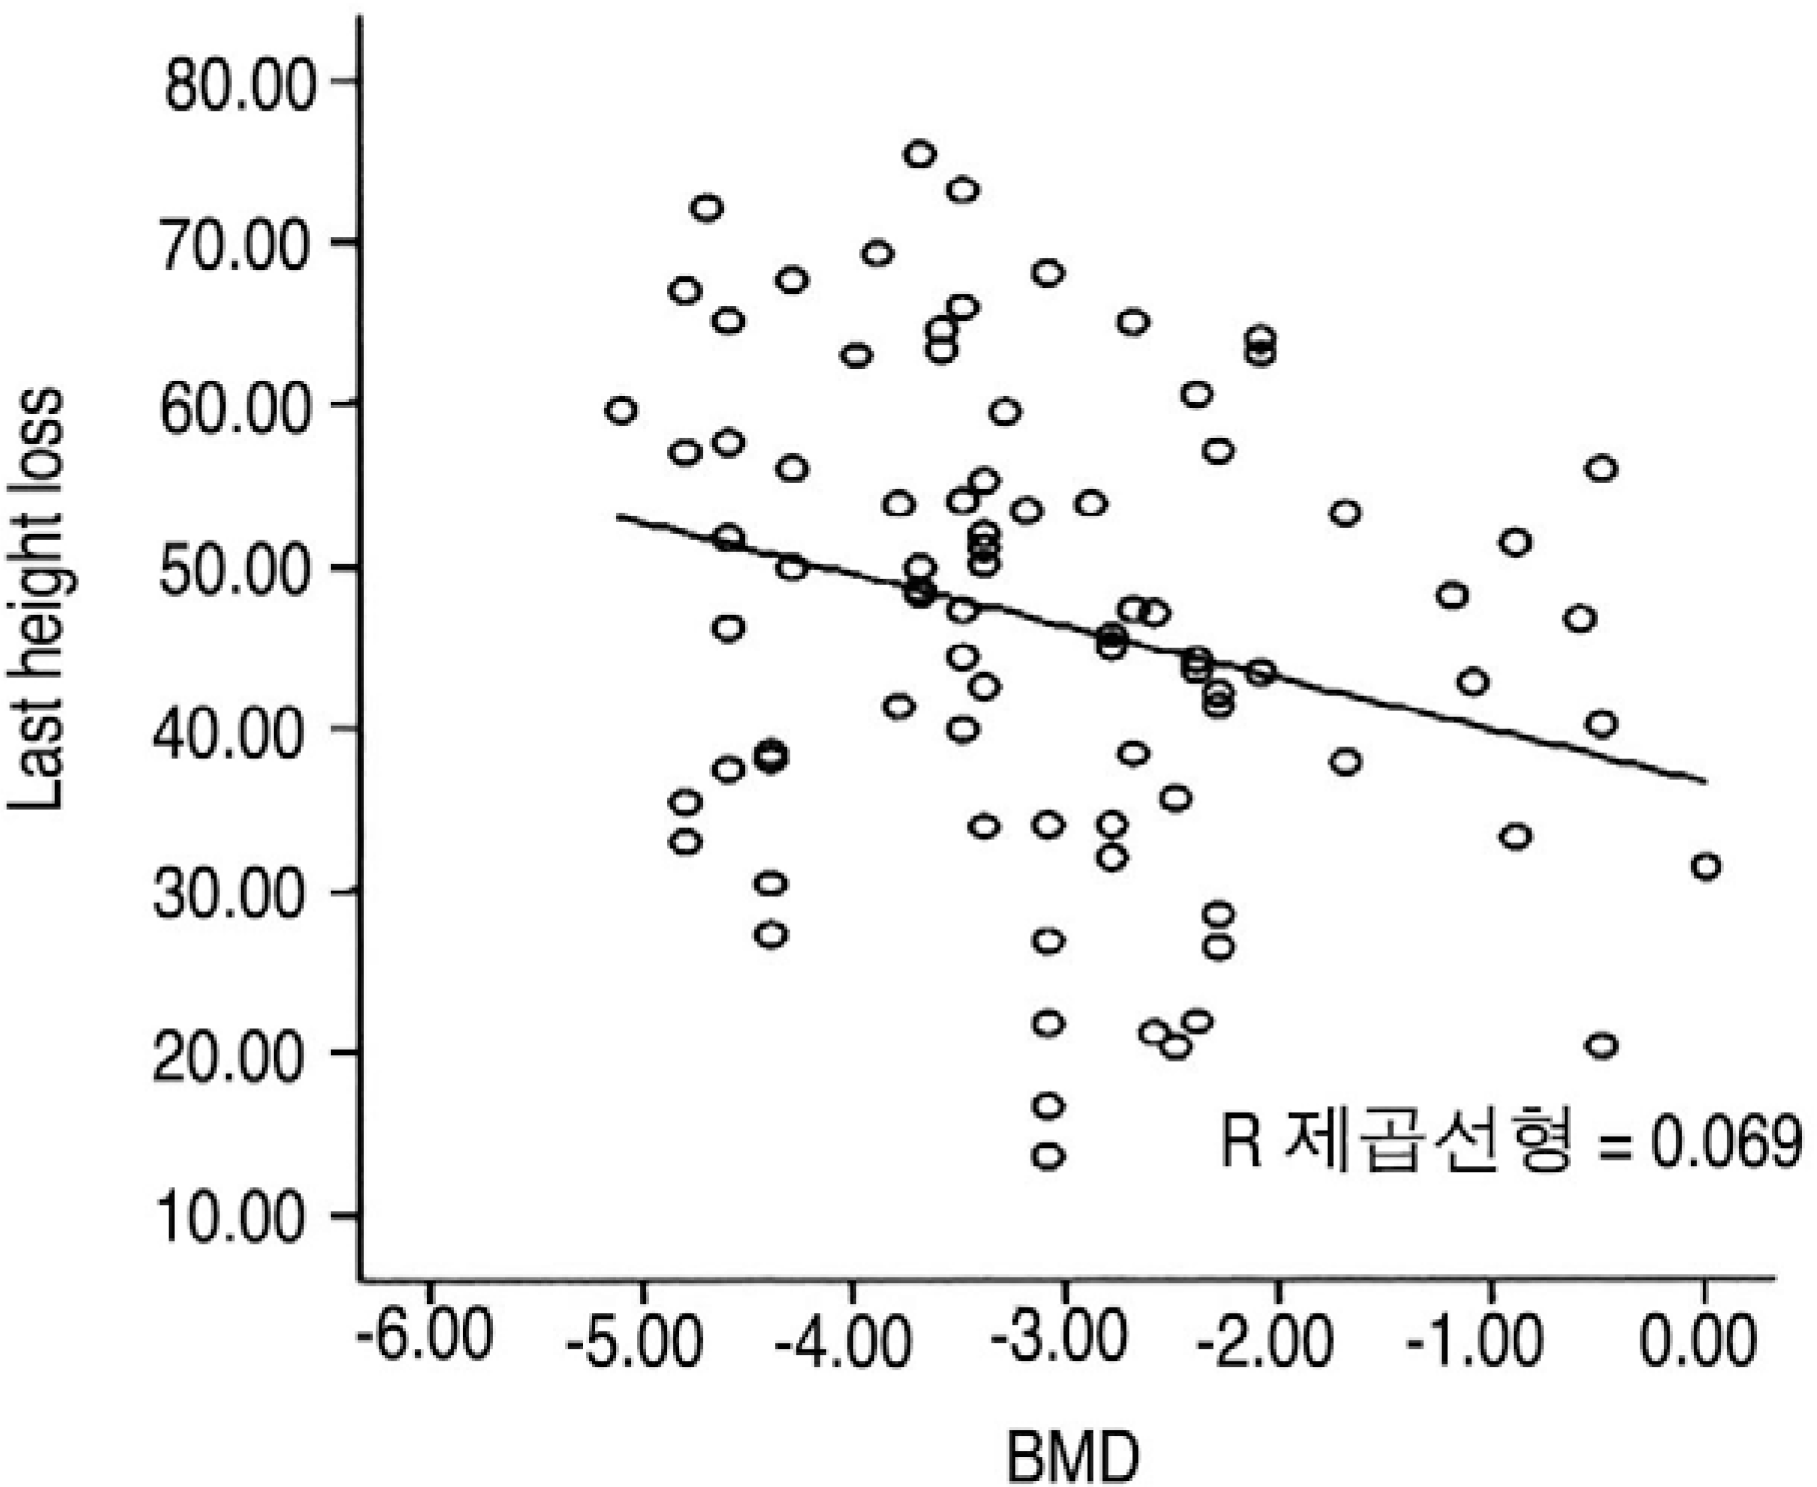
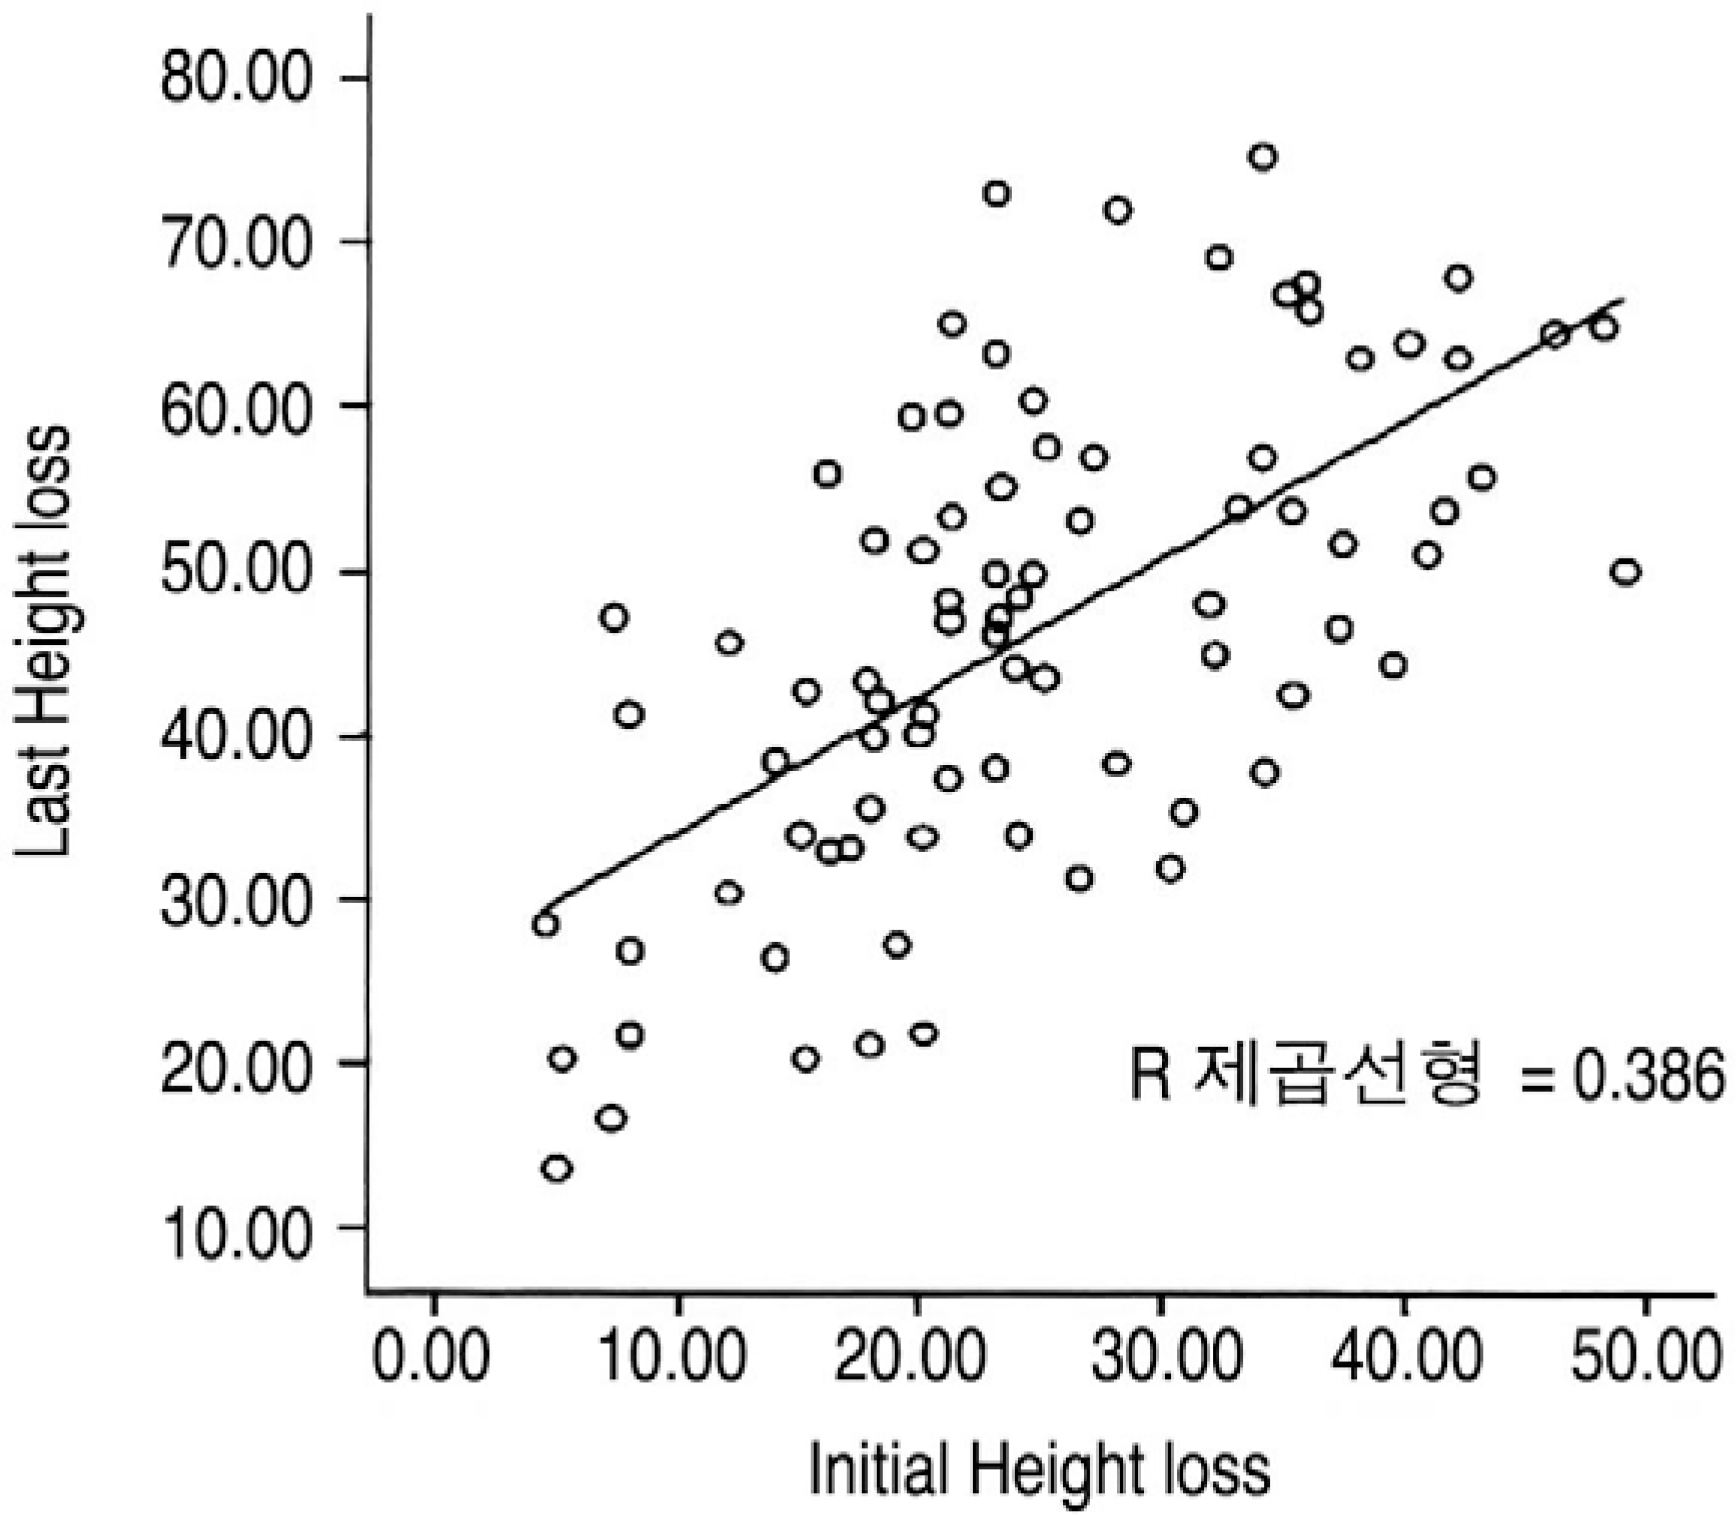
The mean VAS score was 3.20 1.62, and the mean compression ratio was 24.74 12.03% at injury and 21.68 11.43% at the last followup. The mean compression ratio at injury was 27.67 10.50% in group A and 23.25 10.57% in group B. The mean compression ratio at the last followup was 53.43 13.31% for group A and 42.86 13.74% for group B. The change in compression ratio was 25.76 12.68% in group A and 19.60 10.25% in group B. The mean BMD was -3.63 1.16 for group A and -2.80 1.10 for group B. The compression ratio at last followup, change of compression ratio and BMD were significantly different in comparisons between group A and B (p=0.001, 0.031, 0.003, respectively).
Conclusion
The clinical outcome of osteoporotic compression fractures was related to the compression ratio, and the compression ratio was related with BMD. Patients with osteoporotic compression fractures with a compression ratio of more than 30% and a T-score from the BMD of less than -3.5 require active treatment.
REFERENCES
1). Kim SW, Chung YK. Longterm followup osteoporotic vertebral fractures according to the morphologic analysis of fracture pattern. J Korean Spine Surg. 2000; 7:611–617.
2). Melton LH 3rd, Kan SH, Frye MA, Wahner HW, O'Fallon WM, Riggs BL. Epidemiology of vertebral fractures in women. Am J Epidemiol. 1989; 129(5):1000–1011.

3). Reid DC, Hu R, Davis LA, Saboe LA. The nonoperative treatment of burst fractures of the thoracolumbar junction. J Trauma. 1988; 28:1188–1194.

4). Westerborn A, Olsson O. Mechanics treatment and prognosis of fracture of the dorsolumbar spine. Acta Chir Scand. 1951; 102:59–83.
5). Jung HW, Park JY, Kim KJ, Lee JC, Kim YI, Shin BJ. Conservative treatment of compression and stable burst fractures in the thoracolumbar junction: early ambulation Vs. late ambulation. J Korean Orthop. 2002; 37:483–488.

6). Suk SI, Lee CK, Kang HS, et al. .:. Vertevral fracture in Osteoporosis. J Korean Orthop. 1993; 28:980–987.
7). Weinstein JN, Collalto P, Lehman TR. Thoracolumbar burst fractures treated conservatively a longterm followup. Sine. 1988; 13:33–38.

8). Bengner U, Johnell O, et al. Changes in incidence and prevalence of vertebral fracture during 30 years. Calcif Tissue Int. 1988; 42(5):293–296.
9). Cupper C. The crippling consequences of fractures and their impact on quality of life. Am J Med. 1997; 103:12–19.
10). Leech JA, Dulberg C, Kellie S, Pattee L, Gay J. Relationship of lung function to severity of osteoporosis in women. Am Rev Respir Dis. 1990; 141:68–71.

11). Schlaich C, Minne HW, Bruckner T, et al. Reduced pulmonary function in patients with spinal osteoporotic fractures. Osteoporosis Int. 1998; 8:261–267.

12). Koh YD, Kim JO. Risk factors in progression of deformity in compression fracture of thoracolumbar junction. J Korean Society Fractures. 1999; 12:372–378.

13). Yamazaki K, Kushida K, Kin K, et al. Bone Mineral density of the spine and femoral neck fracture in normal japanese subjects using X-ray absorptiometry. J Bone Min Res. 1989; 4(1):228.
14). Heggeness MH. Spine fracture with neurological deficit in osteoporosis. Osteoporosis Int. 1993; 3(4):215–221.

15). Itoi E, Sakurai M, Mizunashi K, Sato K, Kasama F. Longterm observations of vertebral fractures in spinal osteoporotics. Calcif Tissue Int. 1990; 47(4):202–208.

Figures and Tables%
Fig. 1.
The schematic presentation to the degree of compression ratio(F) of injuried spinal body, F=(1-2b/(a+c))×100.
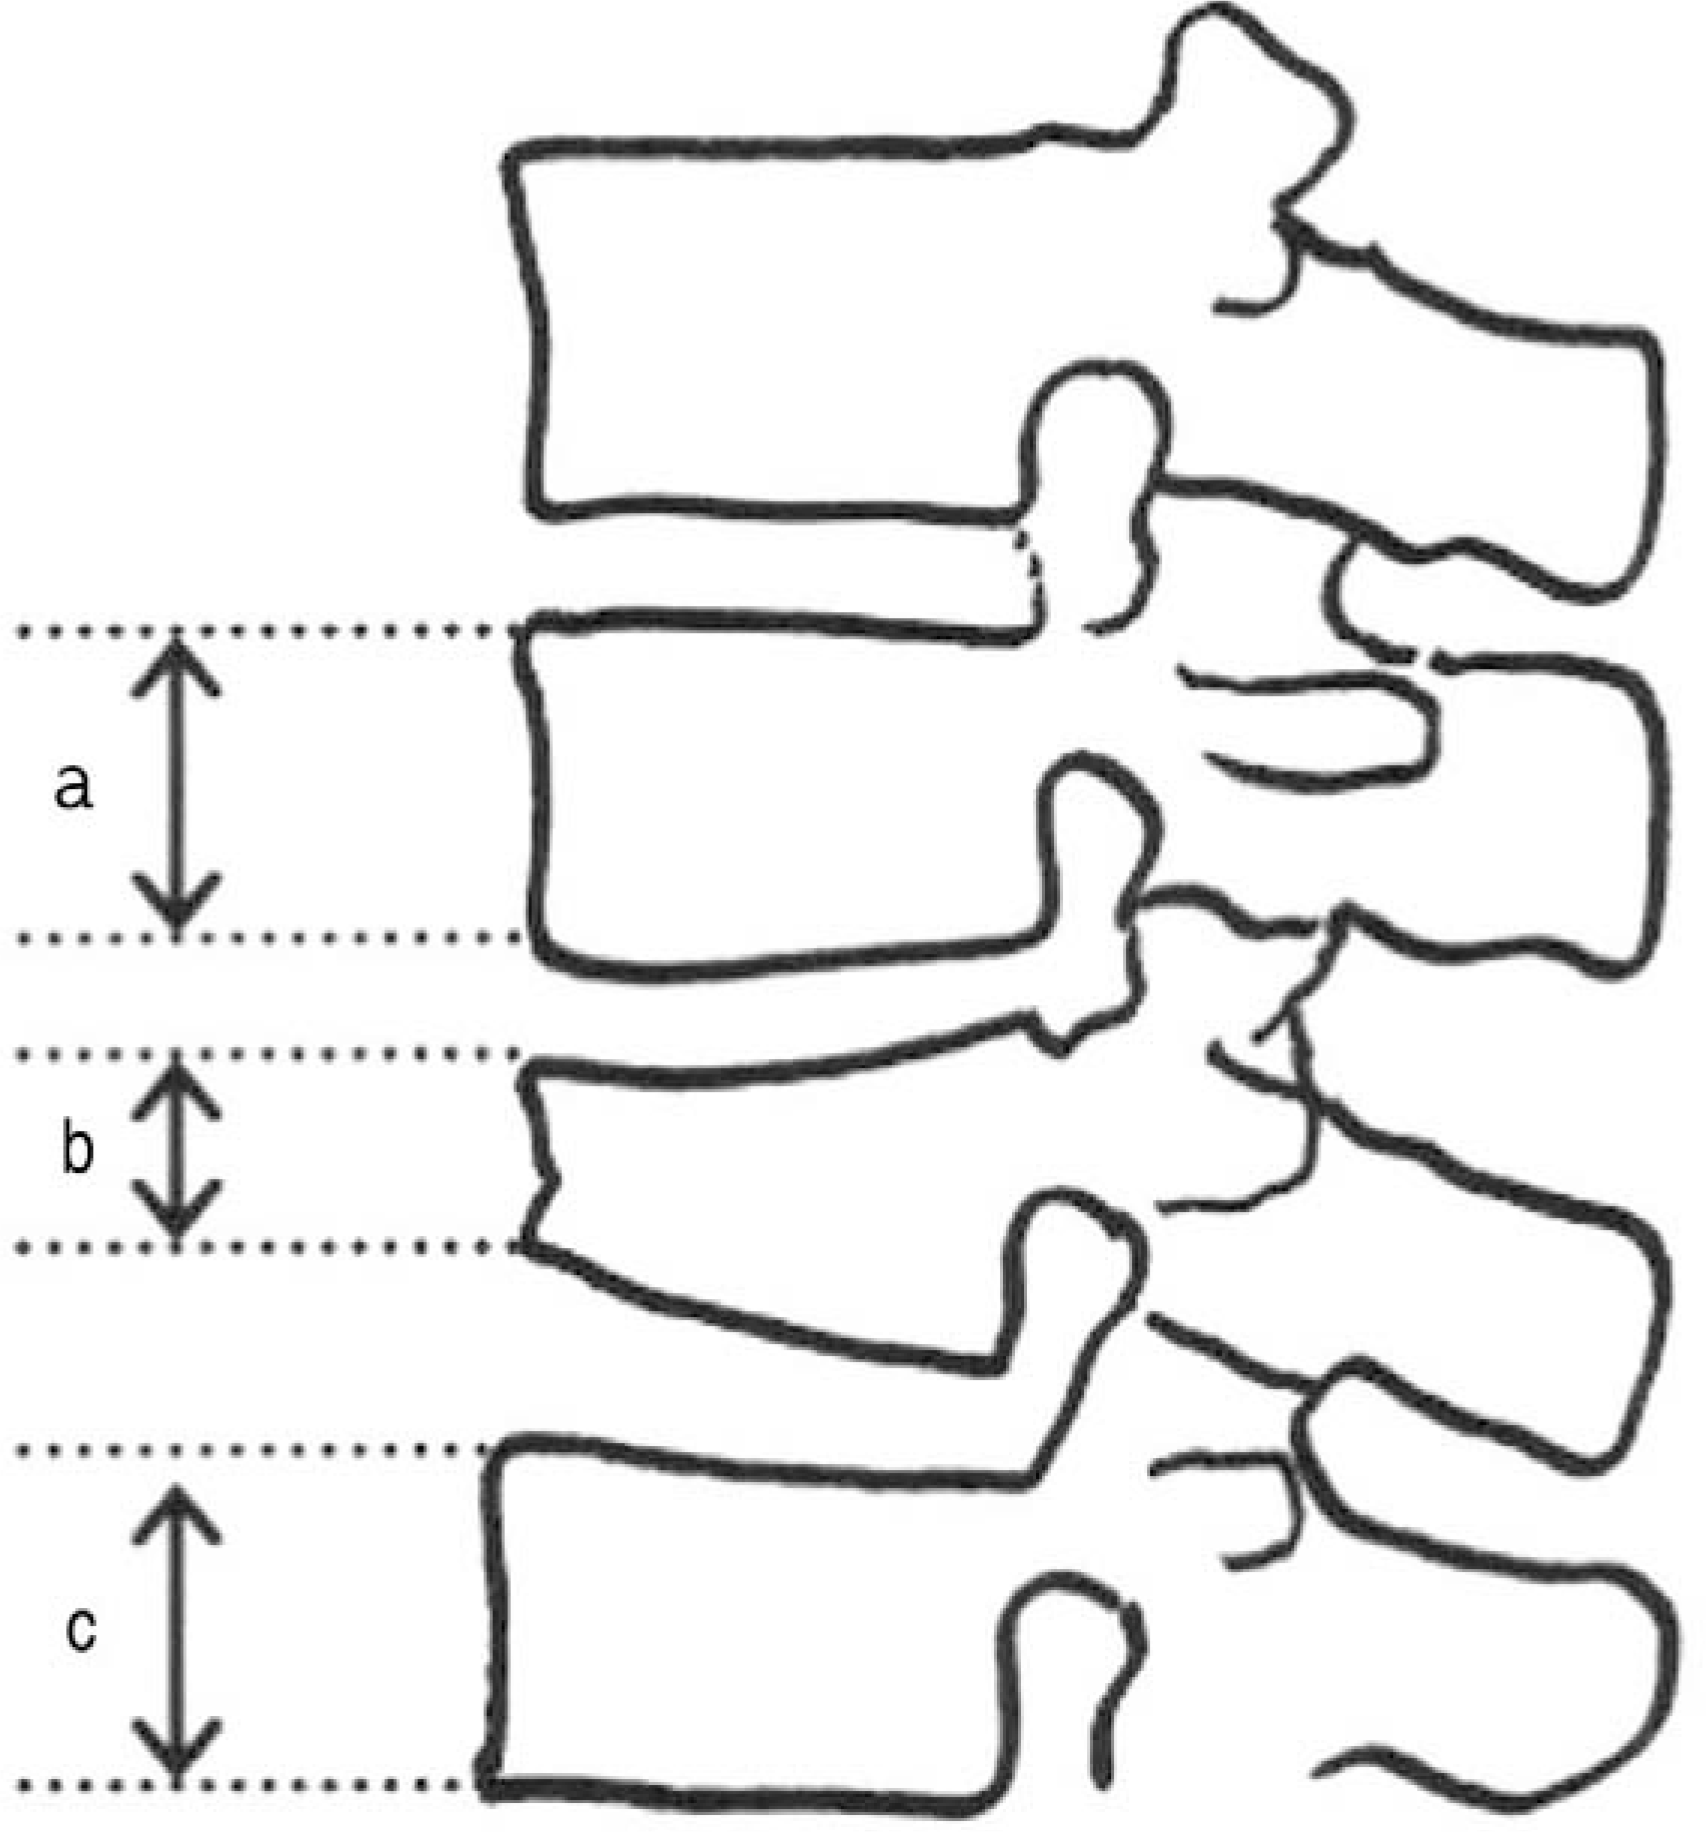
Table 1.
Distribution of fractures level
| Level | Male | Female | Total |
|---|---|---|---|
| T11 | 00 | 05 | 05 |
| T12 | 02 | 25 | 27 |
| L1 | 06 | 29 | 35 |
| L2 | 03 | 13 | 16 |
| Total | 11 | 72 | 83 |
Table 2.
Clinical and radiologic data of group A and group B
| Group A∗ | Group B† | p-value | |
|---|---|---|---|
| Age | 72.39±9.85% | 70.51±5.71% | p>0.05 |
| Male : Female | 6:22 | 5:50 | p>0.05 |
| T-score of BMD | -3.63±1.16% | -2.80±1.10% | p=0.003 |
| Compression ratio | |||
| Initial | 27.67±10.50% | 23.25±10.57% | p=0.076 |
| Last F/U | 53.43±13.31% | 42.86±13.74% | p=0.031 |
| Change | 25.76±12.68% | 19.60±10.25% | p=0.001 |


 PDF
PDF ePub
ePub Citation
 Print
Print


 XML Download