

 PDF
PDF ePub
ePub Citation
 Print
Print


I. Introduction
Breast cancer is one of the most common cancers in women1)2). The known risk factors are age at diagnosis, age of menarche, genetic risk, and family history3-6). The most widely accepted prognostic factor for breast cancer is the American Joint Commission on Cancer (AJCC) staging system based on the TNM system (T, tumor; N, node; M, metastasis)7-11). The Nottingham prognosis index is a grading system that incorporates the evaluation of tumor size, stage of disease, and tumor grade12)13). Recently, molecular biologic markers, such as the estrogen receptor, progesterone receptor, and HER-2/neu, have become important prognostic factors14-16).
Several studies have reported on breast cancer prognosis prediction using data mining techniques. Burke et al. constructed an artificial neural network (ANN)model using TNM variables, demographic variables, and anatomic variables in the prediction of 10-year survival of breast cancer17). They used 6,787 cases of the National Cancer Institute's Surveillance, Epidemiology, and End Results (SEER) breast carcinoma data set (1977-1982). The ANN model achieved a superior prediction accuracy of 73.0%, compared to that of 69.2%for the TNMstaging system.
Choi constructed an ANN model for breast cancer screening using 1143 Korean subjects (case 272, control 871). The classification performance of the model was 0.76, sensitivity 0.72 and specificity 0.7118). Lee compared various predictivemodeling techniques to predict the breast cancer occurance (not prognosis) by using Korean data obtained from 209 subject (109 patients and 100 controls). The AUC of the proposed Naïve Bayes model was 0.90, and it outperformed than other various Bayesian network models or regression models19).
Lundin et al. compared logistic regression and ANN models for survival estimation in 951 breast cancer cases20). Eight variables were entered as input to the network, including tumor size, axillary node, histologic type, mitotic count, nuclear pleomorphism, tubule formation, tumor necrosis, and age. The area under the curve (AUC) of the ANN was 0.909 and that of logistic regression was 0.879.
Delen et al. compared ANN, decision tree, and logistic regression techniques for breast cancer survival estimation using the SEER data set (1973-2000)21). Twenty variables were used in the prediction models. The decision tree and ANNwere superior to logistic regression (accuracy: 93.6%, 91.2%, and 89.2%, respectively).
Generally, ANNshows good estimation power for breast cancer prognosis. ANNhas the advantage of a fast response with higher accuracy and real-time model modification. Nonetheless, amajor disadvantage of neural networks stems from difficulties in their representation of knowledge. Acquired knowledge in the form of nodes and weighted links cannot be interpreted easily, and the system does not explain the result22).
The Bayesian network (BN) is a probabilistic model that consists of dependency structure and local probability. It uses prior probability in the prediction of dependent variables. Usually, the structure of the network is constructed by domain experts based on their medical training and experience with previous cases. The probabilities are calculated using statistics from cases. The BN model is transparent and can be more attractive to clinicians because the influences and relations of the nodes are visualized through graphical models and the resulting decision is represented with a belief probability.
We propose a hybrid BNmodel using a confidence value of the ANN output node to predict 5-year survival rates for breast cancer. With the same input nodes, an ANN model and a BN model are constructed independently. The confidence value of the ANN output node is presented to the BN model as an additional input node. As a result, the hybrid BN model uses the confidence value of the ANN output node as an additional input node. The sensitivity, specificity, accuracy and AUC of the three models are compared for performance evaluation.
II. Methods
In order to develop the models, we adopted the general data mining process: 1) cleaning and integration, 2) selection and transformation, 3) data mining, and 4) evaluation. At the first and second stages, we performed the data cleaning and variable selection by using statistic summaries. We chosen Artificial neural network, Bayesian Network, and hybrid algorithms for predicting the breast cancer survivability and performed data mining. Finally, we evaluated the result models with accuracy, sensitivity, specificity, and AUC. As the following, we describe each stage in detail.
1. Data collection
We used the SEER program (www.seer.cancer.gov) public-se data (1973-2003). The SEER programis a part of the Surveillance Research Program (SRP) at the National Cancer Institute and is responsible for collecting incidence and survival data from the nine participating registries, and disseminating these data sets to institutions and laboratories for the purpose of conducting analytical research Cancer incidence trends and mortality rates in SEER are assumed to be representative of the cancer incidence trends and mortality rates for the entire United States1).
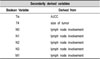
We accessed 505,367 records and 86 variables of breast cancer data. These 86 variables describe sociodemographic and cancer-pecific information of an incidence of cancer. Each record contains particular patient-elated tumor information. Extensive variable selection procedures were performed on the 86 variables. Briefly, the following variables were removed: those that had more than 70.0% missing values, categorical variables that had a single category accounting for more than 90.0% of cases, continuous variables that had standard deviation less than 0.1%, and continuous variables that had a coefficient of variation (SD/mean) less than 0. For input variable selection, we tried to limit the number of variables and select only the clinically relevant variables. After subsequent 'trial and error' exercises, nine variables were selected as input for model construction. Of them, seven variables were used for primary input nodes: age at diagnosis (AgeAtDx), AJCC stage 3rd edition (AJCC), clinical extension of tumor (ExtTumor), histologic type ICD 10 (Histology_ICD10), number of primary (NoPrimary), site-pecific surgery (Surgery), and scope of regional lymph node surgery (RegionalLNSurgery). The other two variables (size of tumor and lymph node involvement) in combination with 'histologic type ICD 10' and 'clinical extension of tumor' were used to derive each stage (T, N, and M). Of the TNMs, T1, T2, T3, and M0 were removed from input nodes because of their weak discriminative power, and Tis, T4, N0, N1, N2, N3 andM1 were added as input nodes (Table 1, Table 2).
Records not containing an 'AJCC stage 3rd edition' value were excluded fromthe analysis. As the 'AJCC stage 3rd edition' variablewas introduced to the SEER data set in 1988, the resulting data set only contained records from 1988 to 2003.
Although some continuous variables such as clinical extension of the tumor, site-specific surgery, and scope of regional lymph node surgery are not actually continuous variables in nature, they were treated as continuous values as they were arranged in order of disease severity.
To develop models for predicting survival in an incidence of breast cancer, the target variable 'Survival' defined as a 'patient who survives more than 60 months after the date of diagnosis'. After data cleansing and data preparation, we obtained the final data set with 294,275 records and 15 variables (seven primary variables, seven derived variables, and one target variable).
2. Prediction models
(1) The artificial neural network model
Artificial neural networks simulate human thinking and learn fromexamples. ANNs consist of nodes called neurons and weighted links between the neurons. Each neuron processes incoming information and may propagate information forward if warranted by its activation function. Although many types of ANN models exist, such as the radial basis function and the Hopfield network, the multilayered perceptron (MLP) has become the most popular method of training neural networks with the introduction of the back-propagation algorithm24). The neurons in theMLP are arranged in layers. The topology of MLP in this study has an input layer with 40 input neurons derived from 14 variables (4 node from 4 continuous type variable, 29 nodes from 3 categorical variables, 7 nodes from 7 boolean type variables, Table 1 and 2), two hidden layers (the first layer with seven neurons and second layer with nine neurons), and the output layer (with one output neuron). Each neuron of the two hidden layers and the output layer has bias nodes to set thresholds for nodal activation. The activation functions of the hidden layers and the output layer are logistic transfer functions.
We used a method called back-propagation of error, based on the generalized delta rule, for training our model. All weights and biases in the network were set to random values in the interval -0.5≤wij≤0.5. Records were presented in epochs, where each epoch involved presenting n randomly selected training data observations to the network, where n is the number of records in the training data. For each record, information flows through the network to generate a prediction. The error between the predicted value and the target value found in the training data for the current record is propagated back through the network to recursively compute weight changes. To be more precise, the change in Δw for updating theweights is computed as
where η is the learning rate parameter, δpi is the propagated error, opi is the output of neuron i for record p, α is the momentum parameter, and Δwij(n) is the change value for wij in the previous cycle. We set momentum of alpha at 0.9, initial eta at 0.3, eta decay at 30, high eta at 0.1, and low eta at 0.01.
The propagated error value δpi is calculated based on where the neuron is located in the network. For a neuron i in the output layer, it is computed by
where tpi is the known target value of the given training record p.
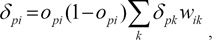
where wik is theweight of the connection fromneuron i to a neuron k in the next layer, and δpk is the propagated error of neuron k. Weights are updated immediately as each record is presented to the network during training. To avoid the possibility of overfitting the data, we randomly split the training data into two sets, with 50% for training and 50% for monitoring.
To discriminate the relative importance of input nodes, sensitivity analysis was performed for each neural network model. We calculated the sensitivity of an input node by varying the value of that input value for each record, and determined the difference between the maximum and minimumoutputs. This maximum difference was calculated for every record, and then averaged.
(2) The Bayesian network model and the hybrid Bayesian network model
A Bayesian network is a method for representing probabilistic relationships between variables associated with an outcome of interest.ABayesian network denoted by N(G, P) consists of two components: an acyclic direct graph G=(V, E) and a set of conditional probability distributions P. Each node of G represents a randomvariable. Links or arcs between nodes represent a probabilistic dependency. In addition, each node has a conditional probability table (CPT) quantifying the effects that parents have on the node25).
To develop a Bayesian network, a network structure must first be constructed. Two ways can be used to build the topology of the Bayesian network. The first involves using domain experts who usually have a good grasp of the direct conditional dependencies in the domain to develop the structure of the Bayesian network. The second involves using structure learning algorithms, such as genetic algorithms, to construct the network topology fromtraining data. In our case, the network structure was designed by expert opinion and extensive repeat evaluations of model accuracy. Fourteen dependent variables and one target variable were also used for the Bayesian network model. All of the continuous variables were discretized. The selected variables and their possible states in our network are summarized in Table 1, Table 2.
In addition to the network topology, it is necessary to specify a CPT for each node. When all variables are fully observable and the structure of the network is known, the CPT can be estimated directly using statistics from the training data.
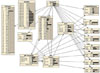
To combine the good estimation power of ANN with the good explanation ability of BN, we proposed a hybrid BN model. This model used the same input nodes as the previous BN model, except for an additional input node representing the confidence of the ANN output node. Confidence was calculated as c = 2|0.5-o|, where o is the output activation. Figure 1 illustrates the network topology.
After the BN and HBN(Hybrid Bayesian Network) were constructed, they were applied to the test data. The classification method was based on maximum a posteriori (MAP) method which achieves the minimum error rate for all possible classifiers. NETICA (version 3.19; Norsys Software Corp, Vancouver, Canada) was used for Bayesian network construction and performance evaluation.
III. Results
In total, 294,275 records were selected for this study. Records prior to 1988were removed because of the absence of AJCC stage observations. The mean age at diagnosiswas 60.96 years (SD: 14.0). The 'site-specific surgery' variable had 162,500 (55.2%) valid records (131,775 records missing). The 'scope of regional lymph node surgery' variable had 110,204 (37.4%) valid records (184,071 records missing). For the AJCC stage, the number of patients with stage 0 was 53,689 (18.2%), the number of patients with stage I was 11,835 (40.3%), the number of patients with stage IIA was 62,104 (21.1%), the number of patients with stage IIB was 30,854 (10.5%), the number of patients with stage IIIA was 8,819 (3.0%), the number of patients with stage IIIB was 8,026 (2.7%), and the number of patientswith stage IVwas 12,248 (4.2%). The number of primary tumors ranged from1 to 9, butmost was between 1 and 3 (99.6%).
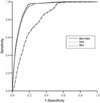
Performance of the proposed models was evaluated for each ten-iteration sequence of the validation process (Table 3). The ANN model achieved the highest prediction accuracy of 88.8% with a sensitivity of 93.7% and a specificity of 85.4%. The hybrid Bayesian network model achieved a prediction accuracy of 87.2% with a sensitivity of 0o=[93.3% and a specificity of 83.1%. Results of the hybrid BN model were very similar to those of the ANN model. However, the BNalonemodel achieved a prediction accuracy of 70.9% with a sensitivity of 88.5% and a specificity of 58.3%. For the AUCs, the hybrid BN model achieved the highest value of 0.935, whereas the corresponding values of ANN and BN were 0.930 and 0.813, respectively (Fig. 2). The hybrid BN model had larger SD in sensitivity, specificity and accuracy than ANN or BN model, however the SD of AUC was not differ significantly.
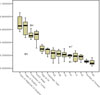
Sensitivity analysis for each input variable was performed in the ANN model formulation (Figure 3). The 'scope of regional lymph node surgery' variable had the highest relative importance (mean 0.685, SD 0.109). It was followed by 'site-specific surgery' (mean 0.606, SD0.166), 'extension of tumor' (mean 0.523, SD 0.070), and 'AJCC stage' (mean 0.506, SD 0.086). The remaining variables had low relative importance (mean 0.299-0.086).
IV. Discussion
We proposed, evaluated, and implemented an ANN, a BN, and a hybrid BN model. The AUC of the BN model was just 0.813. However, the hybrid BN improved to 0.935 and the difference between the AUCs of the hybrid BN and the ANN was slight (0.005). The improved performance of hybrid BN may be due to the ANN itself. However, the primary aim of this study is to give and inspiration of explanation power of BN to ANNmodel, as ANN model is obscure 'black-box' which is not familiar to clinicians. Our evaluation showed that the hybrid BN could provide an explanation of the predictionwhich is the original feature of the BN model, and have a good performance such as the ANN. For these reasons, the hybrid model may better meet the physicians' need to describe the results.
However, the proposed hybrid BN model has some limitations. Both the ANN and hybrid BN models are similar in AUC, therefore the classification power of the hybrid BNmay be largely originated form ANN rather than BN. Therefore, the explain power of the BN may not representative of the nature. There are replication of nodes in both the ANN and BN, which composing the hybrid BN model, therefore there may some waste of computing power. However, the authors designed the model to use the same nodes in both ANN and hybrid BN model. As the same nodes of the ANN are used in the hybridmodel again, it may possible that the posterior probability of the network may represent the status of the decision from the ANN model. It seems that further study to measures the effect of the node from ANN confidence value may be helpful to generalize the porposed hybrid BN model.
We tried to develop a high-performance and easy to understand breast cancer prognosis prediction model that used a small number of clinically meaningful, and easy to get variables. In doing so, nine clinically relevant variables were selected for the proposed models.
This study did not obtain the highest performance in predicting breast cancer survivability.Delen et al. compared three data mining methods: ANN, decision trees, and logistic regression21). They used 202,932 records obtained form the SEER (1973-2000) data set and selected 20 variables (race, marital status, primary site, histology, behavior, grade, extension of disease (includes five subfields), lymph node involvement, radiation, stage of cancer, site specific surgery, age, tumor size, number of positive nodes, number of nodes, number of primaries). Accuracies ofmodelswere high (93.6%, 91.2%, and 89.2%, respectively). However, in the tenfold cross-validation, 90% of the data set was used to train the model and only 10%is used to test themodel. Furthermore, because the data set cleaned fromthe SEER data, variables, and performance measures in Delen's study differ from ours, it is difficult to directly compare the results.
We focused our attention on records having an AJCC stage 3rd edition field. Data records (1973-1987) without the AJCC stage 3rd edition were thus excluded. Given that improvements in breast cancer treatments will continue and new risk factors will be uncovered, it is practical to construct models using the most recent data set.
We also conducted a sensitivity analysis on the ANN model to gain the effects of variables on breast cancer survivability. The 'scope of regional lymph node surgery' variable was the most important, which was followed by 'site-specific surgery,' 'extension of tumor,' and 'AJCC stage'.
Hormone receptor expression is known to be an important prognostic factor of breast cancer. We tried to use estrogen receptor (ER) and progesterone receptor (PR) information as input nodes, but sensitivity analysis revealed that the relative importance of ER and PR were very low (<0.06). Furthermore, pilot evaluation of the model also showed little difference in performance (data not shown). Records containing valid values for ER and PR accounted for 62.7% and 55.8%of the data, respectively. The SEER data set does not contain HER-2/neu information, which is associated with breast cancer prognosis16). In the future, if the SEER data set includes newprognostic factors such as HER-2/neu and enough of the data set is prepared, additional analysis may be necessary.
We combined an ANN model and a Bayesian network model to produce a hybrid Bayesian network model for breast cancer survival prediction. In the experiments, the hybrid model and the ANN model outperformed the Bayesian network model. The hybrid model could provid an explanation of the results through the network topology. Although our approach is not the most accurate in the prediction of breast cancer survivability, we believe that our hybrid method could encourage the development of other useful prediction methods in the medical domain.
(3) Measures of performance
Ten iterations of the random subsampling method were used to construct and estimate the performance of the models. The given data were randomly partitioned into two independent sets, a training set and a test set. In this study, half of the data were allocated to the training set, and the remaining half were allocated to the test set. Each model was constructed using the training set, and the remaining test set was used to evaluate model performance. This validation cycle was repeated 10 times. Results were averaged to produce a single estimation of performance for each model.
Four performance measures were used: accuracy, sensitivity, specificity, and AUC. The accuracy of a classifier on a given test data set was measured as the percentage of test records that were correctly classified by the classifier. This measure showed the overall recognition rate of the classifier. The sensitivity of a classifier served as a statistical measure of how well the classifier correctly identified the positive cases. The specificity of a classifier served as a statistical measure of how well the classifier correctly identified the negative cases. The sensitivity and the specificity were usefulwhen the accuracy of a classifierwas not representative of its true performance. ROC curves are a useful visual tool for comparing different classification models. A ROC curve shows the trade-off between the true positive rate (or sensitivity) and the false positive rate of a model. The vertical axis of a ROC curve represents the true-positive rate, whereas the horizontal axis represents the false-positive rate. To assess the accuracy of a model, we computed the area under the ROC curve of a model, which has values in the interval 0.0≤AUC≤1.0. The closer the AUC is to 1.0, the more accurate the model is.


 XML Download