

 PDF
PDF ePub
ePub Citation
 Print
Print


I. Introduction
With recent advances in information technology and the medical imaging data explosion from radiologic modalities such as X-Ray, Computed Tomography (CT), Magnetic Resonance Imaging (MRI), and ultrasound studies, the Picture archiving and communication systems (PACS) industry has grown rapidly. For example, according the 2005 HIMSS Annual Report of the US Hospital IT Market, approximately one-third of all U.S. hospitals install radiology PACS, and another one-third of hospitals plan to adopt PACS1). Later, the 2007 HIMSS Report shows that the radiology-PACS environment is showing good growth for most modalities, and the market has been and will continue to be impacted through 2009 by increased demand and ongoing market consolidation2).
On the other hand, in South Korea, almost all the large hospitals and university hospitals are operating filmless, and increasing demand from smaller hospitals accelerates more PACS purchase: 47.1% of all healthcare institutions3) and 40% of dental hospitals4) adopt PACS in 2005. Furthermore, governmental support as well as strong healthcare IT initiatives have made South Korea the most flourishing market for PACS.
PACS encompasses a broad range of technologies and consists of four major components at its most fundamental level: (1) image acquisition devices, (2) display workstations, (3) storage systems, and (4) computer network5). Since computers, commonly servers, are dedicated to the storage, retrieval, distribution, and presentation of images, it is not necessary to manually file, retrieve, or transport film jackets. Electronic images and reports are transmitted digitally via PACS, thus the increased portability of digital images and related reports provide a cost efficient and user-friendly environment to patients as well as hospital employees.
Therefore, many healthcare institutions install PACS as an efficient and effective way to reduce the steps in clinical practices and improve their productivity and quality. Although the immediate benefits of changing from a film-based system to the digital PACS might be only the removal of film storage and its related expenses, and decreased times in receiving results and reports, a PACS system provides a broad range of clinical, financial, and operational benefits in the long run.
Despite the rapid spread of PACS and its expected benefits, existing studies rarely present user's attitude or perception to the newly adopted PACS. In particular, the effect of the technical or functional side of the system on users' attitude should be explicitly considered. Therefore, this study explores hardware and software factors affecting users' satisfaction to PACS from the users' perspective, in order to provide solutions for better operations. To fulfill this purpose, this study employed the Technology Acceptance Model (TAM)6-9), and extended the basic model to study key technical features of the PACS system.
Based on the Fishbein and Ajzen's Theory of Reasoned Action (TRA) explaining the pattern of voluntary usage at an individual level10)11), TAM includes 'Perceived Usefulness (PU)' and 'Perceived Ease-Of-Use (PEOU)' in the model: PU is defined as 'the degree to which a person believes that using a particular system would enhance his or her job performance,' while PEOU is defined as 'the degree to which a person believes that using a particular system would be free of effort'6). PU and PEOU create belief among users and subsequently form their attitude.
In addition, users' attitude and perception may be affected by exogenous variables such as system features and characteristics7)11). In this regard, Davis stated that the future research should consider the role of external factors in TAM. He also asserted that identifying exogenous variables in TAM can increase explanatory power7)11). Along this line, there has been a wide variety of exogenous variables tried in existing studies. However, few studies employ technical features or functional attributes of information systems as exogenous variables since those factors vary with specific infor mation technology and information systems. We believe that in some specific cases (as in our research subject, PACS), system-specific functional elements like hardware and software components of the system should to be considered.
As a summary, this paper intended to describe users' satisfaction to PACS, employing two concepts of Perceived Ease-of-Use (PEOU) and Perceived Usefulness (PU) based on the Technology Acceptance Model (TAM). Moreover, the extended TAM model includes technical key features of the PACS system as exogenous variables to increase explanatory power. Through this process, we expect to identify the most significant technical features of the PACS system for continued growth and user satisfaction.
II. Materials and Methods
1. Research model
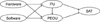
The research model is developed to derive the exogenous variables affecting user satisfaction of the PACS system, based on the extended version of Davis' TAM. Throughout this model, we expect to comprehensively understand the key technical features of the PACS system, which play an important role in user satisfaction. As shown in Figure 1, the research model assumes that exogenous variables satisfy PACS users only through the intermediary variables like PEOU and PU. Under this fundamental assumption of TAM, we examine which paths are more critical for user satisfaction. For example, users may get to use PACS only through PU, while some exogenous variables affect not only PU, but also PEOU. As for the exogenous factors, five hardware and four software components of the PACS system are considered.
According to the basic model, the hypotheses are classified into two groups: (1) hypotheses for the relations between the exogenous variables and the TAM variables and (2) hypotheses for the relations between the TAM variables as in the original TAM framework. Explicitly, exogenous factors including hardware and software components will positively affect both PU and PEOU. And PEOU will positively affect PU, and enhanced PU and PEOU will increase user satisfaction.
2. Subject
A cross-sectional survey was conducted to dentists in 25 dental hospitals during May 25 through June 4, 2007 in South Korea. The 25 hospitals were selected from the national hospital registry with 132 dental hospitals using the cluster sampling method. The target sample size was 250; an average of 10 responses per hospital. Out of the 250 dentists who received the survey questionnaire, 204 participated in the survey, repre senting 81.6% of response rate. Excluding the non-users of PACS, the responses of 159 were used in the final analyses.
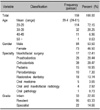
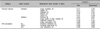
Table 1 summarizes the demographic characteristics of the 159 respondents, of which both males and females were almost equally represented. Broken down into age groups, respondents in their 20s formed the largest group (72.2%), and those aged 30-39 account for 20.3%, and above 40 for 7.6%. Broken down by specialty area, orthodontists account for 28.5%, prosthodontics for 20.4%, restorative dentistry for 13.1%, and maxillofacial surgery for 12.4%, while pediatric, periodontology, oral medicine, etc. represent the remaining proportion. By professional grade, residents account for 63.3%, interns account for 22.0%, and specialists account for only 14.7%.
3. Instrument
The survey included a broad spectrum of measurement items on users' experience of the PACS system. The survey was accompanied by a cover letter describing the study purpose and assuring the anonymity and privacy of the respondents. The questions are categorized into three groups: (1) questions on functional elements of technical features in the PACS system, (2) questions to assess PEOU, PU, and the level of satisfaction with using the system, and (3) demographic questions. Answers to these questions are marked on a seven-point Likert scale (1: strongly disagree, 7: strongly agree) to represent the degree of perception or satisfaction. More explicitly, question items for the exogenous variables in the extended TAM include 27 measurement items for five hardware components and 32 items for four software components. PEOU and PU are measured by five items each, and the user satisfaction is measured by four items.
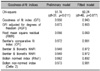
The reliability tests for the scales were performed using Cronbach alpha coefficients, which measure internal consistency over measurement items of the scale. Cronhach's alpha value of 0.7 or above is deemed to be reliable by convention. As shown in Table 2, the alpha coefficients for the hardware components ranged from 0.74 to 0.87, and those for the software components ranged from 0.77 to 0.91. The alpha coefficients for PEOU, PU, and satisfaction were 0.91, 0.92, and 0.91, respectively, which confirms the scales reliable.
4. Data analysis methods
We analyzed the data using the two-step approach of the structural equation model suggested by Anderson and Gerbing (1988)12). A structural equation model consists of two models: a measurement model and a structural model. While the measurement model shows the relations between measurement variables and latent factors, the structural model presents the relations among latent factors. For the two models, confirmatory factor analyses were applied to check the validity of the measurement model, and then the structural equation modeling methods were followed to see the statistical significance of the various relations among latent factors and also between latent factors and measurement variables in the overall model.
In particular, we test a preliminary structural equation model specifying all the relationships among the conceptual factors and examine the significance of each relationship. Then we try to modify the preliminary model so that we can determine the best fit model in terms of statistical significance in parameter estimation. Both confirmatory factor analysis and structural equation analysis are carried out using PROC CALIS to estimate model parameters and test the goodness-of-fit of the model. All statistical analyses were conducted using the SAS statistical package (Version 9.1).
Satisfactory fit statistics are also provided and compared with ones in the preliminary model. The overall fit of the structural models is assessed in terms of the following six goodness-of-fit indices: degree of freedom, Goodness of Fit Index (GFI), Root Mean-square Residual (RMR), Bentler's Comparative Fit Index (CFI), Bentler & Bonett's Non-Normalized Fit Index (NNFI), and Bentler & Bonett's Normalized Fit Index (NFI). The significance of these statistics is tested based on the Chi-square distribution with an appropriate degree of freedom. For other indices, the recommended thresholds of 'good-fit' are as follows: greater than or equal to 0.85 for GFI, CFI, NNFI, and NFI; less than or equal to 0.05 for RMR.
III. Results
1. Preliminary structural equation model
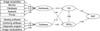
Figure 2 shows the test results from the structural equation analysis of the preliminary model, which tests hypotheses on the relations between the PACS technical components and the TAM perception variables (PEOU and PU) and the relations between the perception variables and user satisfaction. On the figure, the numbers beside the arrow lines are the corresponding path coefficients, representing the effect size of the path between two variables or factors. After testing goodness-of-fit of a model to data, the model is interpreted using significant path coefficients in the model.
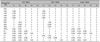
The preliminary model was valid because all the indices were within the acceptable ranges recommended in most literature, as shown in Table 3. Explicitly, Chisquare statistic was 51.76 with p value of 0.01, Goodness of Fit Index (GFI) was 0.895, Root Mean Square Residual (RMR) was 0.056, and Comparative Fit Index (CFI) was 0.972, etc.
Although the model fit was acceptable, many relations in the model turned out to be insignificant at the significance level of 0.05, which were depicted in dotted lines in Figure 2. Insignificant paths imply that some hypotheses are rejected. In particular, all the paths in the measurement model were significant, but no paths for the relations between the technical component variables and the two TAM variables were significant, resulting in the hypotheses in the first hypothesis group being rejected. Regarding the second group of hypotheses for the relations between the TAM variables and user satisfaction, no significant relation between PEOU and user satisfaction was observed, and PEOU indirectly influenced user satisfaction through PU as an intermediary variable. Subsequently, one critical path, PEOU → PU → user satisfaction, is derived.
2. Fitted structural equation model
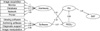
From the preliminary structural equation model, variations of the model were tested by dropping the most insignificant path step by step, in order to determine the best fitted model. The fitted structural equation model was considered in terms of statistical performance, which includes good model fit and all significant paths. Figure 3 represents a revised model without dotted lines, and the goodness-of-fit of the model is compared to that of the preliminary model in Table 3. Despite both preliminary and fitted models showed good fit, the fitted model performed even better than the preliminary model in most indices.
The model outcomes were also different in significance of paths. In particular, the first hypothesis group, testing the relations between the technical component variables and the two TAM variables, became significant in the fitted model. Therefore, the model included three more paths of hardware to PEOU, software to PEOU and also PU. Accordingly, the fitted model provided more critical paths to user satisfaction, which include routes utilizing PEOU and PU as media connecting exogenous factors with user satisfaction: hardware → PEOU → PU → SAT, software → PU → SAT, and software → PEOU → PU → SAT. However, the hypothesis regarding the direct effect of PEOU on user satisfaction was still not accepted in the fitted model.
IV. Discussion
TAM has been successfully used in many studies to explain acceptance and use of information systems. Although various research activities have been conducted around TAM, it has been rarely employed in health-related research areas. Especially, only few studies are found in Medical Informatics13-17). In particular, this study tried to describe users' satisfaction to PACS, employing technical components of PACS and two TAM perception variables.
Using the extended TAM and a series of multivariate statistical analyses, this study could generate the following results. Hardware and software components as exogenous variables were found to have significant effects on PU and PEOU, directly or indirectly. Among the original TAM variables, only PU had a significant effect on user satisfaction. Even though PEOU was found not to have a significant effect on user satisfaction, it turned out to have an indirect effect on user satisfaction through PU.
The result that the hypothesis regarding the direct effect of PEOU on user satisfaction fails to be accepted seems to be somehow contrary to typical outcomes from TAM studies. This dissimilarity may be from the unique nature of each information system. Contrary to the commercial information systems, information system in healthcare industry might be recognized as a service instrument. Subsequently, PACS users put much more stress on usefulness rather than convenience of use. This interpretation about the PEOU → PU → SAT path was also supported by the previous TAM research on health information websites13).
The above assertion also seems to be substantiated by statistical interpretation. For example, in the fitted model (Fig. 3), the total effects of PEOU and PU on user satisfaction are measured at 0.610 and 1.051, respectively (Table 4). While the effect of PEOU on user satisfaction is indirect only, the effect of PU is direct.
As a summary, this study viewed dentists as users of a special type of information system (that is, PACS in dental hospitals) and analyzed the interrelationships among the exogenous variables, users' perception of PACS use, and users' satisfaction to the system. An extended TAM was constructed because key functional characteristics of PACS were expected to have a close connection to perceived variables such as PU and PEOU. We also verified how significant the extended TAM model is in explaining user satisfaction on the PACS. As PEOU has a strong effect on PU, careful consideration should also be given to developing systematic ways of improving information quality and system design performance that turn out to have an overall influence upon user satisfaction. Furthermore, this study helped increasing the explanatory power of TAM and show how the impacts of the system characteristics on the pattern of technology acceptance vary with service application areas.
 XML Download