Abstract
Objective:
The heartbeat classification of the electrocardiogram is important in cardiac disease diagnosis. For detecting QRS complex, conventional detection algorithm have been designed to detect P, QRS, T wave, first. However, the detection of the P and T wave is difficult because their amplitudes are relatively low, and occasionally they are included in noise. Furthermore the conventional multiclass classification method may have skewed results to the majority class, because of unbalanced data distribution. Methods: The Hermite model of the higher order statistics is good characterization methods for recognizing morphological QRS complex. We applied three morphological feature extraction methods for detecting QRS complex: higher-order statistics, Hermite basis functions and Hermite model of the higher order statistics. Hierarchical scheme tackle the unbalanced data distribution problem. We also employed a hierarchical classification method using support vector machines.
Results:
We compared classification methods with feature extraction methods. As a result, our mean values of sensitivity for hierarchical classification method (75.47%, 76.16% and 81.21%) give better performance than the conventional multiclass classification method (46.16%). In addition, the Hermite model of the higher order statistics gave the best results compared to the higher order statistics and the Hermite basis functions in the hierarchical classification method.
Go to : 
REFERENCES
1. Hu YH, Palreddy S, Tompkins W. A patient adaptable ECG beat classifier using a mixture of experts approach. IEEE Trans Biomed Eng. 2007; 44:891–900.
2. Chazal P, O’Dwyer M, Reilly R. Automatic Classification of Heartbeats Using ECG Morphology and Heartbeat Interval Features. IEEE Trans Biomed Eng. 2004; 51:1196–1206.
3. Osowski S, Hoai LT, arkiewicz T. Support vector machine-based expert system for reliable heartbeat recognition. IEEE Trans Biomed Eng. 2004; 51:582–89.

4. Nikias C, Petropulu A. Higher Order Spectral Analysis. Prentice-Hall;1993.
5. Lagerholm M, Peterson C, Braccini G, Edenbrandt L, Sornmo L. Clustering ECG complexes using Hermite functions and self-organizing maps. IEEE Trans Biomed Eng. 2000; 47:838–47.

6. Vapnik V. Statistical Learning Theory. Wiley;1998.
7. Kreel U. Advances in Kernel Methods: Support Vector Learnings. MIT Press;1999. p. 255–68.
8. Casasent D, Wang YC. A hierarchical classifier using new support vector machines for automatic target recognition. Neural networks. 2005; 18:541–48.

9. Elkan C. The foundation of cost-sensitive learning. Proceeding of the 17th International Joint Conference on Artificial Intelligence. 2001; Aug 4-10; Seattle, USA.
10. Yang H, Carlin D. ROC surface: a generalization of ROC curve analysis. Journal of biopharmaceutical statistics. 2000; 10:183–96.

11. Mark R Mody G. MIT-BIH Arrhythmia Database. 1997. Online available at. http://www.physionet.org/. Accessed November 11, 2014.
12. American National Standard. Testing and reporting performance results of cardiac. ANSI/AAMI EC57 : 1998/(R)2003.
13. Sansone G. Orthogonal Functions. Dover;1991.
14. Golub G, Van Loan C. Matrix Computations. Johns Hopkins University;1991.
15. Kim Y, Kang S, Park I, Noh G. Population Pharmacokinetic and Pharmacodynamic Models of Propofol in Healthy Volunteers using NONMEM and Machine Learning Methods. Journal of Korean Society of Medical Informatics. 2008; 14(Suppl 2):147–159.

16. Cho B, Lee J, Chee Y, Kim K, Kim I, Kim S. Prediction of Diabetic Nephropathy from Diabetes Database Using Feature Selection Methods and SVM Learning. Korea Society of Medical & Biological Eng. 2007; 28:255–62.
17. Lin HT, Lin CJ, Weng RC. A note on Platt’s probabilistic outputs for support vector machines. Taiwan Univ.;2003.
Go to : 
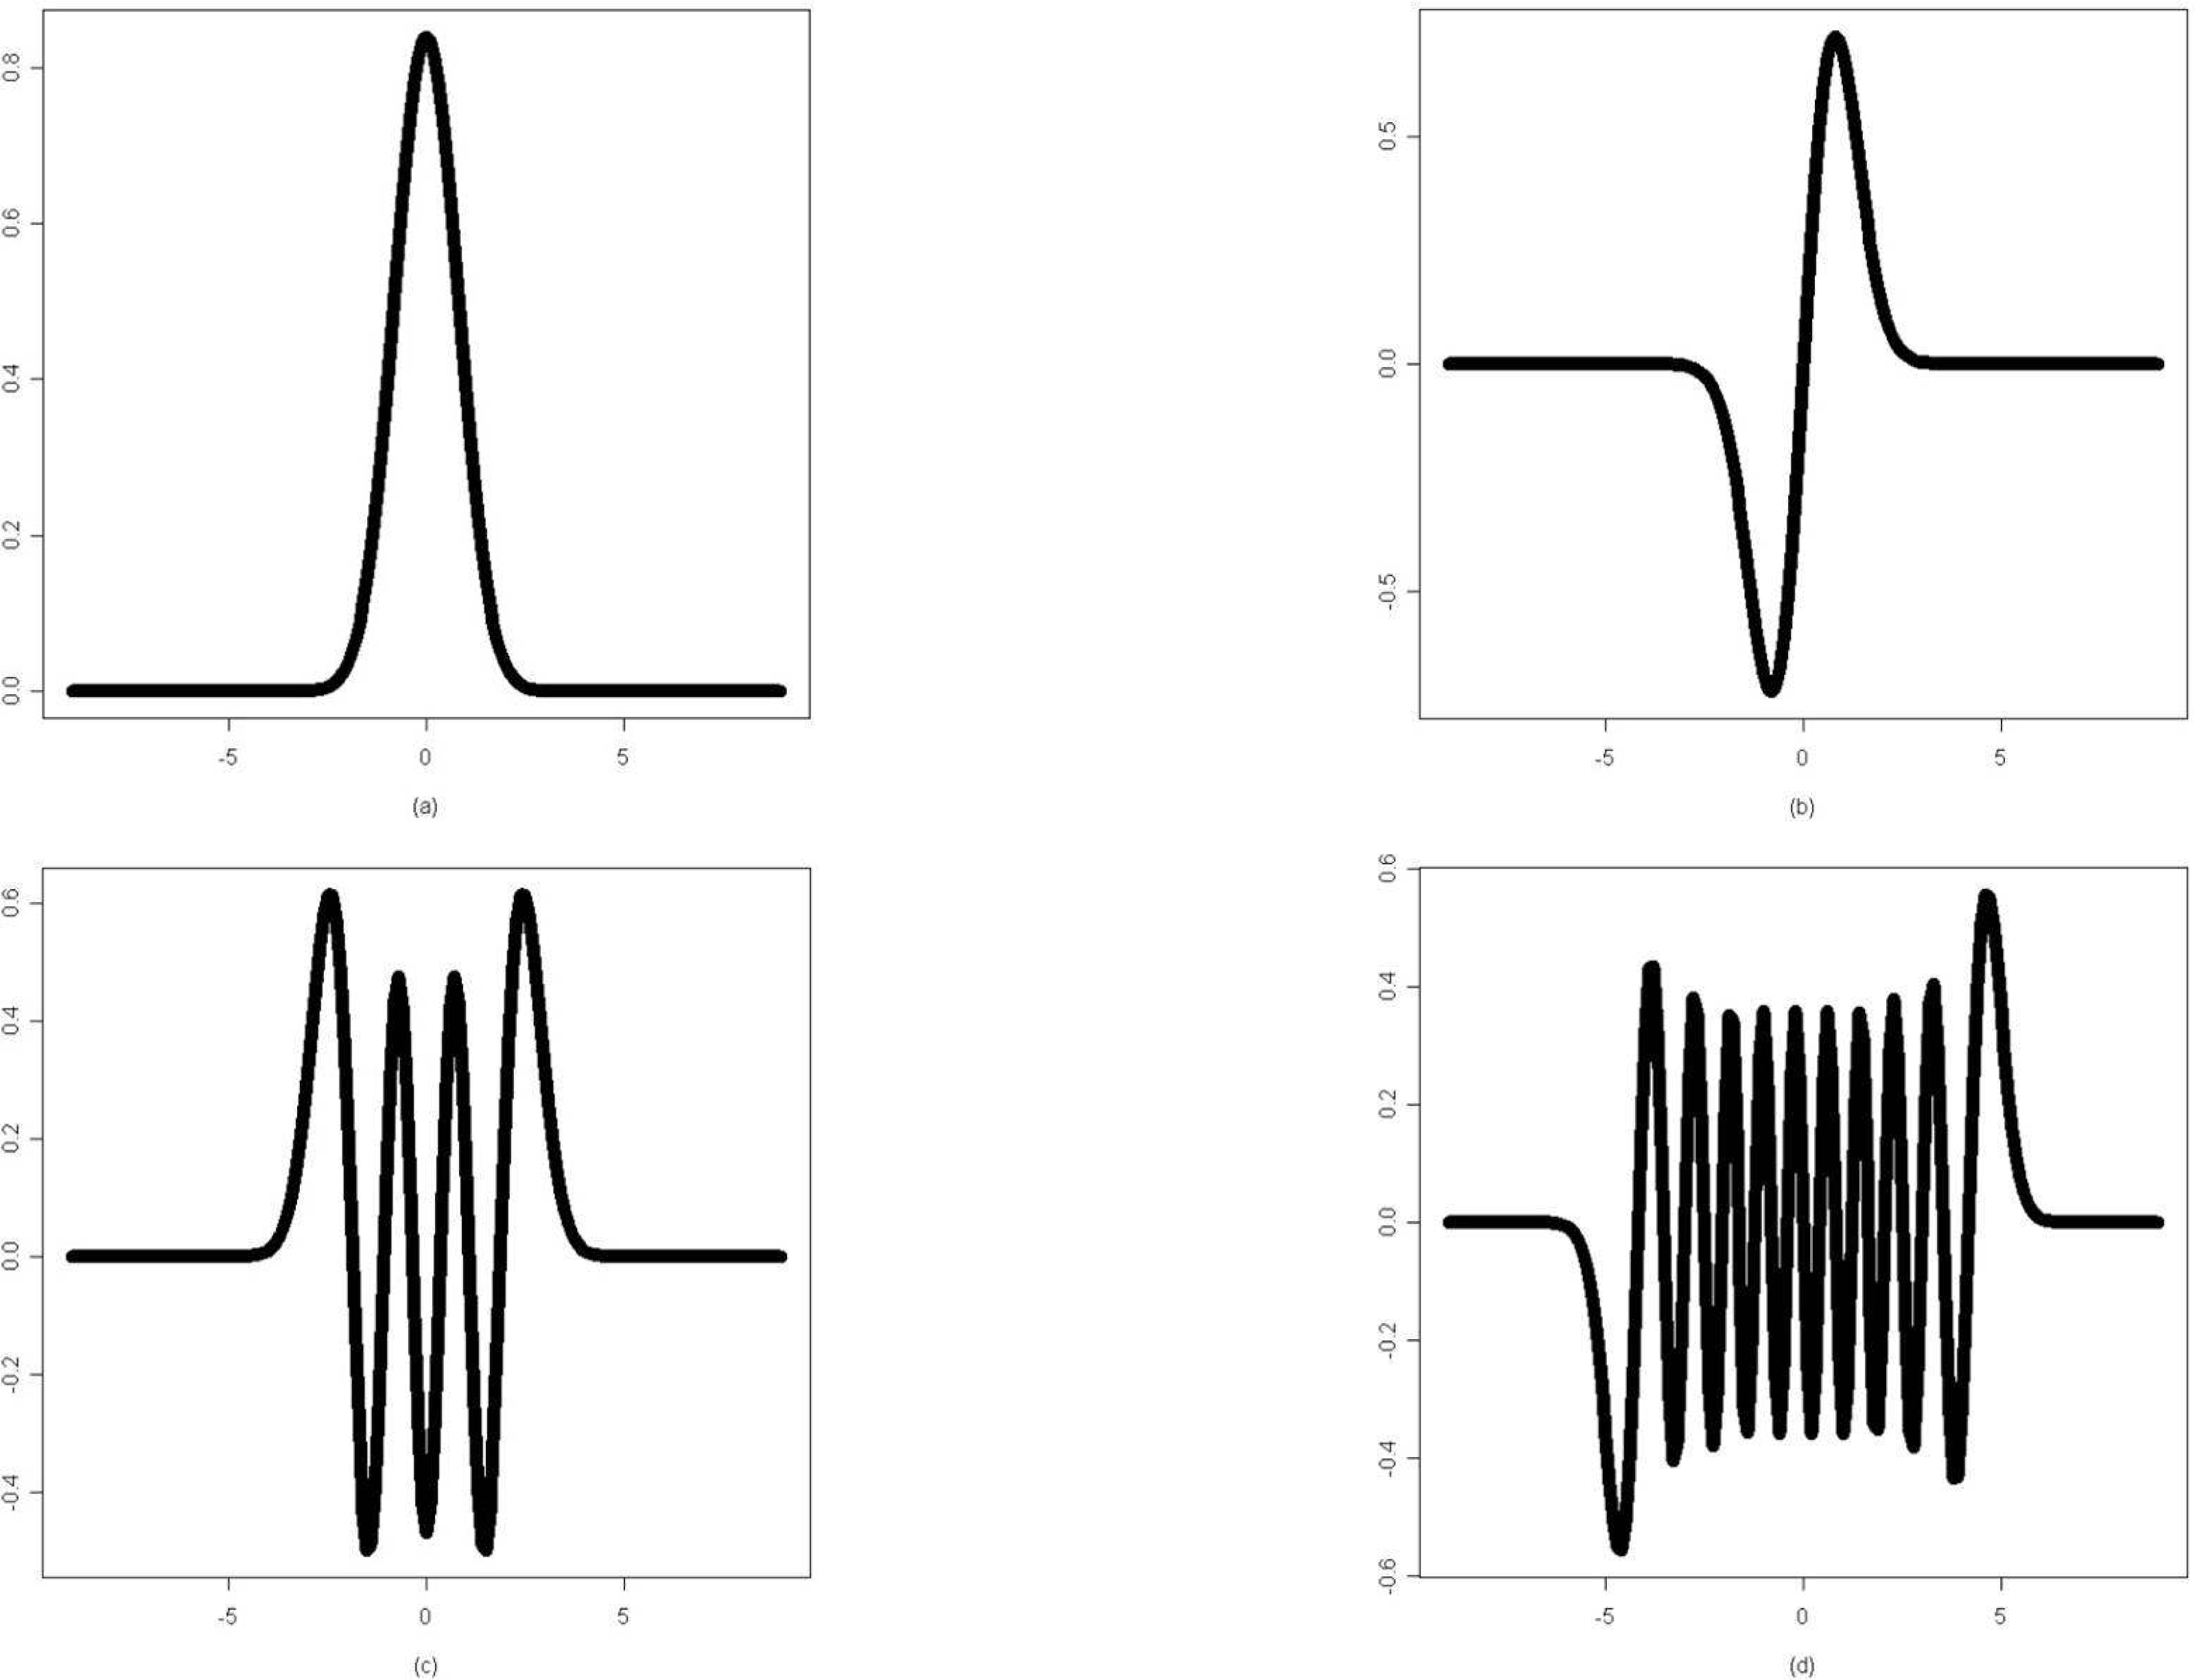
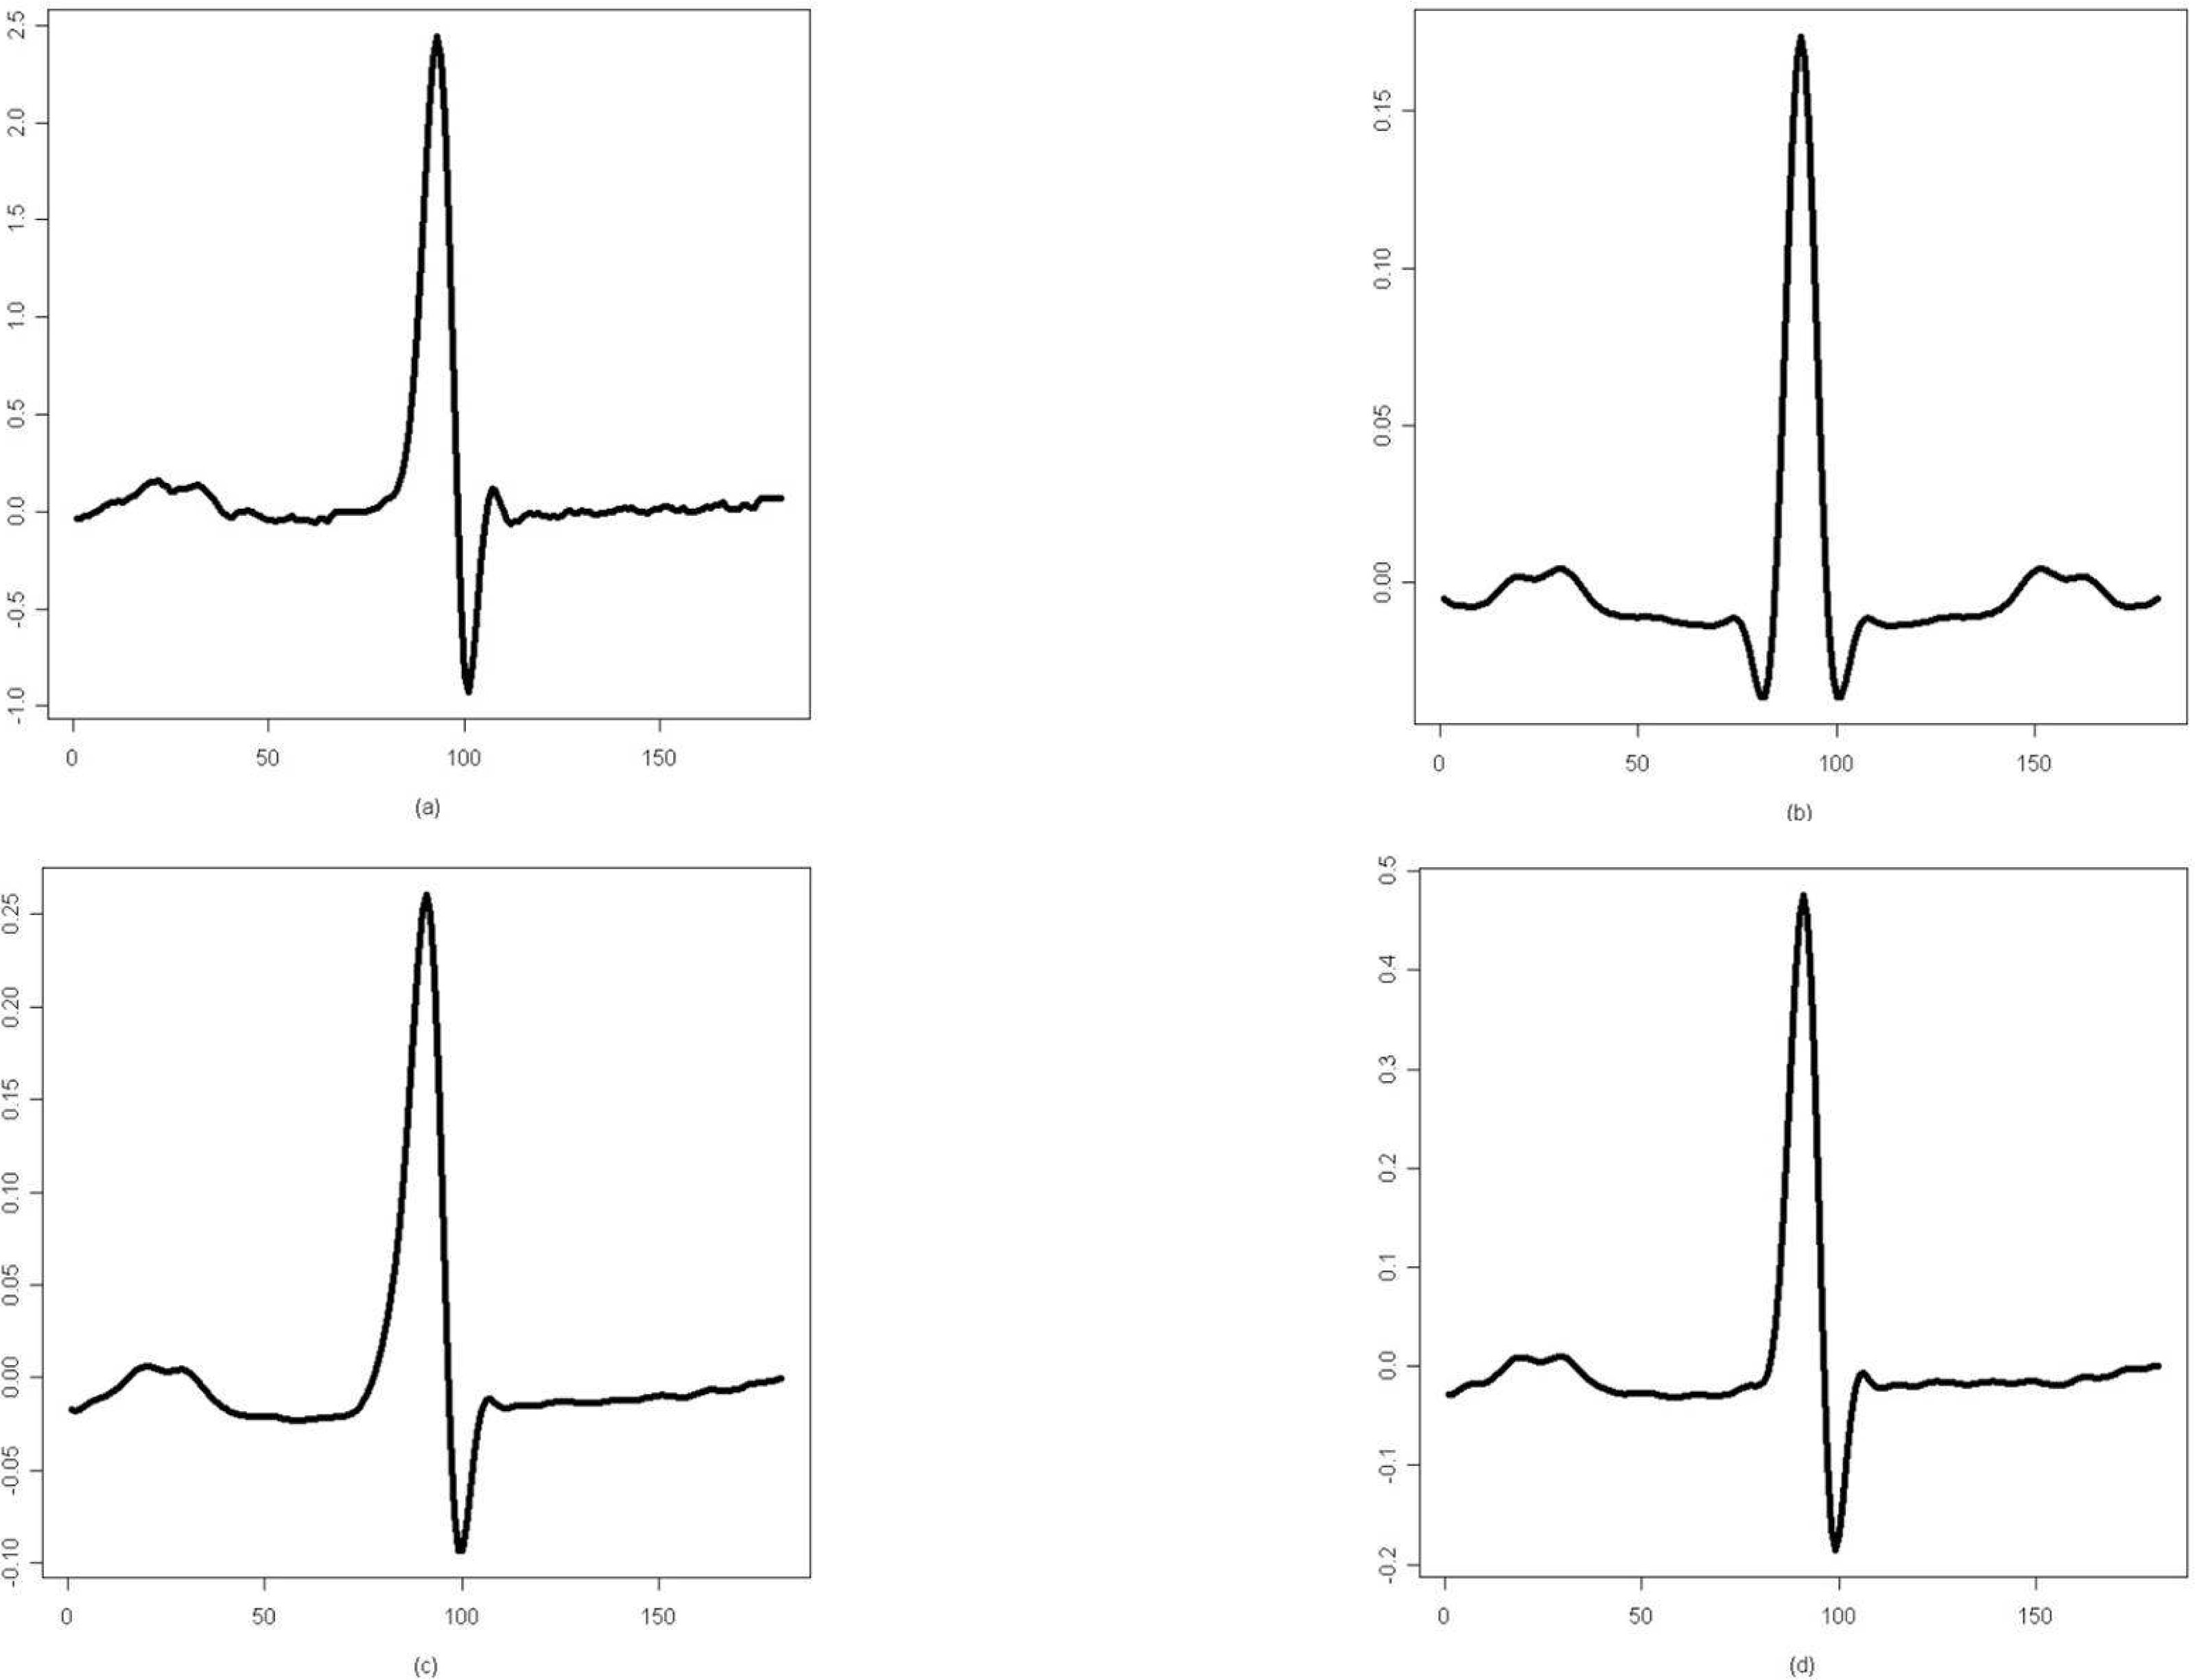 | Figure 2.(a) The N class waveform of ECG beat and its cumulant representations of the (b) second, (c) third, and (d) fourth order |
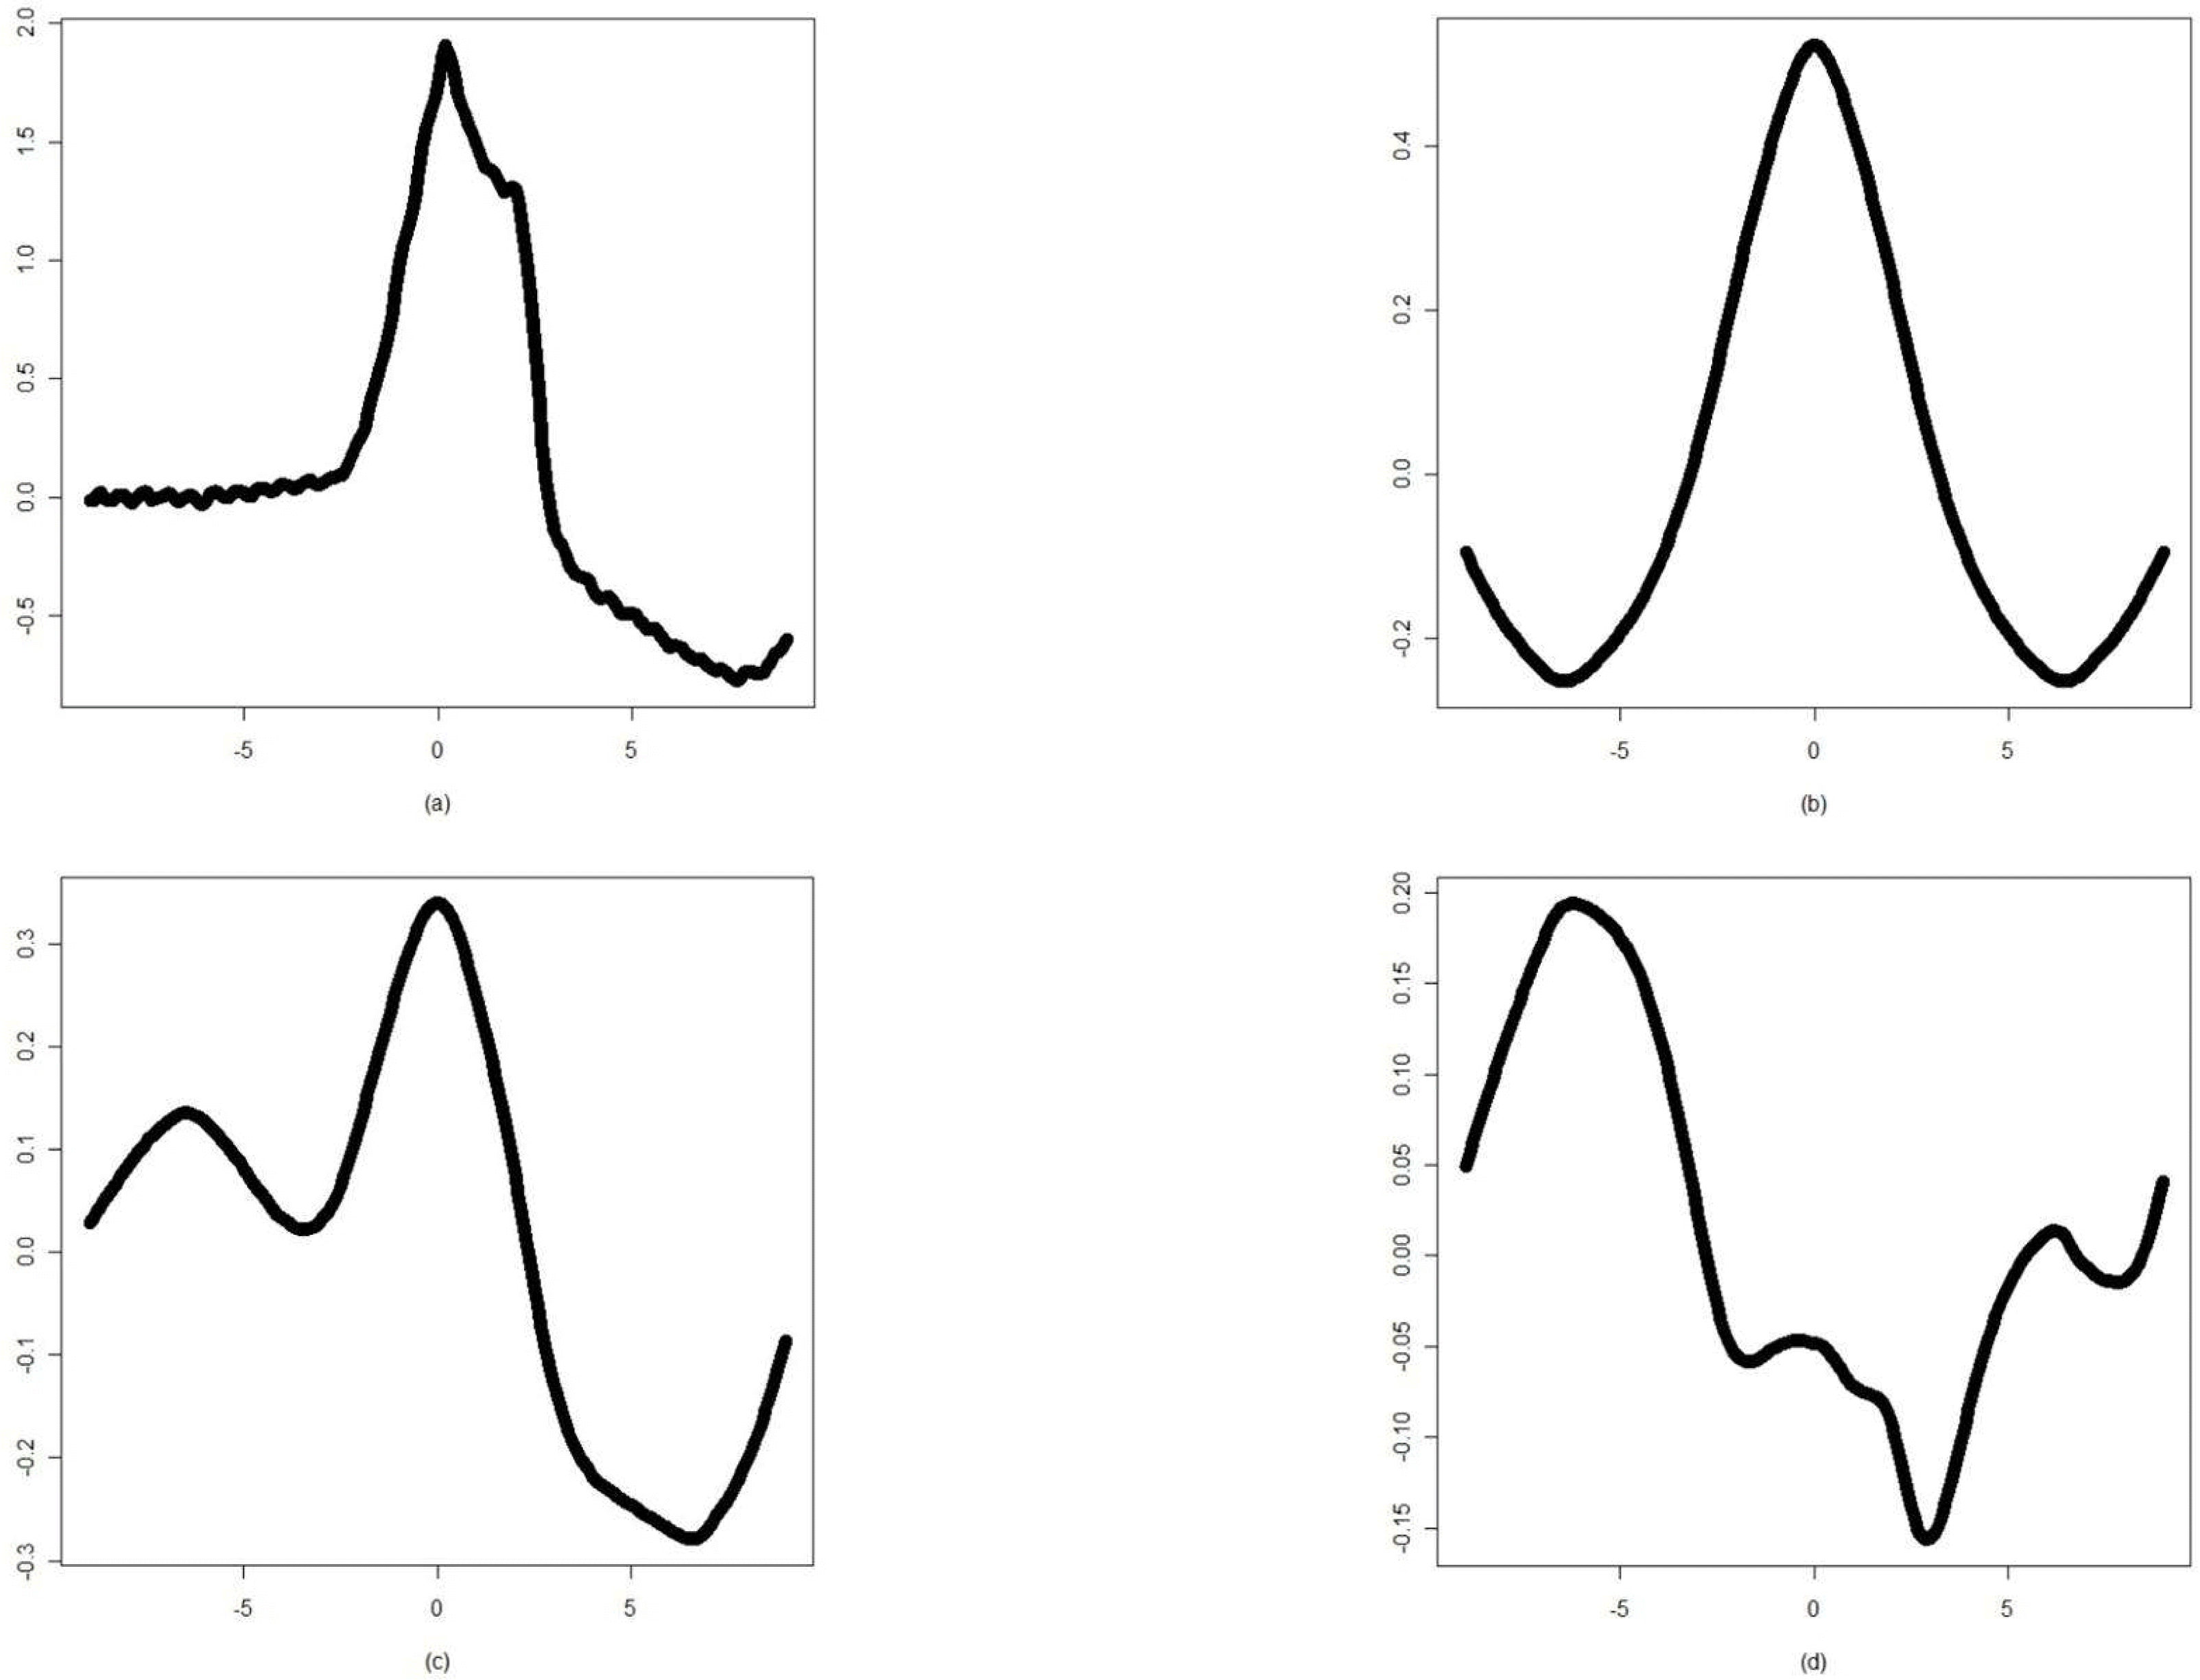 | Figure 3.(a) The V class waveform of ECG beat and its cumulant representations of the (b) second, (c) third, and (d) fourth order |
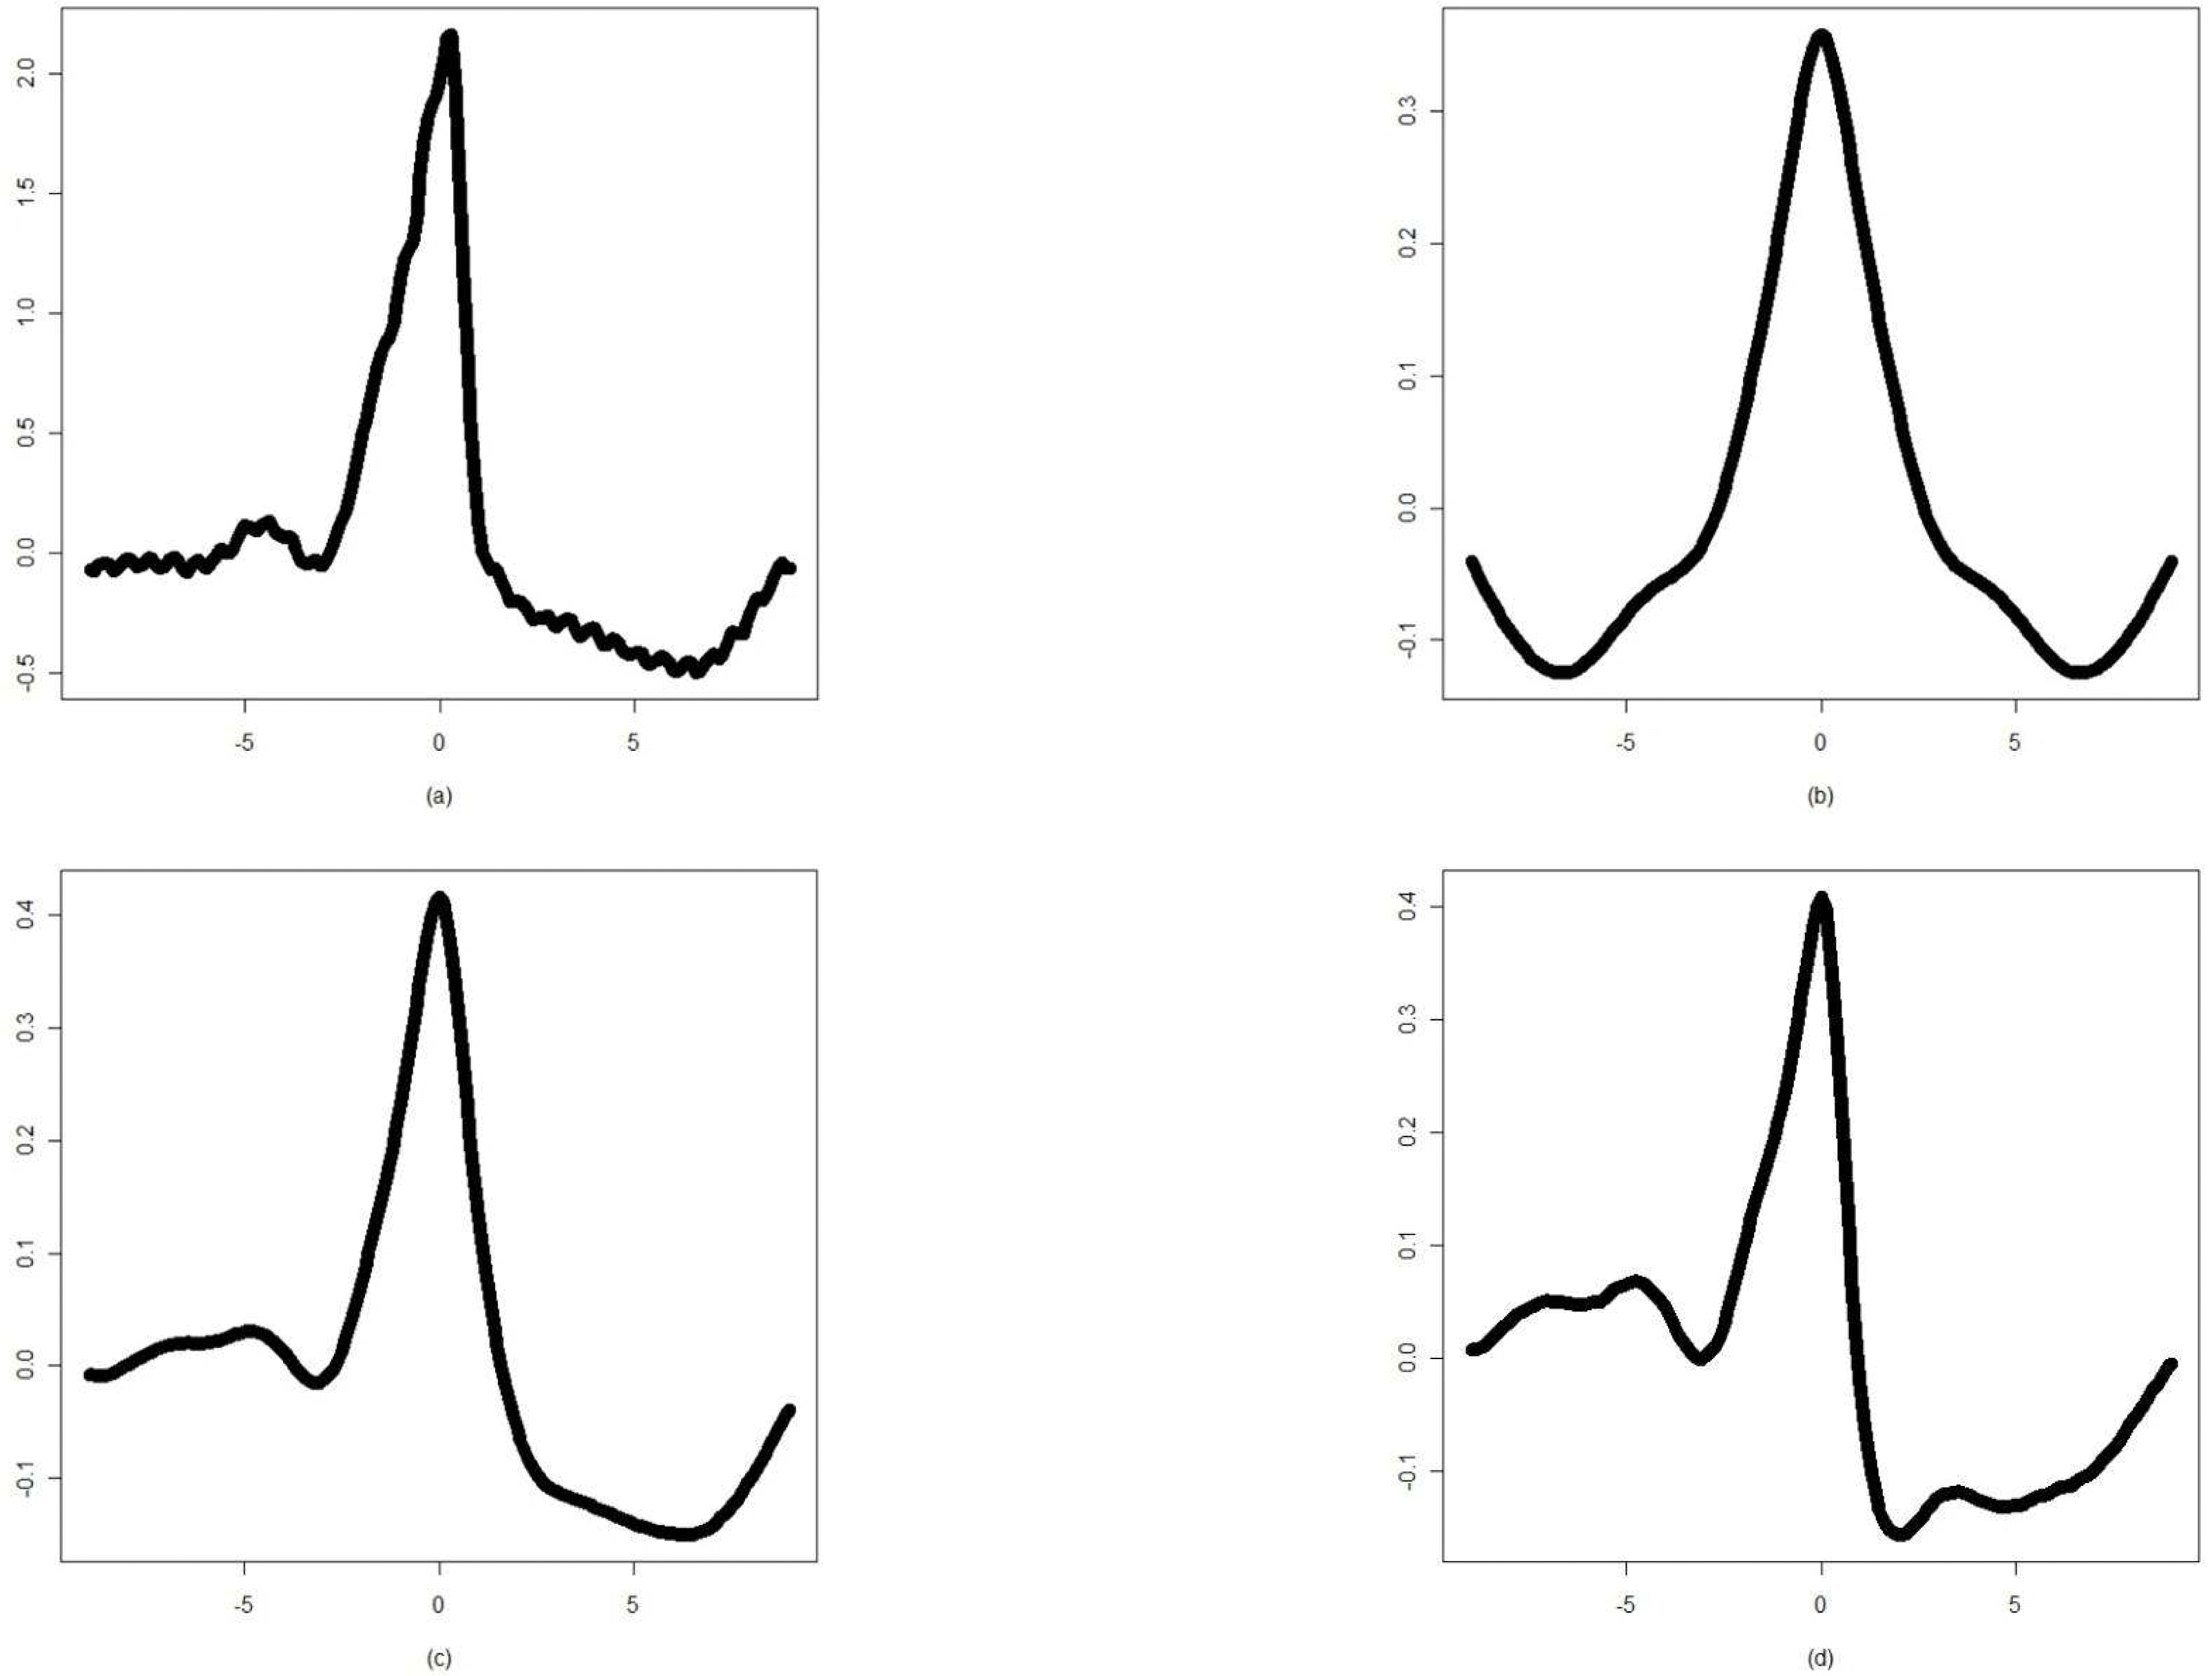 | Figure 4.(a) The F class waveform of ECG beat and its cumulant representations of the (b) second, (c) third, and (d) fourth order |
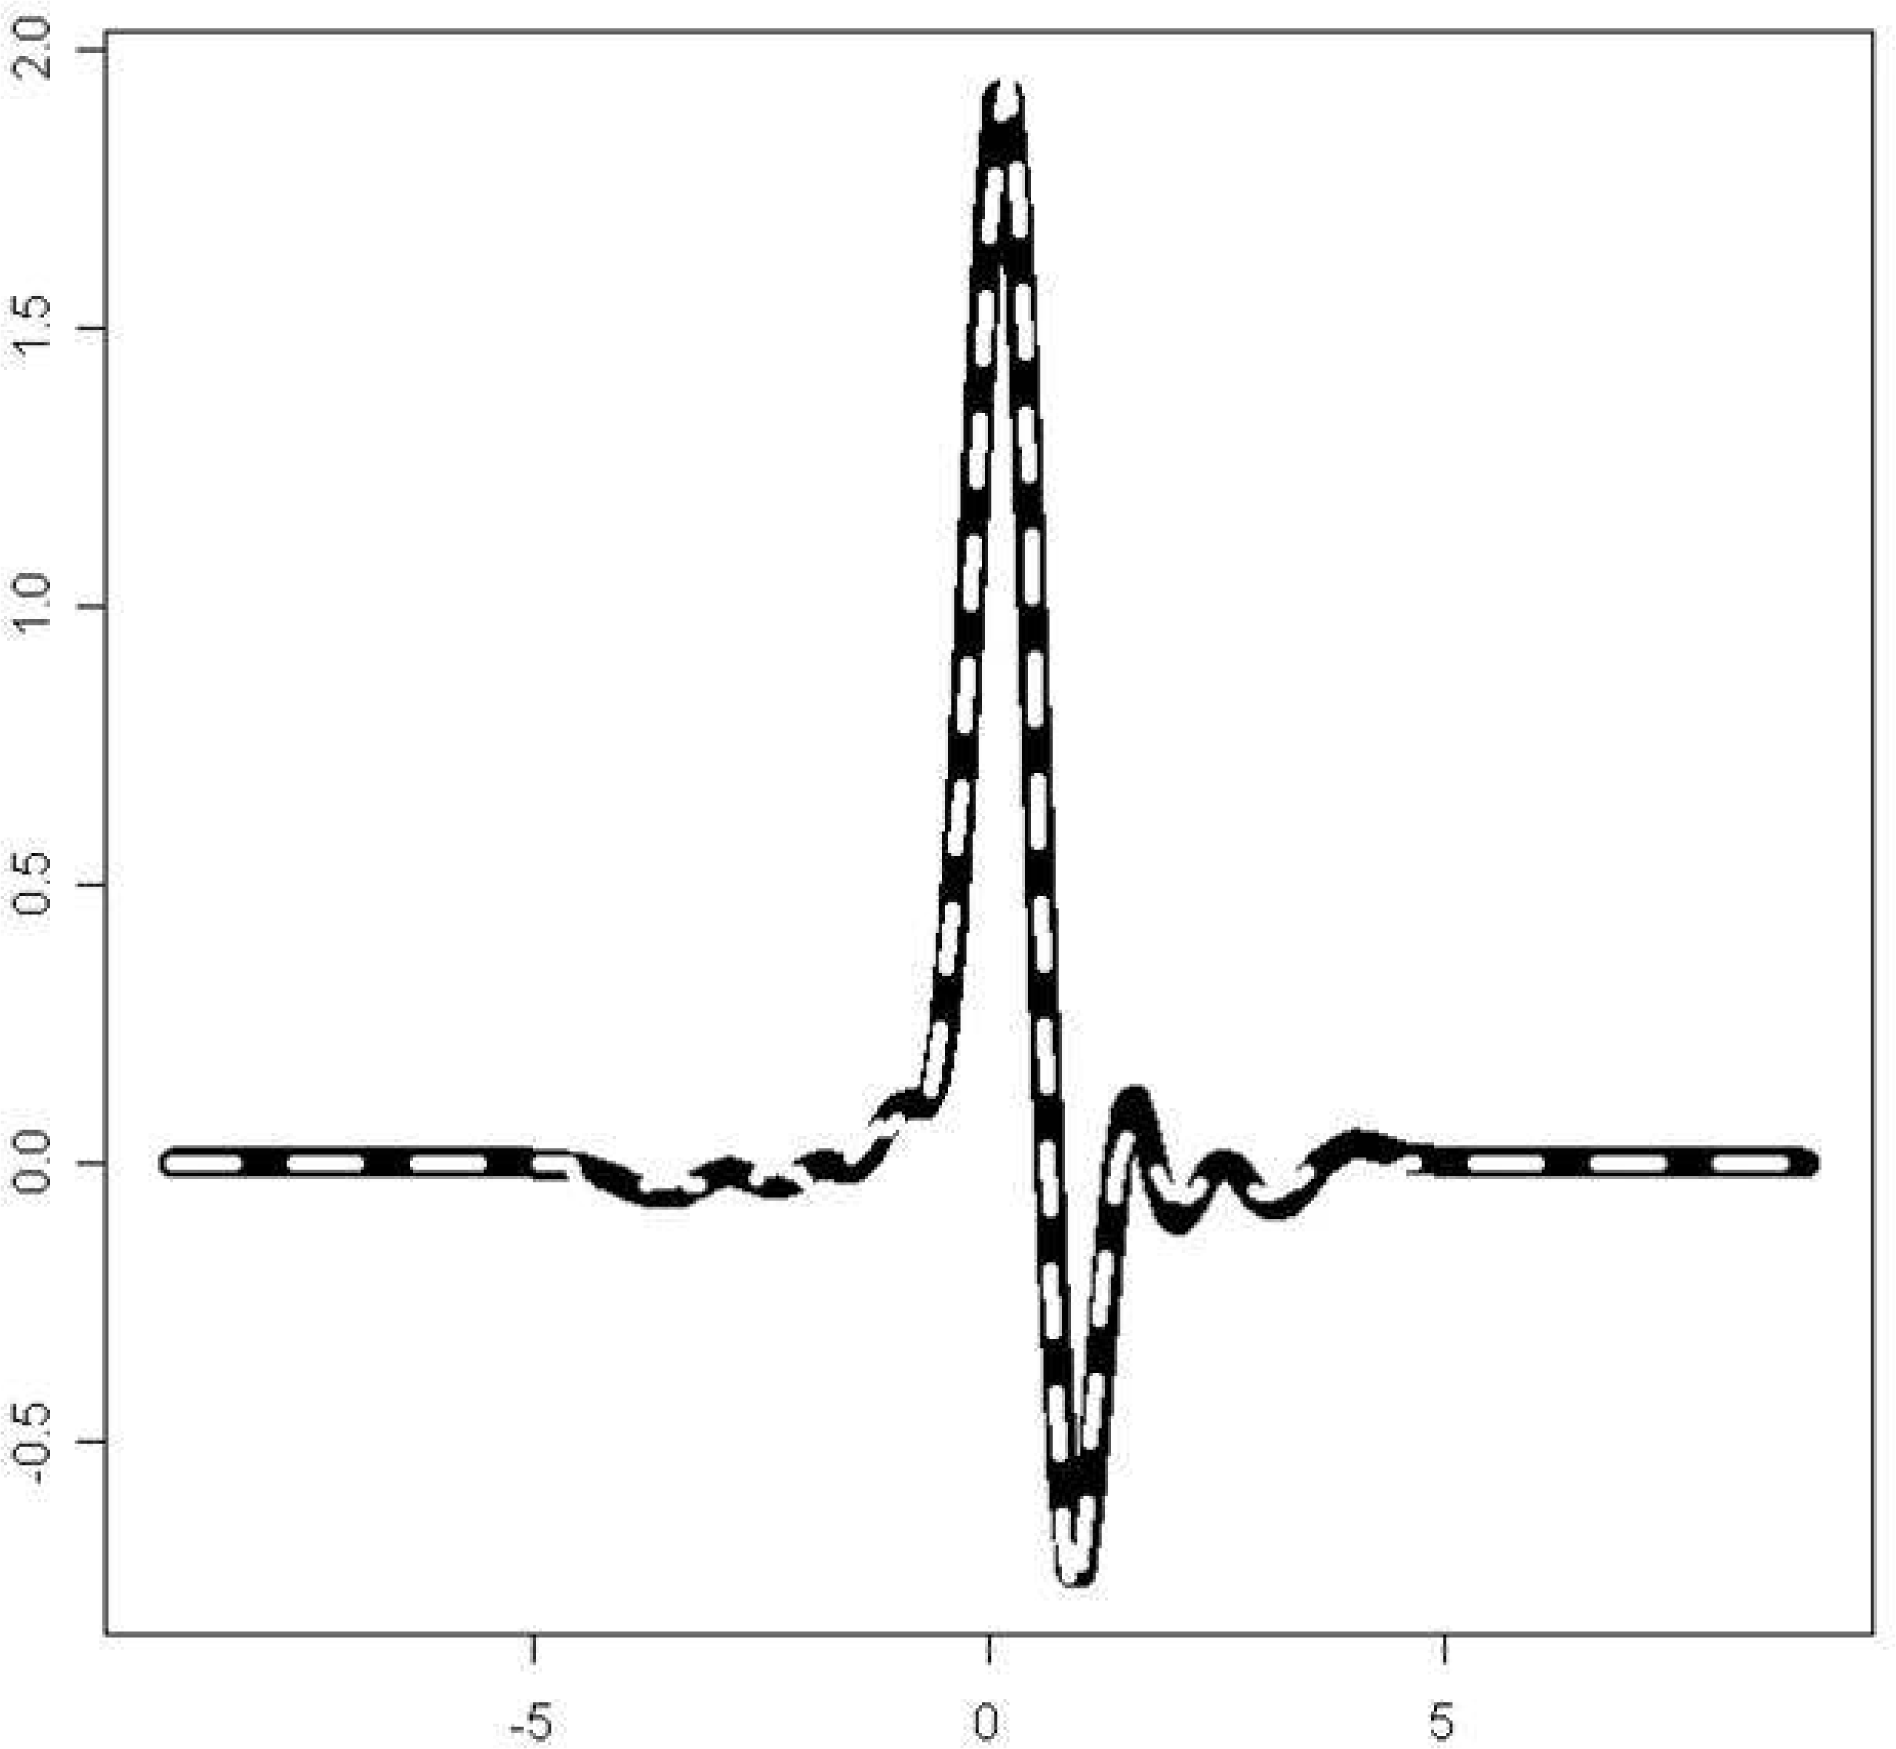 | Figure 6.The normal QRS complex of an ECG beat (black solid line) and its estimation using a Hermite polynomial of the 20th order(white dashed line) |
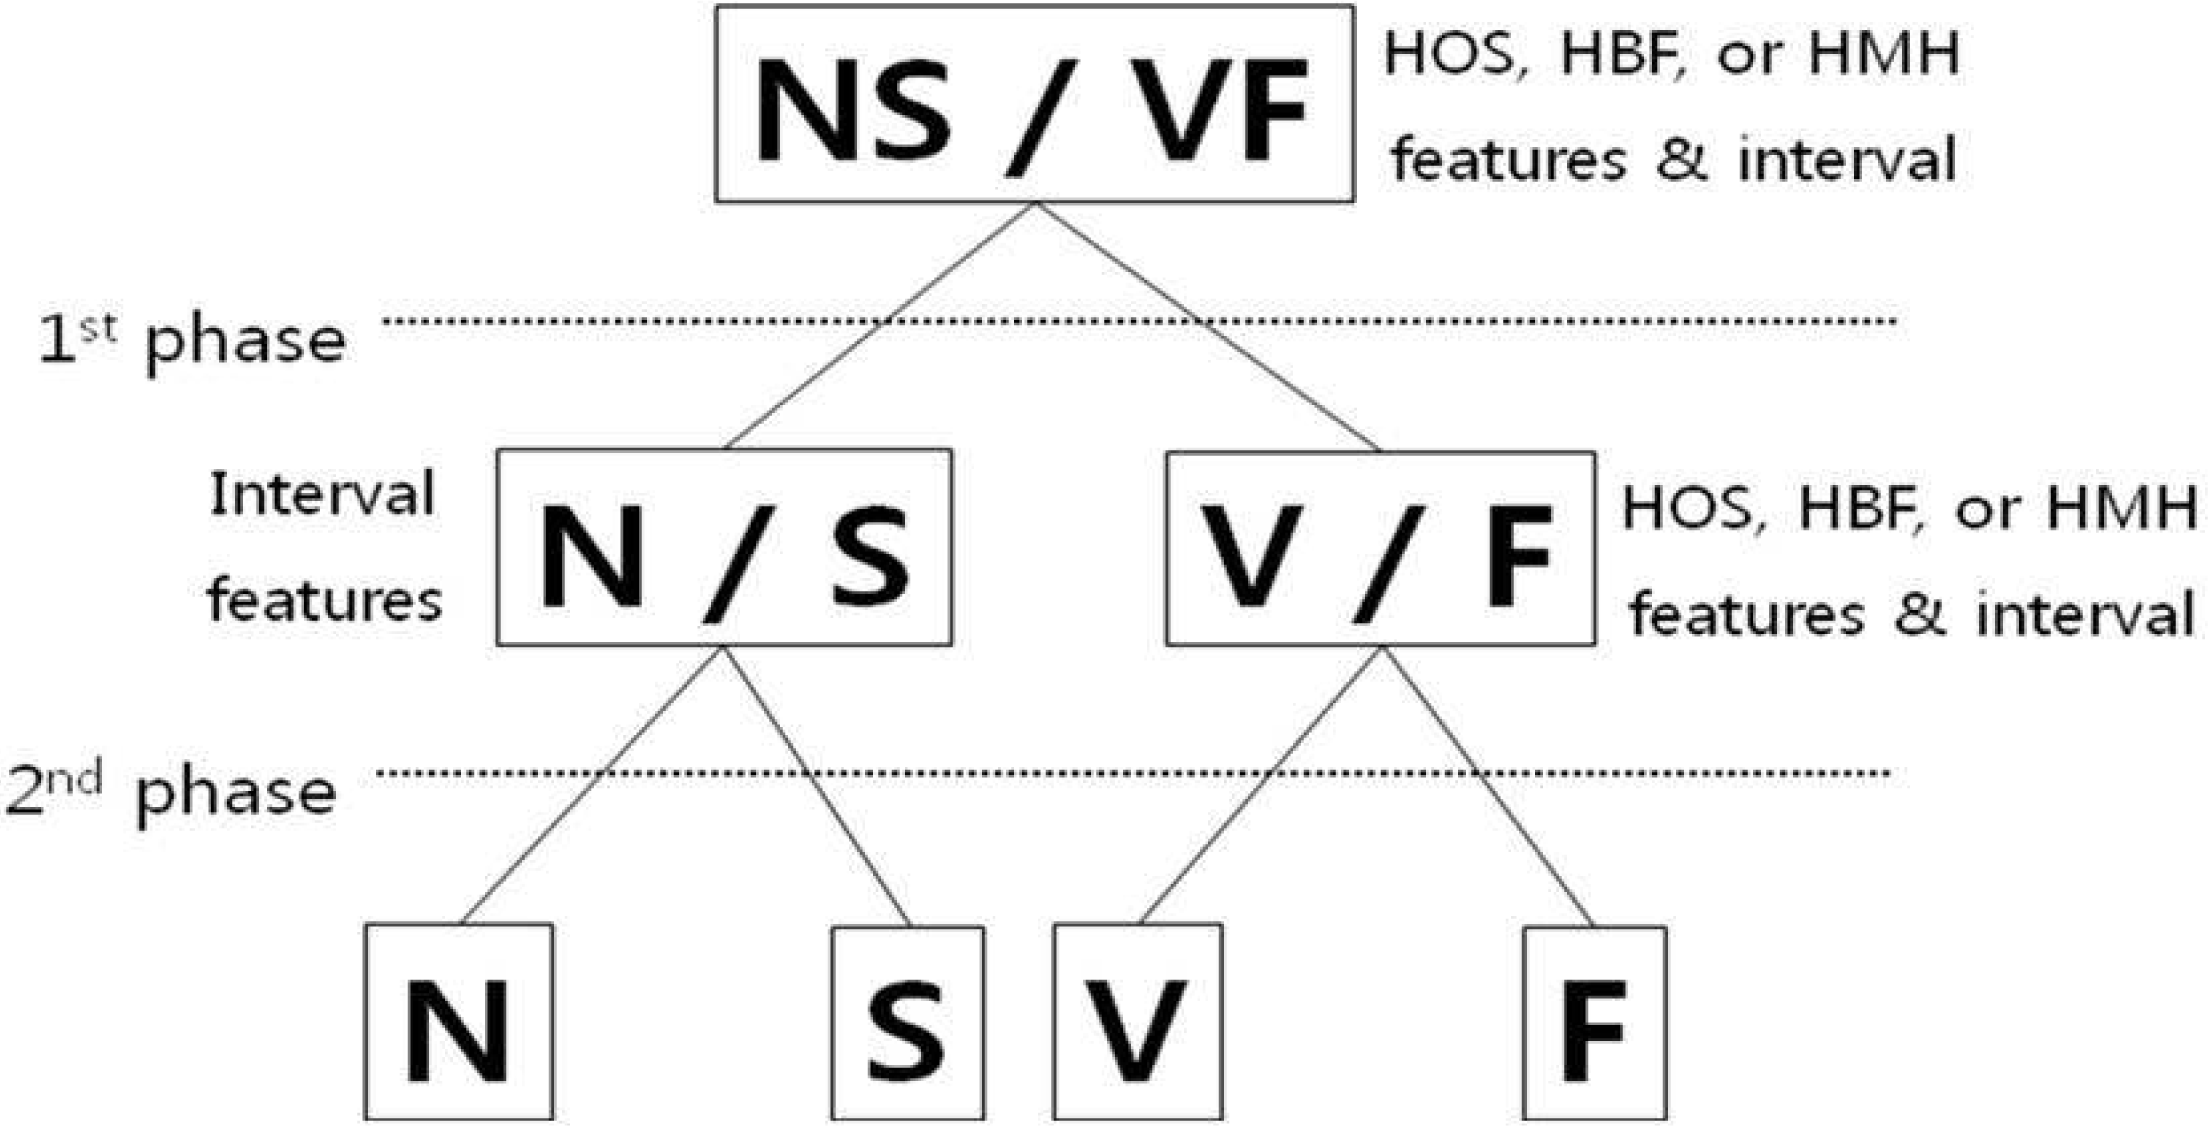 | Figure 7.Hierarchical classification is that the ECG beat classes were combined into two classes based on the morphological similarity at first phase. The second phase classifies individual classes |
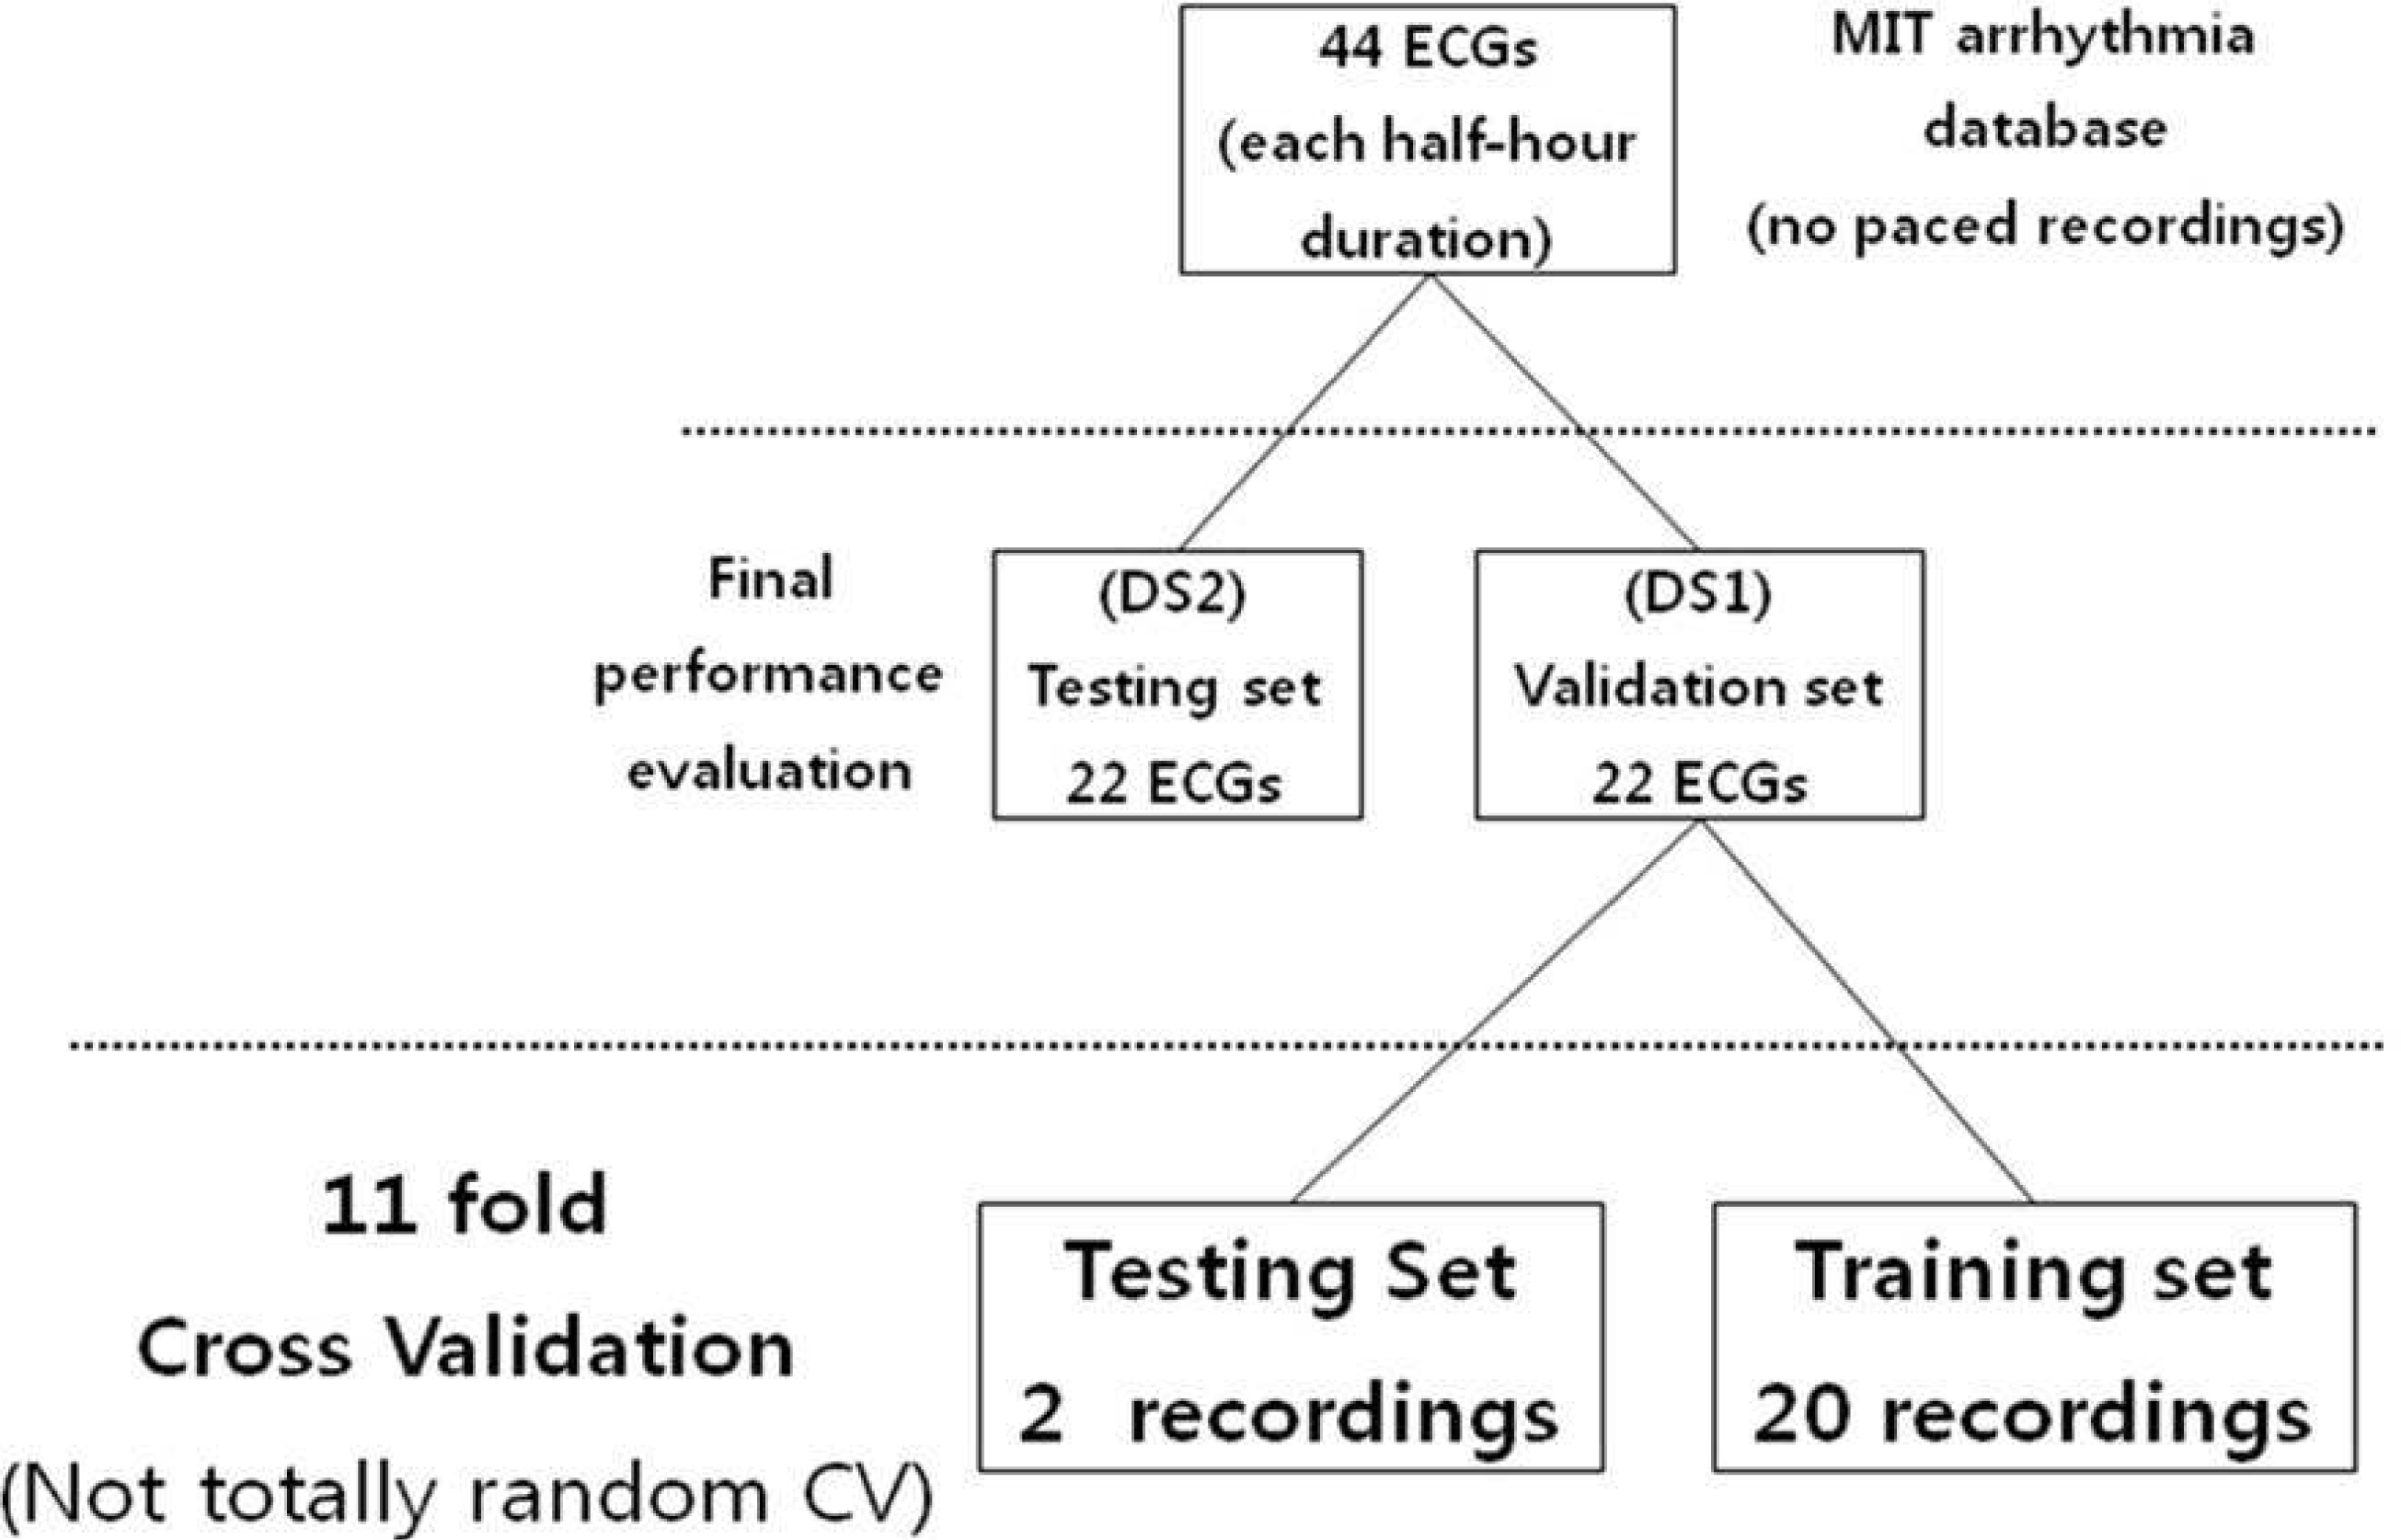 | Figure 8.Division of validation set (DS1) into training and testing set for classifier evaluation using 11 fold cross validation. Final performance evaluation is performed to test testing set (DS2). |
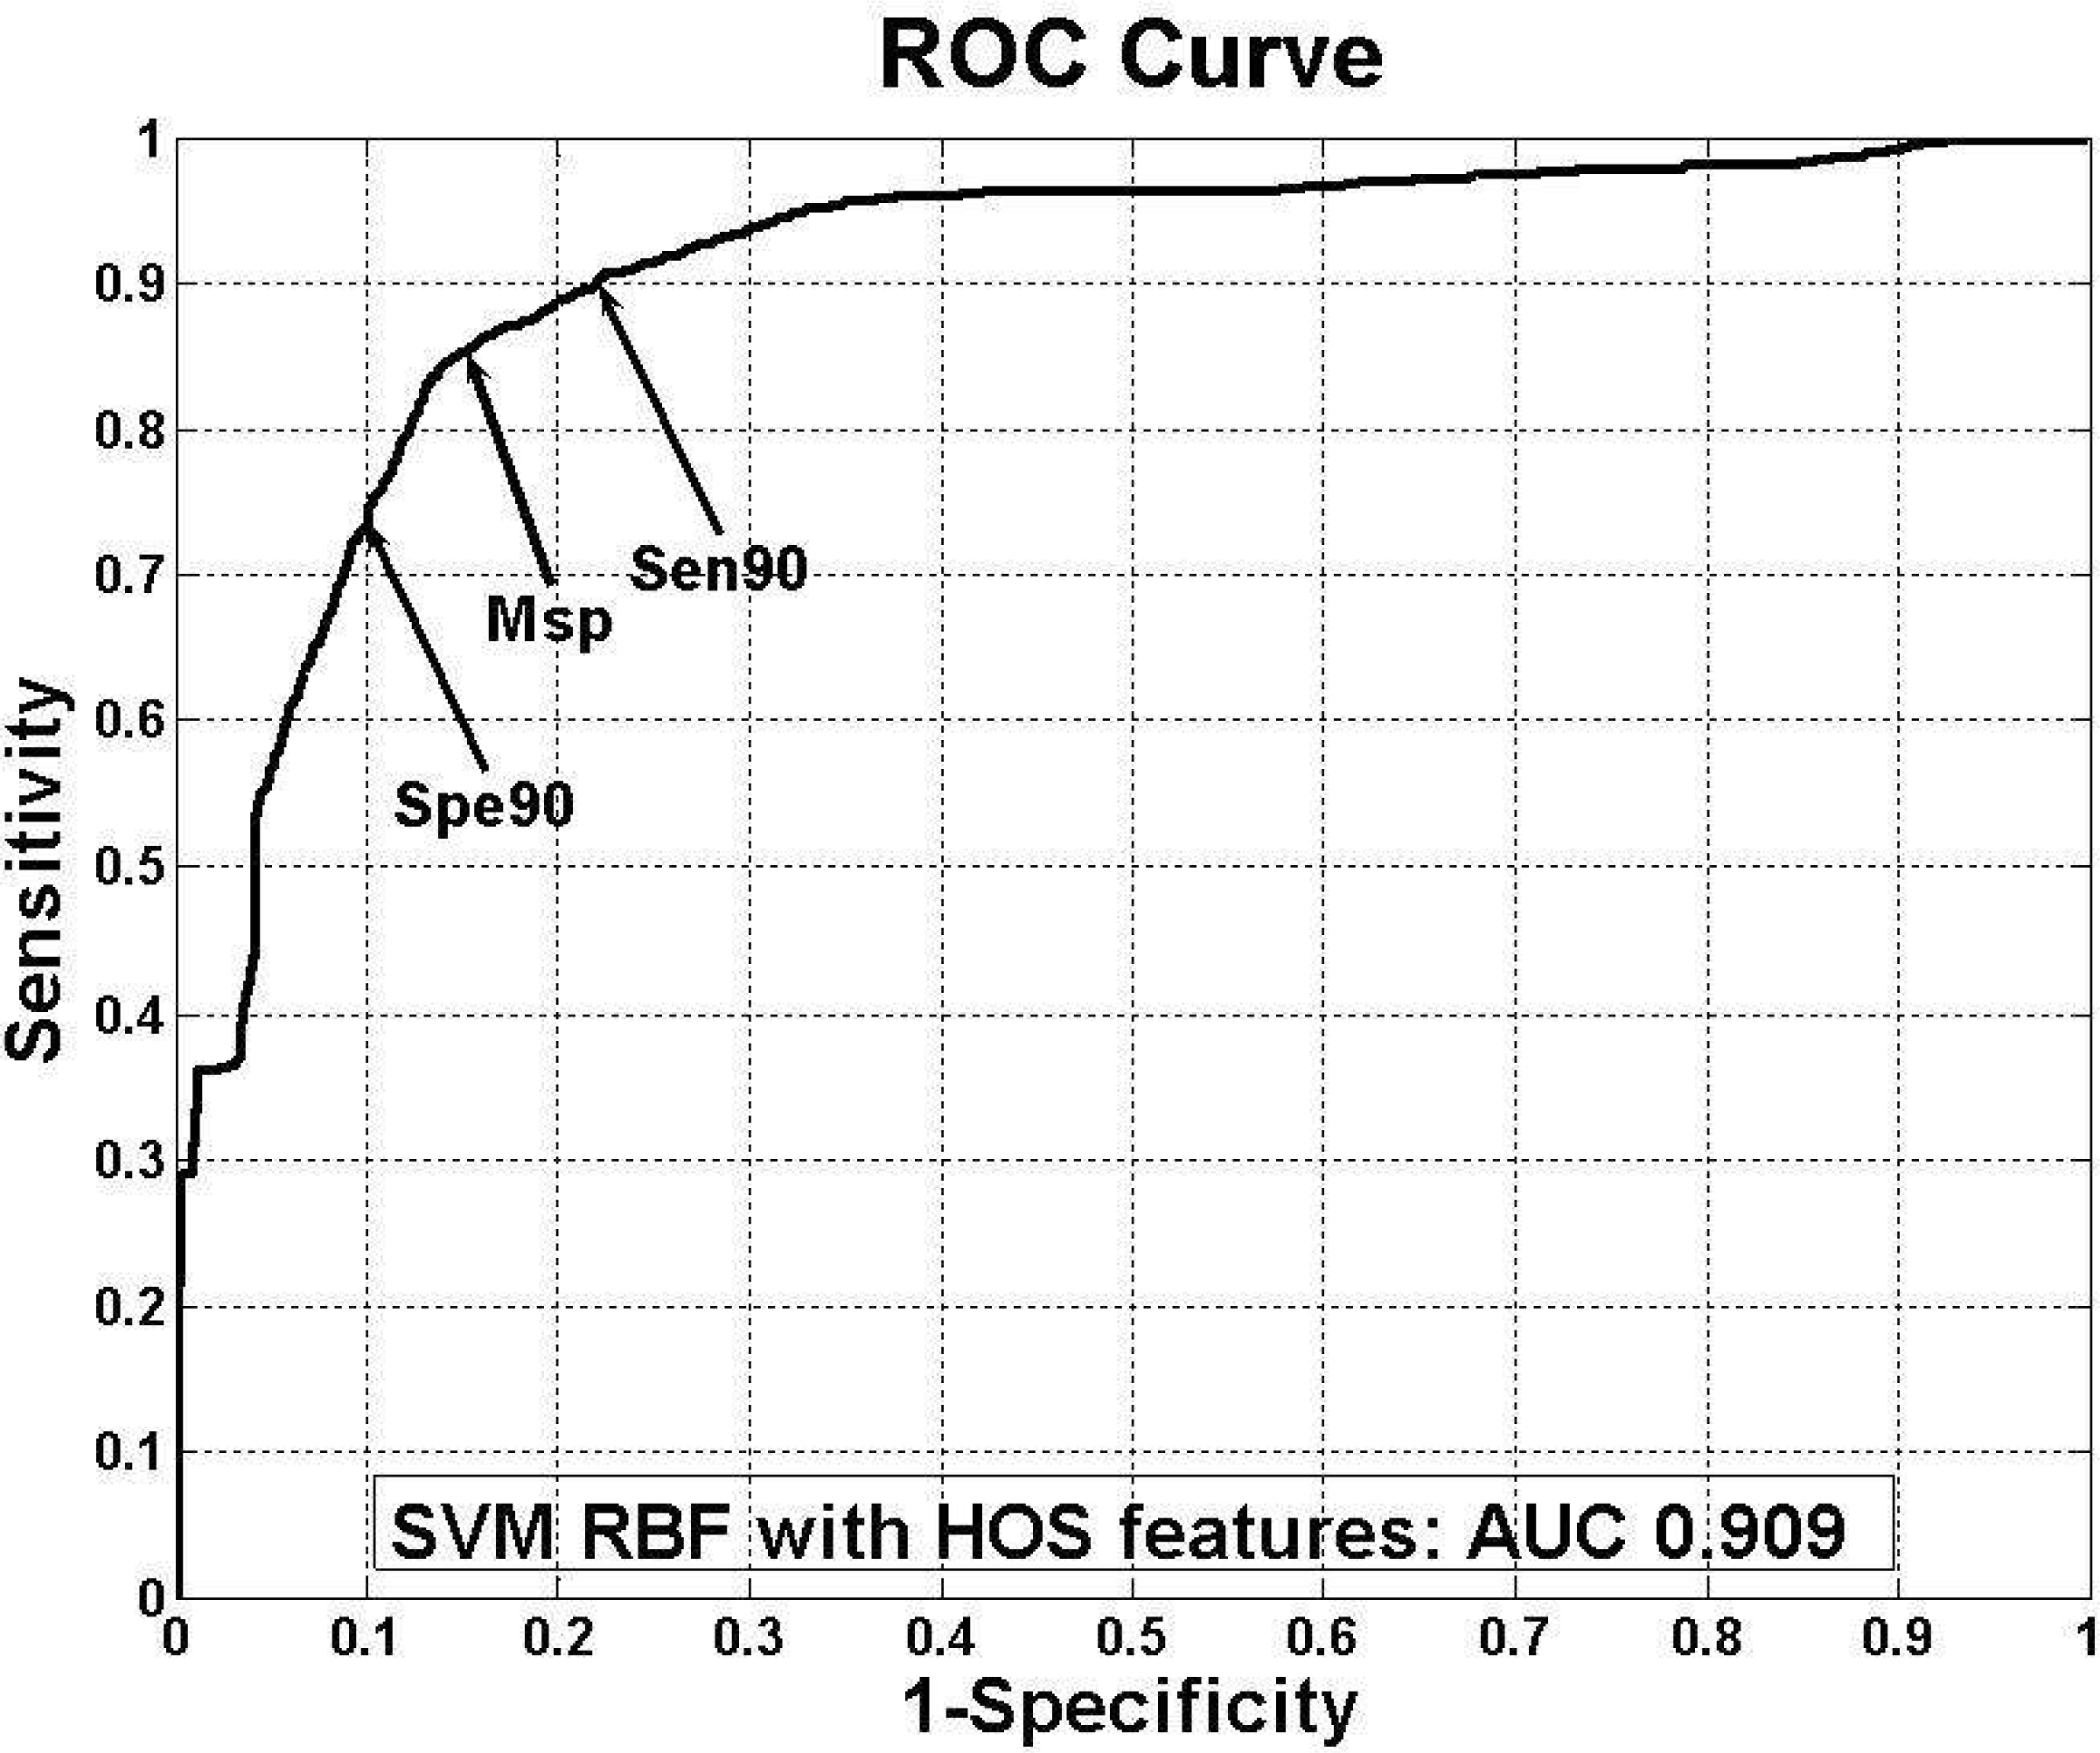 | Figure 9.ROC curve of the best classifier. The arrows indicate sensitivity 90% point (Sen_90), specificity 90% point (Spe_90), and minimum distance point (Msp) between ROC curve and (1,0) point |
Table 1.
Merging the MIT-BIH heartbeat types to the AAMI heartbeat classes
Table 2.
Organized Dataset 1(DS1) and Dataset 2(DS2) from MIT-BIH dataset
| N | S | V | F | Total | |
|---|---|---|---|---|---|
| DS1 | 45,868 | 943 | 4,259 | 415 | 51,013 |
| (Ratio, %) | (89.08) | (1.83) | (8.24) | (0.81) | (100) |
| DS2 | 44,259 | 1,837 | 3,221 | 388 | 49,705 |
| (Ratio, %) | (89.03) | (3.71) | (6.48) | (0.78) | (100) |
Table 3.
Class ratio of DS1 and sampled DS1
| N | S | V | F | Total | |
|---|---|---|---|---|---|
| DS1 | 45,868 | 943 | 4,259 | 415 | 51,493 |
| (Ratio, %) | (89.08) | (1.83) | (8.24) | (0.81) | (100) |
| Sampled DS1 | 9,172 | 194 | 854 | 86 | 10,306 |
| (Ratio, %) | (89.00) | (1.88) | (8.29) | (0.83) | (100) |
Table 4.
Result of DS1 using conventional multiclass classification by linear and RBF kernel
|
Kernel |
Linear |
Radial |
||||
|---|---|---|---|---|---|---|
| Parameter | HOS* | HBF† | HMH‡ | HOS | HBF | HMH |
| N Sensitivity | 99.11 | 91.39 | 98.58 | 98.82 | 87.70 | 98.07 |
| S Sensitivity | 0.00 | 1.70 | 0.00 | 0.00 | 0.85 | 0.00 |
| V Sensitivity | 58.07 | 27.70 | 59.23 | 65.25 | 70.02 | 64.22 |
| F Sensitivity | 0.24 | 0.24 | 0.24 | 1.44 | 0.96 | 1.45 |
| Accuracy | 93.43 | 84.26 | 93.04 | 93.71 | 84.08 | 92.96 |
| Mean of Sensitivity | 39.36 | 30.26 | 39.51 | 41.38 | 39.88 | 40.94 |
| +P§ of S | 0.00 | 0.99 | 0.00 | 0.00 | 0.44 | 0.00 |
| +P§ of V | 65.54 | 34.90 | 62.72 | 78.20 | 39.88 | 78.78 |
Table 5.
Result of testing DS2 using conventional multiclass classification
| Parameter | Result |
|---|---|
| N Sensitivity | 99.65 |
| S Sensitivity | 0.00 |
| V Sensitivity | 84.48 |
| F Sensitivity | 0.52 |
| Accuracy | 94.21 |
| Mean of Sensitivity value | 46.16 |
| +P*ofS | 0.00 |
| +P*ofV | 72.37 |
Table 6.
Sensitivity, specificity, accuracy and threshold of each arrow points in NS vs. VF ROC curve
| Parameter | Sen_90* | Msp† | Spe_90‡ |
|---|---|---|---|
| Sensitivity | 90 | 84 | 74 |
| Specificity | 78 | 86 | 90 |
| Accuracy | 79 | 86 | 88 |
| Threshold | 0.955 | 0.925 | 0.835 |
Table 7.
AUC value and kernel by feature extraction method
Table 8.
Classification performance of hierarchical classification and multiclass classification on DS2
| Parameter | DS2_multi* | DS2_HOS† | DS2_HBF‡ | DS2_HMH∮ |
|---|---|---|---|---|
| N Sensitivity | 99.65 | 81.23 | 86.25 | 82.98 |
| S Sensitivity | 0.00 | 57.65 | 82.63 | 75.23 |
| V Sensitivity | 84.48 | 83.11 | 80.88 | 84.17 |
| F Sensitivity | 0.52 | 79.90 | 54.90 | 82.47 |
| Accuracy | 94.21 | 80.47 | 85.56 | 82.80 |
| Mean of Sensitivity | 46.16 | 75.47 | 76.16 | 81.21 |
| +P || of S | 0.00 | 21.50 | 24.78 | 24.12 |
| +P || of V | 72.37 | 46.11 | 89.09 | 84.69 |


 PDF
PDF ePub
ePub Citation
 Print
Print


 XML Download