

 PDF
PDF ePub
ePub Citation
 Print
Print


Introduction
Sepsis is a common reason for hospitalization and admission to intensive care units (ICUs), and severe sepsis accounts for 20% of all ICU admissions [1]. Although efforts have attempted to improve outcome, sepsis still results in high morbidity and mortality.
Early recognition and risk stratification are necessary to improve the outcomes in patients with sepsis [2, 3]. Several clinical scores that reflect disease severity and predict sepsis outcome including physiology and chronic health evaluation (APACHE), the sequential organ failure assessment (SOFA), and simplified acute physiology scores (SAPS). However, none has sufficient accuracy to serve as a prognostic indicator, and the current trend is to include the biological response in predictive scores, such as the PIRO (predisposition, insult, response, and organ dysfunction) concept [4].
More than 100 molecules have been investigated as biological markers of sepsis [5]. The most widely used are C-reactive protein (CRP) and procalcitonin, although they have limited ability as diagnostic and prognostic markers [6]. Therefore, there are many ongoing studies to identify better biomarkers.
Recent, studies have introduced the delta neutrophil index (DN), a measure that reflects the number of immature granulocytes (IG) in the peripheral blood [7]. Polymorphonuclear neutrophil granulocytes are the first-line effectors of host defense against bacteria. After a maturation period of 7-10 days, they migrate into the peripheral blood [8]. The presence of IGs in the peripheral blood of adult patients represents increased myeloid cell production, generally accompanied by infection or severe inflammatory disease [9]. Increased IG levels are included in the definition of systemic inflammatory response syndrome (SIRS) [10]. IG count can be measured with blood film morphology. However, this a manual method is imprecise due to the small number of cells counted, is labor intensive, time-consuming, and non-reproducible; thus IG count has not been widely used [9]. An automatic analyzer measures differential leukocyte counts by two methods: a cytochemical myeloperoxidase (MPO) reaction and light beam reflection from nuclear lobularities in white blood cells (WBCs). DN is defined as the difference in counts between the two methods. DN strongly correlated with manual immature granulocyte count, and has shown an association with disseminated intravascular coagulation scores, positive blood culture rates, and mortality in patients with suspected sepsis [7]. Additional studies have investigated DN as a diagnostic and prognostic marker for sepsis [8, 11, 12].
Some reports have studied the relationship between infection and DN [13, 14, 15]. DN may be able to differentiate true bacteremia from blood culture contamination [13]. DN at 72 h (cut-off value of 12%) could predict 7-day mortality in neonatal sepsis [14]. DN at the onset of spontaneous bacterial peritonitis (cut-off value of 5.7%) was significantly associated with 30-day mortality in liver cirrhosis [15].
In this study, we investigated DN as a predictive marker of early mortality in patients with gram-negative bacteremia (GNB). We evaluated DN trends and values for correlation with sepsis prognosis. In addition, we investigated the usefulness of DN in combination with other laboratory and clinical markers as a prognostic factor in sepsis.
Materials and Methods
1. Study design
We conducted a retrospective study to test the effectiveness of DN as a prognostic marker of early mortality in GNB. The study was approved by the Institutional Review Board of Severance Hospital (IRB 4-2012-0162).
In-hospital mortality was assessed 10 days after onset of bacteremia. The patients were divided into two groups: death within 10 days (non-survivor; case) and survival on day 10 (survivor; control).
2. Patient eligibility criteria
All adult patients (≥ 18 years of age) admitted to Severance Hospital, a 2,000-bed tertiary referral university hospital in South Korea, from November 2010 to March 2011 were screened retrospectively. Patients with GNB were included in the study, and laboratory data and clinical data were collected from the database registry. Patients with subsequent episodes of bacteremia at any time during the same hospitalization period were excluded. Blood cultures positive for previously isolated organisms within 14 days of bacteremia onset were considered part of the first bacteremic episode. Patients who were bacteremic as outpatients or who were discharged from the hospital before obtaining culture results were excluded from the study. Patients with comorbidities that could affect the production of IG were also excluded. These conditions included myelodysplastic syndromes, myeloproliferative diseases, myelofibrosis, metastatic bone marrow infiltration by a malignancy, recovery after bone marrow hypoplasia or agranulocytosis, severe systemic inflammation such as systemic lupus erythematosus or thrombotic thrombocytopenic purpura, acute rejection after organ transplantation, trauma, acute bleeding, and recent operations.
3. Definitions
The day that the febrile event was first identified was defined as the onset of bacteremia and considered day 1. In cases with no febrile event, the day when blood cultures were taken was considered day 1. The third day from onset of bacteremia, that is, 2 days after the day of onset, was named day 3. Similarly, the seventh day was day 7.
DN was calculated using an automatic hematology analyzer (ADVIA 2120; Siemens Healthcare Diagnostics, IL, USA) as previously described [7]: DN = leukocyte subfraction assayed in the MPO channel by cytochemical reaction - the leukocyte subfraction counted in the nuclear lobularity channel by reflected light beam [7].
4. Data collection
Data collected from individual patients included age, sex, body mass index (BMI), source of infection, duration of hospital stay before onset of bacteremia, history of ICU admission before onset of bacteremia, appropriateness of antibiotic treatment, presence of multidrug resistant (MDR) bacterial infection, and if the infection was healthcare-associated. We also investigated the Charlson comorbidity index to estimate baseline conditions [16]. Appropriate antibiotic therapy, MDR bacterial infection, and healthcare-associated infection were defined as in our previous study [12]. WBC count, percentage of neutrophils, DN, platelet count, erythrocyte sedimentation rate (ESR), and CRP were collected at day 1, day 3, and day 7.
5. Four multivariate regression models
To evaluate the performance of DN as a predictor of mortality in GNB, we developed four multivariate models from factors associated with early mortality. APACHE II score was excluded in all models because it had significant correlation with SOFA score. We established an initial DN cut-off value with the greatest sensitivity and specificity in patients with GNB that was predictive of early mortality. We formed DN groups based on an initial DN greater or not greater than this cut-off value. We then divided all patients into 4 groups according to initial DN and DN trend.
6. Statistical analysis
Continuous variables were expressed as medians with interquartile ranges (IQR) and the Mann-Whitney U test was used to compare continuous variables. Categorical variables were expressed as absolute numbers and percentages, and the chi-square and Fisher's exact tests were used to compare thesel variables. A linear mixed model was used to compare laboratory and clinical data trend over 7 days. To identify independent risk factors for early mortality in patients with GNB, multivariate logistic regression models were used to control for effects of confounding factors. We made four multivariate models and the area under the curve (AUC) of the receiver operating characteristic (ROC) curve was calculated for each model to estimate the accuracy of the model for predicting early mortality in GNB. We divided the patients into 4 groups according to DN change over time. Cumulative overall survival rates were calculated using Kaplan-Meier estimates and a log-rank test was used to compare survival rates among the 4 groups. All P-values were two-tailed and P < 0.05 was considered statistically significant. All statistical analysis were performed using SPSS statistical software (version 18.0; SPSS Inc., Chicago, IL, USA).
Results
1. Patients
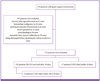
During the 5 months of the study period, 279 patients with GNB were screened for eligibility. Of these, 107 were excluded; hence, leaving 172 patients were included in the analysis. Among these patients, 17 died within 10 days (non-survivor), and 155 survived 10 days from bacteremia onset (survivor). Among the 155 survivors, 13 patients died between 10 to 30 days of day 1 (Fig. 1). The median age of patients with GNB was 64.65 years, and 77 patients (44.8%) were male. The mean score (± SD) of the Charlson comorbidity index was 3.58 (± 2.49).
2. Baseline characteristics and clinical data
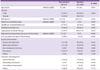
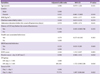
The baseline characteristics of patients with GNB are described in Table 1. The Charlson comorbidity index was higher in the non-survivor group than the survivor group (P = 0.010). Healthcare-associated and MDR bacterial infections were more frequent in non-survivors than in survivors (P = 0.002 and P = 0.001, respectively). The duration of hospital stay before the onset of bacteremia was longer in non-survivors than in survivors (P < 0.001). Patients treated in the ICU before bacteremia onset accounted for 29.4% of the non-survivor group and 3.2% of the survivor group (P < 0.001). The most frequent source of bacteremia was urinary tract infection in survivors (38.1%) and pneumonia in non-survivors (64.7%) (P < 0.034). The predominant causative microorganism was Escherichia coli (n = 78, 50.3%) in survivors and Acinetobacter baumannii (n = 7, 41.2%) in non-survivors (Table 1).
There were statistically significant differences in disease severity between survivors and non-survivors. The propotion of patients with sepsis, severe sepsis and septic shock was 43.8% (n = 68), 35.4% (n = 55), 20.6% (n = 32) in survivors and 11.7% (n = 2), 11.7% (n = 2), 76.4% (n=13) in non-survivors (Fisher's exact test, P < 0.001).
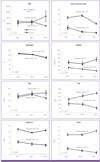
Laboratory and clinical data of patients with GNB on days 1, 3, and 7 are shown in Figure 2. There was no statistically significant difference in WBC count between non-survivors and survivors over the 7 days. The regression slope of the non-survivor group was positive (regression slope = 990) while that of the survivor group was negative (regression slope = -710, P = 0.001). DN was higher in non-survivors on day 1 and day 3 than in survivors (P = 0.012 and 0.003, respectively). The regression slope of DN for non-survivors was -1.32 and -0.36, respectively (P = 0.024). When non-survivors were divided into groups based on time to death (before 10 days and 10 - 30 days), the DN was higher in those who died within 10 days on day 7 testing (mean DN (± SD) for deaths within 10 to 30 days: 7 (± 6) on day 1, 3 (± 2) on day 3, 5 (± 7) on day 7; P-value = 0.009, <0.001, and 0.001, respectively; data not shown). Platelet counts tended to decrease during the 7 days in non-survivors (regression slope = -10.01), and counts were lower than in the survivor group on days 1, 3, and 7 (P = 0.003, < 0.001, and < 0.001, respectively). There was no difference in CRP levels between the 2 groups during the 7 days. There was a tendency towards increasing CRP levels in the non-survivor group and decreasing levels in the survivor group during the 7 days (regression slope = 12.88 and -10.8; respectively, P = 0.001). APACHE II scores were higher in non-survivors than in survivors during the 7 days (P < 0.001). SOFA scores were higher in non-survivors than in survivors during the 7 days (P < 0.001, < 0.001, and 0.011, respectively). There was a tendency for SOFA scores to increase in non-survivors and to decrease in survivors (regression slope = 0.46 and -0.22, respectively; P = 0.001). There were no significant differences in value or regression slope in the percentage of neutrophils and ESR between the 2 groups during the 7 days.
3. Multivariate regression analysis
Factors associated with early mortality were assessed by multivariate logistic regression. Variables associated with early mortality in univariate analysis (P < 0.05) and baseline demographic data including age, sex, BMI, and Charlson comorbidity index, were included in the multivariate model. Among the laboratory data, platelet count and DN were included.
The independent factors associated with early mortality were the SOFA score with an odds ratio (OR) of 2.24 (95% CI: 1.31 to 3.84), DN-day 1 ≥ 7.6% with an OR of 305.18 (95% CI: 1.73 to 53983.52) and DN-day 3 ≥ DN-day 1 with an OR of 77.77 (95% CI: 1.90 to 3188.05) (Table 2).
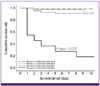
We produced four multivariate models, shown in Supplementary Table 1. Model 4 has the highest AUC of ROC curve among the four models; data are shown in Figure 3. The patients were divided into two groups based on a threshold DN value on day 1 of 7.6%. DN trend was also included, defined as whether or not DN had decreased on day 3. The AUC of this regression model was 0.987.
Based on the multivariate analysis, we divided the patients into 4- groups by DN count on day 1 and the DN trend. Group 1 had a day 1 DN < 7.6% and a day 1 DN > DN on day 3. Group 2 had a day 1 DN < 7.6% and a day 1 DN ≤ DN on day 3. Group 3 had a DN on day 1 ≥ 7.6% and a DN on day 1 > DN on day 3. Group 4 had a DN on day 1 ≥ 7.6% and a DN on day 1 ≤ DN on day 3. The differences in survival rates among the 4 groups are shown in Figure 3. Group 4 had the highest mortality rate (P < 0.001).
Discussion
Sepsis is a syndrome that can result in high morbidity and mortality, and risk prediction is necessary during monitoring and managing patients with sepsis [19]. Biomarkers such as CRP, procalcitonin, and various cytokines are elevated both in sepsis and noninfectious inflammatory diseases [2, 4, 5, 6] While these biomarkers could be useful as prognostic and diagnostic markers during sepsis treatment, they tend to be inconsistent and heterogeneous [2, 3, 4, 5, 6, 7, 8, 9, 10, 11, 12, 16, 17, 18, 19, 20]. Prognostic markers have a significant role as indicators to inform effective treatment and as an alarm system to predict death in patients with sepsis. For these reasons, there is a need to find suitable and specialized markers for sepsis.
DN is one laboratory marker of sepsis. In our previous study, we found that DN could be used as a predictor of mortality in patients with bacteremia 72 hours after onset of bacteremia [12]. In the present study, we sought to analyze the relationship between DN and early mortality in GNB in more detail.
In our study, non-survivors had more comorbidities than survivors. Healthcare-associated infections, MDR bacterial infections, source of bacteremia, and causative microorganisms were correlated with early mortality in patients with GNB. These findings were consistent with those of previous studies [21, 22]. Among laboratory variables, DN during 3 days, the absolute platelet count during 7 days, WBC count trends, DN, and CRP were significant factors associated with mortality. Absolute APACHE II and SOFA scores and trends were also associated with mortality. WBC count and CRP are widely used as prognostic indicators in the field, and we confirmed that trends are more important than absolute count for these variables.
To evaluate the significance of DN as a predictor of mortality in GNB, we made multivariate models from factors associated with early mortality. APACHE II score was excluded from the models because it had significant correlation with SOFA score. The best cut-off value of initial DN for predicting early mortality in GNB was 7.6%, which corresponded to a sensitivity and specificity of 76.5% and 74.2%, respectively. We formed DN groups based on an initial DN greater or not greater than 7.6%. A DN on day 1 ≥ 7.6% was an independent predictor of early mortality. DN trend was also an independent factor for early mortality; therefore, we divided study patients into 4 groups according to both initial DN and the DN trend. We found that a DN on day 1 ≥ 7.6% and a DN on day 1≤ DN on day 3 to be more predictive of early mortality in patients with GNB.
Our study has several limitations. In our previous retrospective study, it was difficult to distinguish true infections from blood culture contamination in gram-positive bacteremia [12]. Because the present study was a retrospective study, we limited inclusion criteria to include only GNB cases. As a result, we cannot be sure that our findings are applicable to infectious diseases. The second limitation results from our exclusion of patients with serious underlying illnesses like hematologic malignancy and the mortality rate was relatively low in our study compared to other general reports [7, 11, 15]. Third, our study used 7.6% as the cut-off DN value to predict mortality in patients with GNB. Previous studies used a value of 2.7% to predict sepsis in patients with bacteremia [11] and 6.5% to predict severe sepsis in patients with sepsis [8]. To use DN as a universal marker, it is essential to determine an exact cut-off value that can be generally agreed upon. Finally, DN was calculated using an ADVIA analyzer, which uses peroxidase and light scatter for WBC analysis, and its results may not be consistent with immature granulocyte counts from other analyzers using a different methods to determine leukocyte differential counts. Though calculation of DN is currently limited to the ADVIA analyzer, there are reports of other analyzers that could count immature granulocyte automatically [20, 23, 24].
Despite these limitations, it is obvious that DN is as useful an indicator for predicting early mortality in patients with GNB as other existing methods. Furthermore, DN does not require additional time or cost as it can be calculated as soon as automatic leukocyte differential counts are completed. The time and cost-saving features of DN make it advantageous. Because sepsis is heterogeneous and fluctuating in nature, no single marker can be used as an independent prognostic indicator. However, both DN trend and value on specific days could be a powerful prognostic factor.
In conclusion, we found DN to be a potentially useful marker of early mortality in patients with GNB. Mortality rates were significantly higher when initial DN was greater than 7.6% and did not decreased until the third day after onset of bacteremia.
 XML Download