

 PDF
PDF ePub
ePub Citation
 Print
Print


The qualitative results of interferon-γ release assays (IGRAs), categorized as negative, positive, or indeterminate according to the particular cut-off values provided by manufacturers, have been used for diagnosis of Mycobacterium tuberculosis [1]. There have been several studies of the quantitative aspects of IGRAs used to assess the disease activity of tuberculosis (TB) or responses to anti-tuberculous treatment [2, 3, 4]. However, limited data are available concerning which factors are associated with strong immunologic responses to the T-SPOT.TB, although such responses occasionally occur. We therefore investigated the factors associated with strong positive responses to the T-SPOT.TB in patients with extrapulmonary TB (E-TB).
All adult patients with suspected E-TB admitted to Asan Medical Center (a 2,700-bed tertiary hospital in Seoul, South Korea) in an intermediate TB-burden country between April 2008 and November 2012 were prospectively enrolled in the study. Patients were included if they had any clinical symptoms, signs or radiographic evidence of E-TB, and there were no exclusion criteria. All patients provided written informed consent.
All patients were diagnosed by two independent study investigators (YM Lee and SH Kim), based on clinical, histopathological, radiological, and microbiological data collected over a follow-up period of at least three months. The clinical categories of patients with suspected E-TB have been described previously [5, 6, 7].
The criteria for positive, negative, and indeterminate outcomes of T-SPOT.TB (Oxford Immunotec, Abingdon, UK) were as recommended by the manufacturer. The outcome was considered indeterminate if the number of spots in the positive control well was <20 (low mitogen response) or the number of spots in the negative control well was >10 (high nil response). Patients with strong positive response to the T-SPOT.TB, defined ≥1,000 spot forming units (SFU)/2.5×105 PBMC to ESAT-6 or CFP-10, were compared with control patients with weak positive responses of ≤99 SFU (6-99 SFU)/2.5×105 PBMC.
To evaluate factors associated with extremely strong T-SPOT.TB results, univariate logistic regression analyses were performed. Using only the variables with P<0.1 in the univariate analysis, the independent risk factors for strong positive results in the T-SPOT.TB were identified by means of stepwise backward logistic regression analysis. Any variables with high multicollinearity were excluded from the final model.
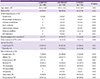
A total 530 patients with suspected E-TB, consisting of 270 (50.9%) E-TB and 260 (49.1%) non-TB patients were prospectively enrolled. Among the 270 patients with E-TB, 153 (57%) were classified as confirmed TB, 55 (20%) as probable E-TB, and 62 (23%) as possible E-TB. Of the 208 patients with confirmed or probable E-TB 173 (49%) with positive results in the T-SPOT.TB (consisting of 132 (86%) confirmed TB and 41 (75%) probable TB patients) were included in the final analysis. Clinical characteristics according to the result of the T-SPOT.TB are shown in Supplementary Table 1. Of these 173 patients, 26 (15%), 76 (44%), and 71 (41%) had ≥1,000 SFU, 100-999 SFU, and 6-99 SFU/2.5×105 PBMC to RD-1 in the T-SPOT.TB assay, respectively. Demographic characteristics according to the responses to the T-SPOT.TB are shown in Table 1.
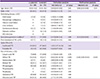
To identify factors associated with strong positive results in the T-SPOT.TB, the characteristics of the 26 (15%) patients with strong positive responses and those of the 71 (41%) with weak positive response were compared. The results of univariate and multivariate analyses are shown in Table 2. Univariate analysis revealed that young age, confirmed TB, and miliary TB were significantly associated with strong positive results in the T-SPOT.TB. In multivariate analysis, miliary TB (OR: 14.5; 95% CI: 3.9 to 53.8) was significantly associated with strong positive responses in the T-SPOT.TB, while advanced age (OR: 0.9; 95% CI: 0.9 to 0.99), and immunosuppression (OR: 0.2; 95% CI: 0.02 to 0.9) were associated with weak positive responses. When the 62 patients with possible TB were included in the analysis, the factors associated with strong positive results in the T-SPOT.TB were similar to those in the patients with confirmed and probable TB (Supplementary Table 2).
The results of the in vivo tuberculin skin test (TST) or in vitro IGRA are the net outcomes of the interplay of host immune responses to TB antigens. It is well known that the TST is frequently negative in patients with miliary TB and is converted to positivity during anti-TB treatment [8]. This phenomenon is explained by the fact that an overwhelming antigenic overload can cause anergy. Interestingly, we found that in certain types of E-TB (i.e., miliary TB) in which the body contains high levels of TB antigen, the T-SPOT.TB response is strong regardless of host immune status. That means that the responsiveness of the T-SPOT.TB depends on the total antigenic load. This finding is consistent with our recent report that the sensitivity of the T-SPOT.TB in patients with miliary TB was as high as 93% [9].
We showed that immunosuppression and old age were independently associated with a weak T-SPOT.TB response. Thus net responsiveness to the T-SPOT.TB is mainly affected by antigenic load, host immune status, and age. However, it is beyond the scope of this study to examine which factors most strongly influence responsiveness to the T-SPOT.TB. The complex interactions of host factors with antigenic load partially explain the chaotic responsiveness to IGRAs seen after anti-TB treatment [10]. Intuitively, anti-TB treatment should reduce antigenic load, and so should lower responsiveness to an IGRA. However, some intracellular TB antigens may be released into the circulation, so it is hard to be sure that anti-TB treatment would necessarily result in a reduced antigenic load. Further studies are needed in this area.
Some may argue that the cut-off values for a strong positive and a weak positive responses in the T-SPOT.TB of ≥1,000 SFU and ≤99 SFU per 2.5×10⁵ PBMC, respectively, are arbitrary. We excluded patients with 100 to 999 SFU per 2.5×10⁵ PBMC to avoid dilution of the true difference between the high response and low response group. If we divided the two groups by 1,000 SFU per 2.5×10⁵ PBMC and analyzed the factors associated with high responsiveness, the results were similar (Supplementary Table 3).
In conclusion, our data suggest that mycobacterial burden and host immune status contribute to a strong response in the T-SPOT.TB.
 XML Download