

 PDF
PDF ePub
ePub Citation
 Print
Print


Introduction
Traditionally, therapeutic monitoring of vancomycin has been recommended to prevent toxicity, and earlier studies established the target peak concentration for vancomycin in the range of 30 to 35 mg/L, with troughs of 5 to 10 mg/L. More recently, however, evidence has emerged that trough concentrations of 5 to 10 mg/L might be insufficient and a higher trough level, i.e., exceeding 15 mg/L, has been suggested for pneumonia, meningitis, and for species that are more resistant [1, 2]. On the basis of various pharmacodynamic data, the ratio of the steady-state 24-hour area under the concentration-time curve (ssAUC24) to the MIC (ssAUC24/MIC) of 400 or higher has been recommended as the preferred pharmacodynamic index to achieve clinical effectiveness with vancomycin [3, 4]. Several simulation studies have suggested that the daily dose of vancomycin should be escalated to 4000 to 6000 mg to achieve the AUC24/MIC ratio of 400 or higher, and, as a result, a through concentration was increased to 15 to 20 mg/L [5, 6].
To obtain the AUC24 value more easily in the clinical setting, numerous previous studies have used the calculated AUC24 (cAUC24) using the formula based on the CLcr (see Equation 2, below) to determining the vancomycin dose [3, 4, 7]. According to this formula, there is a possibility that the cAUC24 might be underestimated when the CLcr is overestimated. That means that a higher dose of vancomycin could be recommended inappropriately when the CLcr is overestimated. Recently, as the vancomycin MIC against methicillin resistant Staphylococcus aureus (MRSA) continues to increase, several studies have reported that the trough concentration of vancomycin should be maintained at 20 mg/L or higher to reach a target value of the AUC24/MIC ratio of 400 or higher, and this leads to a concern that vancomycin cannot be further used for the treatment of MRSA due to its toxicity [6, 8, 9].
The primary objective of the current study was to assess whether the cAUC24 based on the CLcr differs from the estimated ssAUC24 obtained from individual pharmacokinetic parameters of vancomycin in patients with normal creatinine concentrations by using a commercial software, the CAPCIL program (Simkin Inc., Gainesville, Florida, USA). Attempts were also made to compare these values (cAUC24, ssAUC24) with the trough concentration of vancomycin and thereby to confirm which values are more indicative of the trough concentration. Secondarily, we also evaluated the proportion of patients who reached cAUC24/MIC and ssAUC24/MIC ratios of 400 or higher while altering the MIC and daily dose of vancomycin by simulation.
Materials and Methods
1. Subjects and collection of blood samples
This study was reviewed and approved by the Institutional Review Board at Gangnam Severance Hospital of Yonsei University Health System in Seoul, Korea (Reg. No. 3-2011-0082). All procedures were conducted in accordance with the guidelines of the Declaration of Helsinki. All data were collected retrospectively from patients who were receiving vancomycin at a single institution during a period ranging from June of 2006 to May of 2010. We included patients who were aged 18 years or older, patients whose serum creatinine concentration was lower than 1.2 mg/dL (normal range), patients who had vancomycin concentrations considered to have reached steady state (after administering more than 3 times), and patients who were given vancomycin at a dose of 1000 mg with a 12-hour interval. Vancomycin was dispensed in a saline (100 mL) and then intravenously infused over 1 hour. After the administration was done more than 3 times, the concentration was measured. Blood samplings were done 1 hour after the completion of vancomycin infusion (peak) and just before the next infusion (trough). The concentrations of serum creatinine and serum cystatin C were also simultaneously measured. Other clinical and demographic data were collected from the medical records of the recruited patients.
Serum vancomycin concentrations were determined by fluorescence polarization immunoassay methods (Cobas Integra 800 analyzer, Roche, Mannheim, Germany). The cystatin C concentration was measured using gold colloidal colorimetry (Hitachi 7600-110, Hitachi, Japan).
2. Individual pharmacokinetic parameters of vancomycin
The individual pharmacokinetic parameters of vancomycin were derived from the CAPCIL program. The glomerular filtration rate (GFR) was estimated by serum cystatin C rather than serum creatinine concentration. The vancomycin clearance (CLvan) and volume of distribution (Vd) were estimated for each patient using the CAPCIL program.
3. Individual pharmacodynamic index of vancomycin
In each patient, the ssAUC24 was estimated based on the following formula using individual pharmacokinetic data (Equation 1). [5]
The ssAUC24 is expressed as mg · hr/L, CLvan as L/hr, and D is vancomycin dosage in mg/24 h.
Besides, the cAUC24 was obtained with the following formula using the CLcr that has been proposed by several studies (Equation 2) [3, 4, 7].
The cAUC24 is expressed as mg · hr/L, CLcr as mL/min, and D is vancomycin dosage in mg/24 h.
In Equation 2, the CLcr was calculated using the Cockcroft and Gault formula (Equation 3) [10].
(Female: multiplying by correction factor, 0.85)
The cAUC24 value was compared with the ssAUC24 according to age, body mass index (BMI), and the trough concentration of vancomycin. The correlation between the 2 AUCs (cAUC24, ssAUC24) and the steady-state trough concentration of vancomycin was evaluated because the trough concentration is an actual surrogate marker in clinical setting.
4. Assessment of the AUC24/MIC ratio
The probability (%) of reaching a target AUC24/MIC value of 400 or higher was compared between the cAUC24 and ssAUC24 for different vancomycin MICs (0.5, 1.0, and 2.0 mg/L) and different daily vancomycin doses (2000, 2500, 3000, 3500, and 4000 mg) by simulation. This simulation estimates the actual dose of vancomycin that is needed to reach a target value of 400 for the cAUC24/MIC and ssAUC24/MIC in cases in which the MIC of vancomycin is actually 2.0 mg/L.
5. Statistical analysis
A statistical analysis was performed using SPSS 20 for Windows (IBM, Armonk, NY, USA). Continuous data were presented as mean (standard deviation [SD]) and analyzed with the paired t-test if data were determined to be normally distributed or with the Wilcoxon signed-rank test for nonparametric data. The nonparametric values were expressed as median and interquartile ranges (IQR). A correlation analysis was performed using a Pearson's correlation coefficient (r). A P-value of < 0.05 was considered statistically significant.
Results
1. Clinical characteristics and pharmacokinetic parameters
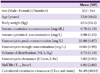
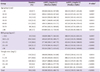
A total of 596 patients (352 men and 244 women) were included. The mean (SD) age of patients was 55.0 (16.6) years (range, 18-96) and the mean (SD) weight was 62.5 (13.3) kg. The pharmacokinetic analysis was performed using the CAPCIL program and included a total of 1192 vancomycin concentration measurements (peak and trough) in 596 patients. The mean (SD) Vd of vancomycin was 0.73 (0.19) L/Kg, the CLvan was 5.02 (1.93) L/hr, and the half-life (T1/2) was 6.92 (2.86) hours (Table 1).
2. Pharmacodynamic index
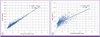
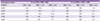
The ssAUC24 was significantly higher than the cAUC24: the median (IQR) values were 418.32 (330.35, 546.19) and 392.38 (322.63, 486.73), respectively (P < 0.0001; Table 2). Patients were also divided into subgroups based on age, BMI, and trough concentration. The cAUC24 was found to be relatively lower than the ssAUC24 in almost all subgroups. In particular, in older patients with a higher trough concentration, a higher degree of difference between the ssAUC24 and cAUC24 was observed (Table 2). The ssAUC24 showed a stronger correlation with the trough concentration than the cAUC24 (r = 0.964 and r = 0.649) (Fig. 1A, 1B).
3. Assessment of the AUC24/MIC
Assuming that the MIC of vancomycin against MRSA was 1.0 mg/L, the number of patients who reached the target cAUC24/MIC and ssAUC24/MIC values of 400 or higher was 286 of 576 (48.0%) and 322 of 576 (54.0%), respectively. In patients with a trough concentration of 10 mg/L and higher (227 patients), the percentage of those who reached the cAUC24/MIC and ssAUC24/MIC values of 400 or higher was 77.5% (n = 176) and 100%, respectively. However, among patients with a trough concentration from 5 to less than 10 mg/L, 50% and lesser achieved the target AUC24/MIC value.
4. Simulation
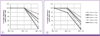
Assuming that vancomycin is administered at a daily dose of 2000, 2500, 3000, 3500, and 4000 mg and the MIC of vancomycin against MRSA is 0.5, 1.0, and 2.0 mg/L, we performed a simulation to evaluate the proportion of patients whose cAUC24/MIC and ssAUC24/MIC ratios reached the target value of 400 or higher. When the MIC of vancomycin was 2.0 mg/L, the probability (%) of reaching the target cAUC24/MIC and ssAUC24/MIC values was less than 40% in patients with a trough concentration of 10 to 15 mg/L at a daily vancomycin dose of 4000 mg. In patients with a trough concentration of 15 to 20 mg/L, the probability (%) of reaching the target ssAUC24/MIC and cAUC24/MIC values of 400 or higher was 71.8% and 57.7%, respectively, even at a daily vancomycin dose of 4000 mg (Fig. 2, Table 3).
Discussion
The appropriate assessment of renal function and the resulting adjustment of the dose are mandatory in antibiotics such as vancomycin, which are mainly excreted from the kidney. The effective therapeutic range of vancomycin has been mainly recommended to be from 5 to 10 mg/L based on the trough concentration in consideration of the effect and safety. In recent years, however, depending on the sites of infection, the concentration has been recommended to be from 10 to 15 mg/L in patients with endocarditis and from 15 to 20 mg/L in those with pneumonia or meningitis. It has also been recommended that a therapeutic range be maintained at approximately 15 to 25 mg/L for the continuous intravenous infusion [1, 2]. According to most of the recent studies, the ssAUC24/MIC ratio rather than %time > MIC has been proposed as the pharmacodynamic index indicating the clinical responses of vancomycin, and the target AUC24/MIC value is recommended to be maintained at the level of 400 or higher [3, 4]. Based on this target, several studies have been conducted to assess the validity of the treatment dose of vancomycin and to adjust it [5, 6, 9]. However, in actual clinical settings, it can be difficult to obtain multiple serum vancomycin concentrations to determine the accurate AUC24. Therefore, most of the studies have obtained the value of the cAUC24 using the formula based on the CLcr (Equation 2) [3, 4, 5, 7]. However, according to some previous studies including ours [11, 12], serum cystatin C level rather than serum creatinine level is better indicative of the renal function. Therefore, we used serum cystatin C rather than serum creatinine to estimate individual GFR in the CAPCIL program, which is one of the applications to monitor drug therapy [13, 14, 15]. Finally, it is necessary to identify a new marker that would better reflect the renal function compared with the serum creatinine level or CLcr. Cystatin C may be considered as a good candidate for a new marker in patients with a normal creatinine concentration [11, 16, 17, 18, 19]. Some authors have also noted that there is a tendency to overestimate the CLcr in elderly people or those with a smaller muscle mass [16, 17, 18, 19, 20]. Therefore, there is a possibility that the formula (Equation 2) might conversely underestimate the cAUC24 and, as a result, a higher dose of vancomycin might be recommended inappropriately.
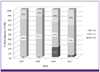
In particular, the MIC of vancomycin against MRSA has been recently observed to be gradually increasing, which has led to the opinions that vancomycin is no longer necessary [5, 9, 21]. This is not only because a higher dose of vancomycin should be administered at a daily dose of up to 5000 to 6000 mg to maintain the AUC24/MIC of 400 or higher but also because the actual administration would be difficult because of adverse effects such as nephrotoxicity in these cases. Furthermore, we also observed the MIC of vancomycin, by microbroth dilution method using Vitek 2 system (bioMerieux, Marcy 1'Etoile, France), to have gradually increased at our institution during a period from 2007 to 2010 (Fig. 3). Therefore, we attempted to assess whether the cAUC24 calculated from the CLcr was different from the ssAUC24 based on the individual pharmacokinetic parameters of vancomycin derived from a commercial software. We also attempted to investigate how much vancomycin was actually needed to reach the target AUC24 in a higher MIC by simulation. Finally, we examined which of the 2 AUCs (cAUC24 or ssAUC24) was more correlated with the trough concentration of vancomycin. The trough concentration may be used as a surrogate marker for the AUC; therefore, the analysis of the correlation between the 2 AUCs and the trough concentration is important to determine the administration dose of vancomycin.
As we expected, the cAUC24 was found to be significantly lower compared with the ssAUC24. In older patients with a higher trough concentration, there was a higher discrepancy between the 2 AUCs. This means that the CLcr could be overestimated and the serum creatinine concentration could not reliably reflect the renal function in those subgroups. Accordingly, it is possible that the doses of vancomycin suggested by several studies based on the cAUC24 were too high [5, 9]. In particular, in regard to the correlation with the trough concentration, which might vary depending on the actual renal function of patients, the ssAUC24 showed a closer relationship with the trough concentration than the cAUC24 (Fig. 1A, 1B). Some clinicians have decreased the extent of therapeutic drug monitoring of vancomycin because there is little evidence to support a relationship between serum concentrations and efficacy and toxicity [20, 22]. However, because it may be difficult to determine the accurate AUC24 in the clinical setting, trough concentration monitoring can be effectively used as a surrogate marker for the AUC.
As shown in our study, assuming that the MIC of vancomycin against MRSA was 1.0 mg/L, the number of patients who reached the target cAUC24/MIC and ssAUC24/MIC values of 400 or higher were 286 of 576 (48.0%) and 322 of 576 (54.0%), respectively. In the subgroup with a trough concentration from 5 to less than 10 mg/L (237 patients), the probability of reaching a target AUC24/MIC of 400 or higher was about 40% both for ssAUC24 and cAUC24. Therefore, it is not surprising that patients with a trough concentration of less than 10 mg/L were likely not to respond to vancomycin treatment. However, in the subgroup with a trough concentration of 10 mg/L and higher (227 patients), the percentage of patients reaching target cAUC24/MIC and ssAUC24/MIC values was 77.5% (176 of 227) and 100%, respectively. These results are quite acceptable but the daily dose of vancomycin should be increased to 2500 mg to increase the proportion of patients reaching the target cAUC24/MIC value to more than 90%. In other words, there is a possibility that a higher dose of vancomycin could be recommended inappropriately if the cAUC24 was used as the pharmacodynamic index. In a recent consensus review, it was recommended that the trough concentration should always be maintained above 10 mg/L to avoid development of resistance, and for a pathogen with a MIC of 1 mg/L, the trough concentration would have to be at least 15 mg/L to achieve the target AUC24/MIC value of 400 [23]. Using the Monte Carlo simulation, Mohr and Murray determined that the probability of achieving an AUC24/MIC of 400 or higher would be 100% with a MIC of 0.5 mg/L, 40% to 60% with a MIC of 1.0 mg/L, and 0% with a MIC of 2.0 mg/L [24]. Del Mar Fernández de Gatta Garcia et al. reported that a probability of 90% of reaching a target AUC24/MIC value of 400 with a MIC of 1 mg/L would require a daily vancomycin dose of 3 to 4 g [5, 25]. However, in the present study, if we used the ssAUC24 as the pharmacodynamic index rather than the cAUC24, a daily vancomycin dose of 2 g would be enough to reach the target value at a MIC of 1 mg/L.
However, the results were different with a MIC of 2.0 mg/L. The probability of reaching target cAUC24/MIC and ssAUC24/MIC values was 0% in the subgroup with a trough concentration from 10 to less than 15 mg/L. Even in the subgroup with a higher trough concentration from 15 to less than 20 mg/L, the probability was 0% and 3.6%, respectively. Therefore, the daily dose of vancomycin should be increased to achieve a satisfactory clinical effect with a MIC of 2.0 mg/L. The simulation showed that the probability of reaching target cAUC24/MIC and ssAUC24/MIC values in patients with a trough concentration from 10 to 15 mg/L was less than 40% even at a daily vancomycin dose of 4000 mg (Table 3). This means that the trough concentration of 10 to 15 mg/L would not be acceptable with a MIC of 2.0 mg/L. The probability of reaching target cAUC24/MIC and ssAUC24/MIC values in patients with a trough concentration of 15 to 20 mg/L was 57.7% and 71.8%, respectively, at a daily vancomycin dose of 4000 mg (Table 3). A high vancomycin dose is certainly needed to reach a target AUC24/MIC value with a MIC of 2.0 mg/L; however, a higher dose could be recommended when the cAUC24/MIC ratio was used for determining the daily dose of vancomycin.
Likewise, an extremely high dose of vancomycin can be inappropriately recommended when we use the cAUC24/MIC ratio based on the serum creatinine concentration. Instead, it would be more reasonable to monitor the trough concentration as a surrogate marker in the actual clinical setting. As shown by our study, the MIC of 1.0 mg/L or higher allows to predict that the satisfactory goals of the pharmacodynamic index may be achieved if the trough concentration is maintained at the level of 10 mg/L and higher.
Our study has several limitations. First, we could not directly confirm the correlation between the ssAUC24/MIC ratio and clinical outcome. In other words, we could not confirm whether the treatment effects clinically vary between patients with an ssAUC24/MIC value of 400 or higher and those with a cAUC24/MIC value of less than 400. In addition, we could not analyze the MICs of vancomycin against MRSA isolated from each patient. Therefore, further studies are needed to examine the correlations between the MICs of vancomycin against MRSA isolated from each patient and ssAUC24/MIC and cAUC24/MIC, and to directly confirm the clinical outcomes. Moreover, several errors that could affect the pharmacodynamic index might have occurred at each step of the therapeutic drug monitoring (TDM) process, and they could not be completely controlled because of a retrospective design of the study. It is possible that the Cockcroft and Gault method might have caused the differences between the cAUC24 and ssAUC24.
In conclusion, several studies have shown that the AUC24/MIC ratio is a pharmacodynamic index that reflects the effects of vancomycin [3, 4, 5, 6, 9]. However, a more thorough study is needed to determine the administrative dose of vancomycin based on the cAUC24/MIC based on the CLcr. Despite the above limitations, our results showed that the cAUC24 was clearly underestimated compared with the estimated ssAUC24 based on individual pharmacokinetic data. Accordingly, it should be considered that a higher dose of vancomycin could be recommended inappropriately when the cAUC24 was used. Therefore, a more accurate clinical outcome study should be performed to evaluate the appropriate dose of vancomycin. Finally, to obtain a more accurate AUC24, therapeutic monitoring of vancomycin rather than simple calculation based on the CLcr should be performed, and a more accurate biomarker of the renal function is needed.
 XML Download