

 PDF
PDF ePub
ePub Citation
 Print
Print


Abstract
Background
The actual trends in antibiotic use in Korea are difficult to determine because antibiotic usage, which is not covered by insurance or not consumed in all hospitals in Korea, cannot be calculated accurately. Therefore, this study estimated the antibiotic usage indirectly from the data available in the 'Annual Products of Medicine,' which is published by the Korean Pharmaceutical Manufacturers Association.
Materials and Methods
The data from 'Annual Products of Medicine in 2008' was analyzed. The cost and amounts of antibiotics produced were calculated and compared with previous data.
Results
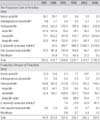
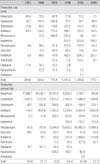
In 2008, the total cost of antibiotics was $ 1.6 billion, and the total amount was 1,140 tons. Since 1993, there has been an upward trend in the total amount of antibiotics produced. In contrast, there has been a downward trend in the proportion of antibiotics among all pharmacological agents produced. In terms of the amount, the production of cephalosporins was highest since 2003, whereas the production of penicillins was highest before 2003. The production of third and fourth generation cephalosporins is increasing, whereas that of first generation cephalosporins is decreasing gradually. Regarding the class of penicillins, the production of β-lactam/β-lactamase inhibitor combinations was the highest after 2003, whereas the production of aminopenicillin was the highest before 2003. Compared to 2003, although the amount of quinolones produced in 2008 has decreased by 52.9%, the cost increased by 41.7%. This was attributed to an increase in the production of ciprofloxacin and levofloxacin instead of older quinolones. Since 1993, aminoglycoside, tetracycline, lincosamide and chloramphenicol have been decreasing in both amount and cost. The increase in carbapenems (241.9%), antifungals (128.4%) and antiviral agents (193.2%) in 2008 is remarkable compared to that in 2003.
Figures and Tables
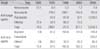
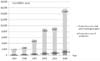 | Figure 1Changes in the Production Cost of Antibiotics from 1983 to 2008. Since 1993, there has been an upward trend in the total amount of antibiotics produced. On the other hand, there has been a downward trend in the proportion of antibiotics among all pharmacological agents produced.
|
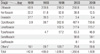
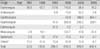
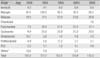
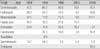
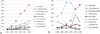 | Figure 2Trend of the Production Cost and Amount of Antibiotics. (A) Production Cost of Antibitoics, (B) Production Amount of Antibiotics. The production of cephalosporins and carbapenems has been increasing steadily whereas that of aminoglycoside, tetracycline, lincosamide and chlorampheniciol has been decreasing in both amount and cost. In 2008, the production of cephalosporins comprised the highest proportion.
|
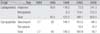
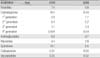
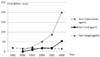 | Figure 3Production Cost of Anti-tuberculosis, Anti-viral and Anti-fungal agents. Production cost of antifungals and antiviral agents in 2008 is remarkably higher than that in 2003.
|
References
1. The Korean Society of Infectious Diseases. The guide of antibiotics use. 2008. 3rd ed. Seoul: MIP.
2. Song JH. Antimicrobial resistance in gram-positive cocci: past 50 years, present and future. Infect Chemother. 2011. 43:443–449.

3. Lee K. Trend of bacterial resistance for the past 50 years in Korea and future perspectives – gram-negative bacteria. Infect Chemother. 2011. 43:458–467.
4. Göttig S, Pfeifer Y, Wichelhaus TA, Zacharowski K, Bingold T, Averhoff B, Brandt C, Kempf VA. Global spread of New Delhi metallo-β-lactamase 1. Lancet Infect Dis. 2010. 10:828–829.
5. Poirel L, Hombrouck-Alet C, Freneaux C, Bernabeu S, Nordmann P. Global spread of New Delhi metallo-β-lactamase 1. Lancet Infect Dis. 2010. 10:832.
6. Korea Pharmaceutical Manufacturers Association. Annual products of medicine. 2008. Seoul: KPMA.
7. Kang MW, Chung HY. Trends of antimicrobial drug usage in Korea. Korean J Infect Dis. 1982. 14:31–35.
8. Kang MW, Chung HY. Trends of antibiotic usage in Korea. Korean J Infect Dis. 1989. 21:257–263.
9. Kim YJ, Yoon CH, Baek KH, KIM YR, Yoo JH, Shin WS, Kang MW. The trend of antibiotics usage in Korea (II). Korean J Infect Dis. 1995. 13:43–55.
10. Kim SI, Park JM, Wie SH, Kim YR, Kang MW. The trend of antibiotics usage in Korea during 1981-1998. Korean J Infect Dis. 2000. 32:439–447.
11. KIM YJ, Lee SH, Kang YN, KIM WC, KIM SI, Wie SH, Kim YR, Kang MW. The trend of antibiotic production in Korea during 1981-2003. Infect Chemother. 2005. 37:271–279.
12. WHO. WHO collaborating Center for Drug Statistics Methodology. Accessed 1 November 2011. Available at: http://www.whocc.no/atc_ddd_index/.
13. Lee K, Lee MA, Lee CH, Lee J, Roh KH, Kim S, Kim JJ, Koh E, Yong D, Chong Y. KONSAR Group. Increase of ceftazidime- and fluoroquinolone-resistant Klebsiella pneumoniae and imipenem-resistant Acinetobacter spp. in Korea: analysis of KONSAR study data from 2005 and 2007. Yonsei Med J. 2010. 51:901–911.
14. KIMS. KIMSonline. Accessed 1 July 2011. Available at: http://www.kimsonline.co.kr/001_Detail/DrugDetailSearch.aspx?idx=aa.
15. Lee S, Lee K, Kang Y, Bae S. Prevalence of serotype and multidrugresistance of Streptococcus pneumoniae respiratory tract isolates in 265 adults and 36 children in Korea, 2002-2005. Microb Drug Resist. 2010. 16:135–142.
16. Kim SI, Kang MW. Current usage and prospect of new anti-fungal agents in Korea. Infect Chemother. 2010. 42:209–215.
17. Lee EK, Jang SM. Analysis of antibiotic consumption using the DDD(the defined daily dose) methodology and antibiotic expenditure. J Korean Soc Clin Pharmacol Ther. 2000. 8:28–43.
 XML Download