

 PDF
PDF ePub
ePub Citation
 Print
Print


Abstract
Background
Legionella pneumophila is the causative agent of Legionnaires' disease, a severe form of pneumonia. After L. pneumophila is inhaled through contaminated aerosols, it is phagocytized by alveolar macrophages, multiplies in a specialized phagosome approximately 10 h postinfection, and eventually leads to the death of host cells. Currently available diagnostic tests for Legionella pneumonia have some limitations. This study was conducted to find diagnostic biomarkers for Legionella pneumonia using virulence gene expression profiling in a murine experimental model.
Materials and Methods
A/J mice were intranasally inoculated with L. pneumophila serogroup 1, and lungs were harvested 4, 8, 24, and 48 h postinfection. The strain grown in buffered yeast extract broth was used as reference samples. Cy-dye labeled cDNA samples were prepared with total RNA from lungs or broth culture, and hybridized on the oligo-microarray slide containing 2,895 genes of L. pneumophila serogroup 1. Virulence gene expression patterns were analyzed using a MIDAS software from TIGR (www.tigr.org).
Results
Among a total of 332 virulence genes examined, 17 genes including sidA, lepB, the genes related to flagella assembly (fliR and fliP), LPS lipid A biosynthesis, and the enhanced entry protein EnhA were up-regulated at all four time points. We further confirmed by quantitative real-time reverse transcription PCR that the expression of fliP gene was highly expressed in lung tissue as well as in bronchoalveolar lavage fluids from the mouse infected with L. pneumophila serogroup 1.
Figures and Tables
Figure 1
Growth kinetics of Legionella pneumophila strain in lung tissue of A/J mouse and the number of genes with measurable expression by cDNA microarray analysis according to the postinfection time points. Total number of Legionella bacteria recovered from the lung was expressed as colony-forming units (cfu/lung). Number of gene analyzed was expressed as percentage of total number of genes examined.
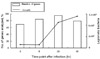
Figure 2
Venn diagram showing number of virulence genes of Legionella pneumophila serogroup 1 expressed at postinfection 8, 24, 48 hr time points. Each of the 90, 87, and 86 genes were analyzed using microarray at 8, 24, 48 hrs after infection, respectively. Thirty-four genes were analyzed at all 3 time points.
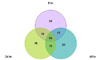
Figure 3
Expression profiles of the highly up-regulated virulence genes of L. pneumophila serogroup 1 at postinfection 4, 8, 24 and 48 hr time points by using TIGR-MeV software. A total of 17 virulence genes were up-regulated at all time points. Each of the proteins was categorized according to the square with certain color, which presents the function of the protein.
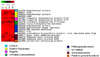
Figure 4
Validation of microarray results on the fliP expression. The fliP gene expression profiles of microarray analysis and a quantitative real-time RT-PCR assay at postinfection 4 time points were compared. Microarray data was considered to be valid if the fold change calculated by the qRT-PCR was in the same direction as determined by microarray results.
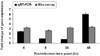
Figure 5
Expression profiles of the highly down-regulated virulence genes of L. pneumophila serogroup 1 at postinfection 4, 8, 24 and 48 h time points by using TIGR-MeV software. A total of 18 virulence genes were down-regulated at all time points. Each of the squares having colors represents was categorized according to the functions of proteins. Each of the proteins was categorized according to the square with certain color, which presents function of the protein.
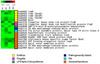
Figure 6
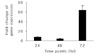
Gene expression of the fliP gene in BAL fluids collected from A/J mice at 24, 48, 72 hr after infection with Legionella pneumophila serogroup 1. Bars represent 2-△△Ct values of the fliP in BAL fluids at each postinfection time point and the 2-△△Ct Ct value using △△Ct confers the level of the fliP gene expression. The fold change was the highest value at postinfection 72 hr time point.
References
1. Diederen BM. Legionella spp. and Legionnaires' disease. J Infect. 2008. 56:1–12.
2. Steinert M, Heuner K, Buchrieser C, Albert-Weissenberger C, Glöckner G. Legionella pathogenicity: genome structure, regulatory networks and the host cell response. Int J Med Microbiol. 2007. 297:577–587.

3. Logan J, Edwards K, Saunders N. Real-time PCR: current technology and applications. 2009. 1st ed. London: Caister Academic Press;176.
4. Ilyin SE, Belkowski SM, Plata-Salamán CR. Biomarker discovery and validation: technologies and integrative approaches. Trends Biotechnol. 2004. 22:411–416.
5. Brieland J, Freeman P, Kunkel R, Chrisp C, Hurley M, Fantone J, Engleberg C. Replicative Legionella pneumophila lung infection in intratracheally inoculated A/J mice. A murine model of human Legionnaires' disease. Am J Pathol. 1994. 145:1537–1546.
6. Livak KJ, Schmittgen TD. Analysis of relative gene expression data using real-time quantitative PCR and the 2(-Delta Delta C(T)). Methods. 2001. 25(4):402–408.
7. Aoki S, Hirakata Y, Miyazaki Y, Izumikawa K, Yanagihara K, Tomono K, Yamada Y, Tashiro T, Kohno S, Kamihira S. Detection of Legionella DNA by PCR of whole-blood samples in a mouse model. J Med Microbiol. 2003. 52:325–329.
8. Brüggemann H, Cazalet C, Buchrieser C. Adaptation of Legionella pneumophila to the host environment: role of protein secretion, effectors and eukaryotic-like proteins. Curr Opin Microbiol. 2006. 9:86–94.
9. Segal G, Feldman M, Zusman T. The Icm/Dot type-IV secretion systems of Legionella pneumophila and Coxiella burnetii. FEMS Microbiol. 2005. 29:65–81.
10. De Buck E, Anné J, Lammertyn E. The role of protein secretion systems in the virulence of the intracellular pathogen Legionella pneumophila. Microbiology. 2007. 153:3948–3953.
11. Bachman MA, Swanson MS. The LetE protein enhances expression of multiple LetA/LetS-dependent transmission traits by Legionella pneumophila. Infect Immun. 2004. 72:3284–3293.
12. Brassinga AK, Hiltz MF, Sisson GR, Morash MG, Hill N, Garduno E, Edelstein PH, Garduno RA, Hoffman PS. A 65-kilobase pathogenicity island is unique to Philadelphia-1 strains of Legionella pneumophila. J Bacteriol. 2003. 185:4630–4637.
13. Brüggemann H, Hagman A, Jules M, Sismeiro O, Dillies MA, Gouyette C, Kunst F, Steinert M, Heuner K, Coppée JY, Buchrieser C. Virulence strategies for infecting phagocytes deduced from the in vivo transcriptional program of Legionella pneumophila. Cell Microbiol. 2006. 8:1228–1240.
14. Shin S, Roy CR. Host cell processes that influence the intracellular survival of Legionella pneumophila. Cell Microbiol. 2008. 10:1209–1220.
 XML Download