

 PDF
PDF ePub
ePub Citation
 Print
Print


Abstract
Purpose
The purpose of this study was to investigate screw joint stability and sagittal fit between internal connection implant fixtures of two different manufacturers and customized abutments.
Materials and methods
Internal connection implant systems from two different manufacturers (Biomet 3i system, Astra Tech system) were selected for this study (n=24 for each implant system, total n=48). For 3i implant system, half of the implants were connected with Ti ready-made abutments and the other half implants were connected with Ti CAD-CAM custom ones of domestic-make (Myplant, Raphabio Co., Seoul, Korea) and were classified into Group 1 and Group 2 respectively. Astra implants were divided into Group 3 and Group 4 in the same way. Micro-CT sagittal imaging was performed for fit analysis of interfaces and preloading reverse torque values (RTV) were measured.
Results
In the contact length of fixture-abutment interface, there were no significant differences not only between Group 1 and Group 2 but also between Group 3 and Group 4 (Mann-Whitney test, P>.05). However, Group 2 and Group 4 showed higher contact length significantly than Group 1 and Group 3 in abutment-screw interface as well as fixture-screw one (Mann-Whitney test, P<.05). In addition, RTV was lower in CAD-CAM custom abutments compared to ready-made ones (Student t-test, P<.05).
Conclusion
It is considered that domestically manufactured CAD-CAM custom abutments have similar fit at the fixture abutment interface and it could be used clinically. However, RTV of CAD-CAM custom abutments should be improved for the increase of clinical application. (J Korean Acad Prosthodont 2016;54:370-8)
Go to : 
REFERENCES
1.Sumi T., Braian M., Shimada A., Shibata N., Takeshita K., Vandeweghe S., Coelho PG., Wennerberg A., Jimbo R. Characteristics of implant-CAD/CAM abutment connections of two different internal connection systems. J Oral Rehabil. 2012. 39:391–8.

2.Lang LA., Sierraalta M., Hoffensperger M., Wang RF. Evaluation of the precision of fit between the Procera custom abutment and various implant systems. Int J Oral Maxillofac Implants. 2003. 18:652–8.
3.Bichacho N. Achieving optimal gingival esthetics around restored natural teeth and implants. Rationale, concepts, and techniques. Dent Clin North Am. 1998. 42:763–80.
4.Kim HS. Fabrication of custom abutment using dental CAD/CAM system. J Korean Dent Assoc. 2012. 50:118–25.
5.Lewis SG., Llamas D., Avera S. The UCLA abutment: a four-year review. J Prosthet Dent. 1992. 67:509–15.
6.Wu T., Liao W., Dai N., Tang C. Design of a custom angled abutment for dental implants using computer-aided design and nonlinear finite element analysis. J Biomech. 2010. 43:1941–6.
7.Sailer I., Zembic A., Jung RE., Siegenthaler D., Holderegger C., Hämmerle CH. Randomized controlled clinical trial of customized zirconia and titanium implant abutments for canine and posterior single-tooth implant reconstructions: preliminary results at 1 year of function. Clin Oral Implants Res. 2009. 20:219–25.
8.Kerstein RB., Castellucci F., Osorio J. Ideal gingival form with computer-generated permanent healing abutments. Compend Contin Educ Dent. 2000. 21:793–7.
9.Priest G. Virtual-designed and computer-milled implant abutments. J Oral Maxillofac Surg. 2005. 63:22–32.
10.Martin WC., Woody RD., Miller BH., Miller AW. Implant abutment screw rotations and preloads for four different screw materials and surfaces. J Prosthet Dent. 2001. 86:24–32.
11.Boggan RS., Strong JT., Misch CE., Bidez MW. Influence of hex geometry and prosthetic table width on static and fatigue strength of dental implants. J Prosthet Dent. 1999. 82:436–40.
12.Abrahamsson I., Berglundh T., Lindhe J. Soft tissue response to plaque formation at different implant systems. A comparative study in the dog. Clin Oral Implants Res. 1998. 9:73–9.
13.Quirynen M., Bollen CM., Eyssen H., van Steenberghe D. Microbial penetration along the implant components of the Brånemark system. An in vitro study. Clin Oral Implants Res. 1994. 5:239–44.
14.Henriksson K., Jemt T. Evaluation of custom-made procera ceramic abutments for single-implant tooth replacement: a prospective 1-year follow-up study. Int J Prosthodont. 2003. 16:626–30.
15.Canullo L. Clinical outcome study of customized zirconia abutments for single-implant restorations. Int J Prosthodont. 2007. 20:489–93.
16.Swain MV., Xue J. State of the art of Micro-CT applications in dental research. Int J Oral Sci. 2009. 1:177–88.
17.Pelekanos S., Koumanou M., Koutayas SO., Zinelis S., Eliades G. Micro-CT evaluation of the marginal fit of different In-Ceram alumina copings. Eur J Esthet Dent. 2009. 4:278–92.
18.Suomalainen AK., Salo A., Robinson S., Peltola JS. The 3DX multi image micro-CT device in clinical dental practice. Dentomaxillofac Radiol. 2007. 36:80–5.
19.Siamos G., Winkler S., Boberick KG. Relationship between implant preload and screw loosening on implant-supported prostheses. J Oral Implantol. 2002. 28:67–73.
20.Kim JW., Heo YR., Kim HJ., Chung CH. A comparative study on the fit and screw joint stability of ready-made abutment and CAD-CAM custom-made abutment. J Korean Acad Prosthodont. 2013. 51:276–83.
21.Kim NH., Chung CH., Son MK., Back DH. A study on the fit of the fixture-abutment-screw interface. J Korean Acad Prosthodont. 2003. 41:503–18.
22.Jung SH., Ma JS., Chung CH. A comparative study on the fit in prostheses using premade gold cylinder and plastic cylinder. J Korean Acad Prosthodont. 1999. 37:825–34.
23.Lee HT., Chung CH. Fit of fixture/abutment interface of internal connection implant systems. J Korean Acad Prosthodont. 2004. 42:192–209.
24.de Morais Alves da Cunha T., de Arau′jo RP., da Rocha PV., Amoedo RM. Comparison of fit accuracy between Procera® custom abutments and three implant systems. Clin Implant Dent Relat Res. 2012. 14:890–5.
25.Binon PP. Evaluation of machining accuracy and consistency of selected implants, standard abutments, and laboratory analogs. Int J Prosthodont. 1995. 8:162–78.
26.Jang HS., Kim HJ., Chung CH. Detorque force and surface change of coated abutment screw after repeated closing and opening. J Korean Acad Prosthodont. 2008. 46:500–10.
27.Yeo IS., Lee JH., Kang TJ., Lee SY. The effect of abutment screw length on screw loosening in dental implants with external abutment connections after thermocycling. Int J Oral Maxillofac Implants. 2014. 29:59–62.
28.Lee JR., Lee DH., Hwang JW., Choi JH. Detorque values of abutment screws in a multiple implant-supported prosthesis. J Korean Acad Prosthodont. 2010. 48:280–6.
29.Lee CJ., Yang SE., Kim SG. Evaluation of reverse torque value of abutment screws on CAD/CAM custom-made implant abutments. J Korean Acad Prosthodont. 2012. 50:122–8.
30.Haack JE., Sakaguchi RL., Sun T., Coffey JP. Elongation and preload stress in dental implant abutment screws. Int J Oral Maxillofac Implants. 1995. 10:529–36.
Go to :
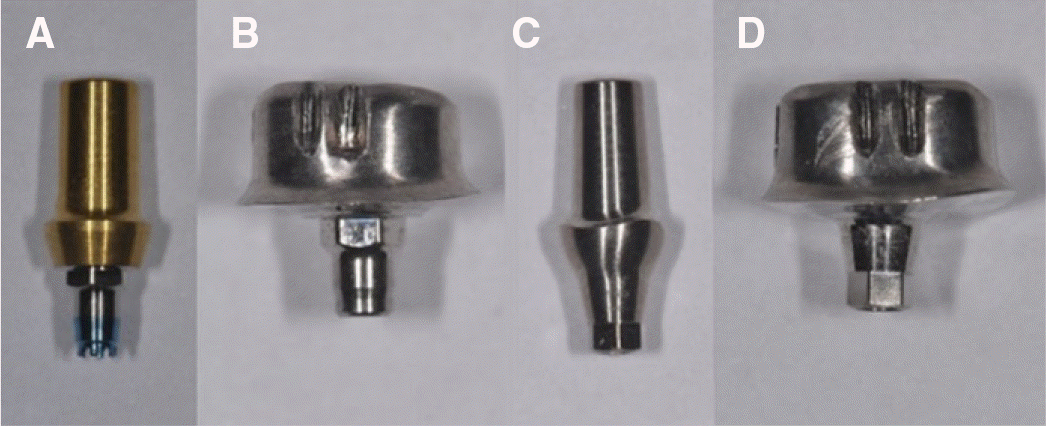 | Fig. 1.Implant abutments used in this study. (A) GingiHue Post, (B) Raphabio custom-made abutment for 3i system, (C) TiDesign, (D) Raphabio custom-made abutment for Astra system. |
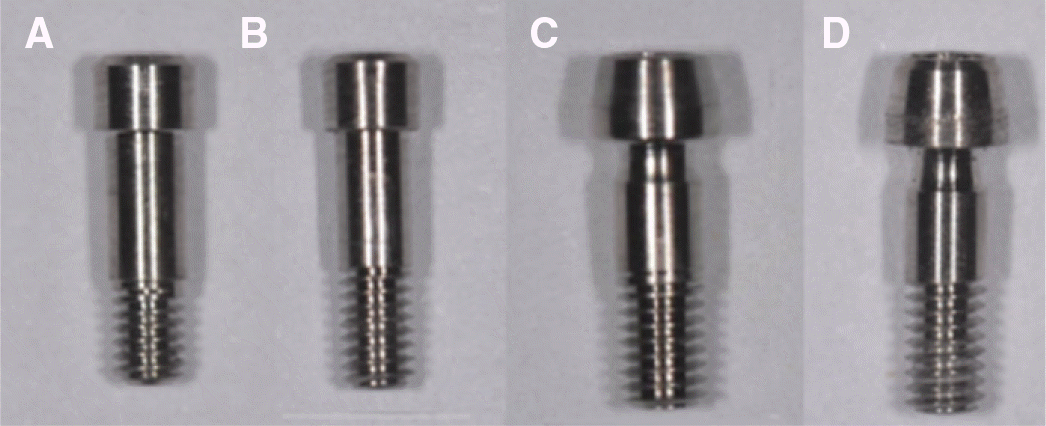 | Fig. 2.Abutment screw used in this study. (A) Biomet 3i screw, (B) Raphabio custom-made screw for 3i system, (C) Astra ready-made screw, (D) Raphabio custom-made screw for Astra system. |
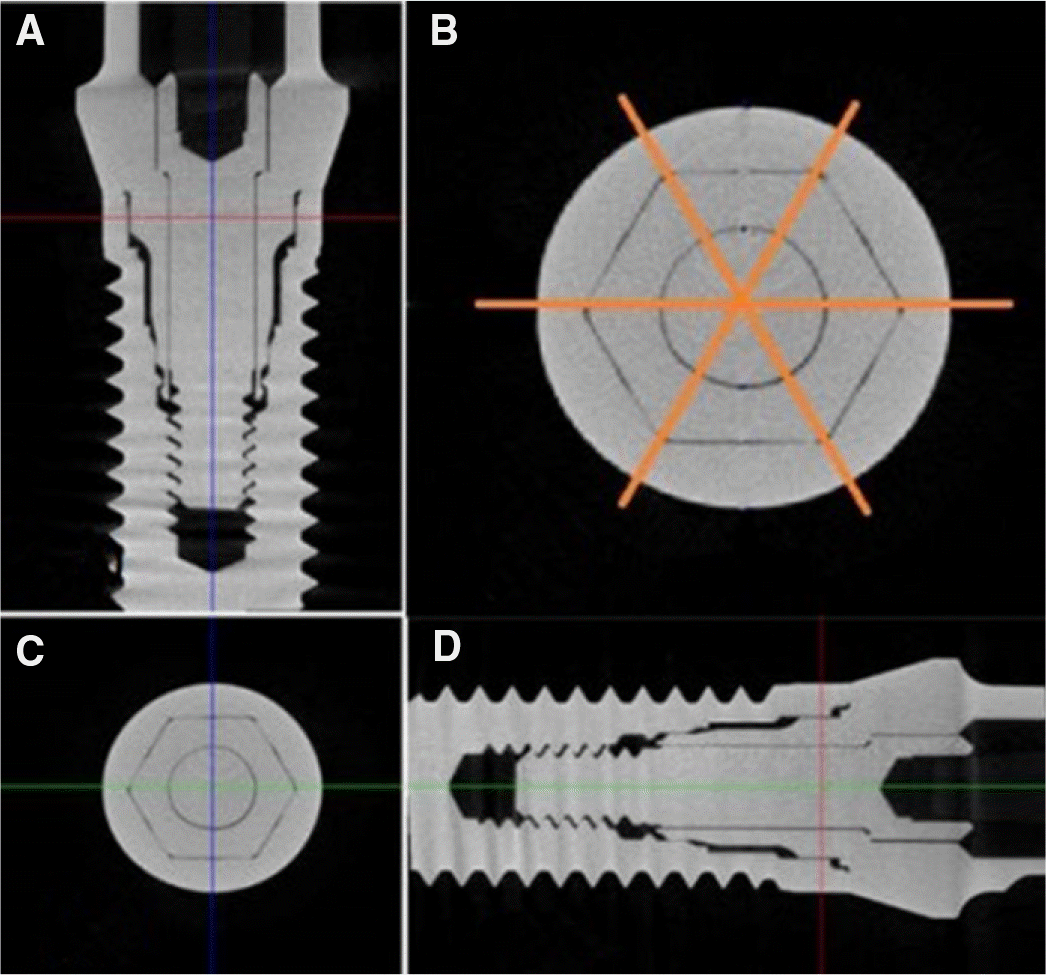 | Fig. 3.Sectioned images using micro-CT in this study. (A) coronal section of Implant-Abutment Complex (IAC), (B) three sectioned planes for fit analysis, (C) transverse section of IAC, (D) sagittal section of IAC. |
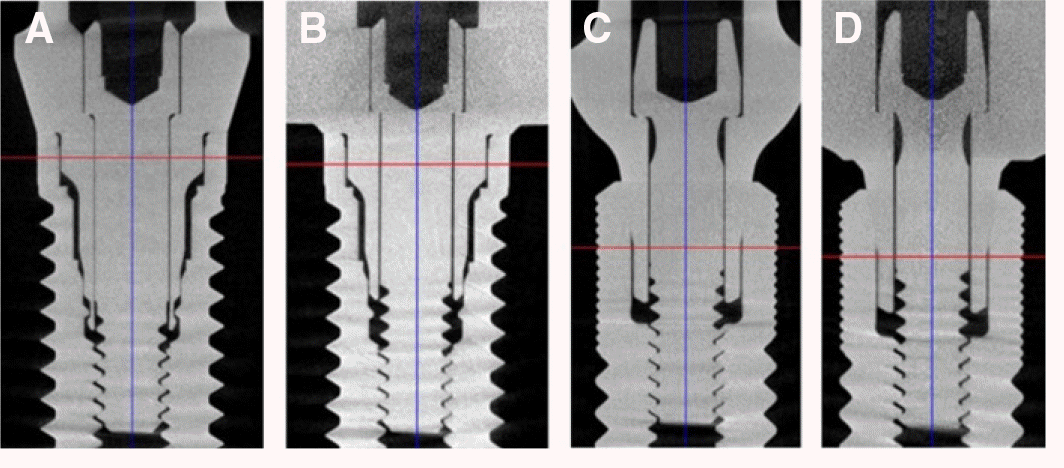 | Fig. 4.Sagittal/coronal section in each Group. (A) Group 1, (B) Group 2, (C) Group 3, (D) Group 4, Group 1 and Group 2: 3i system, Group 3 and Group 4: Astra system. |
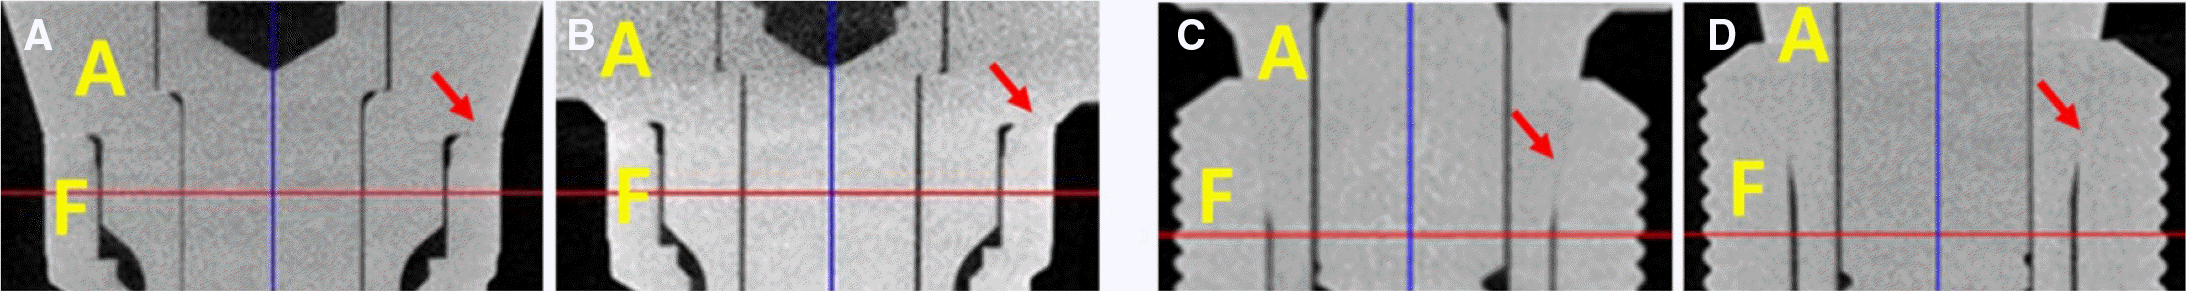 | Fig. 5.Micro-CT images of fixture-abutment interface. (A) Group 1, (B) Group 2, (C) Group 3, (D) Group 4. A: abutment, F: fixture. Red arrow indicates contact between fixture and abutment. |
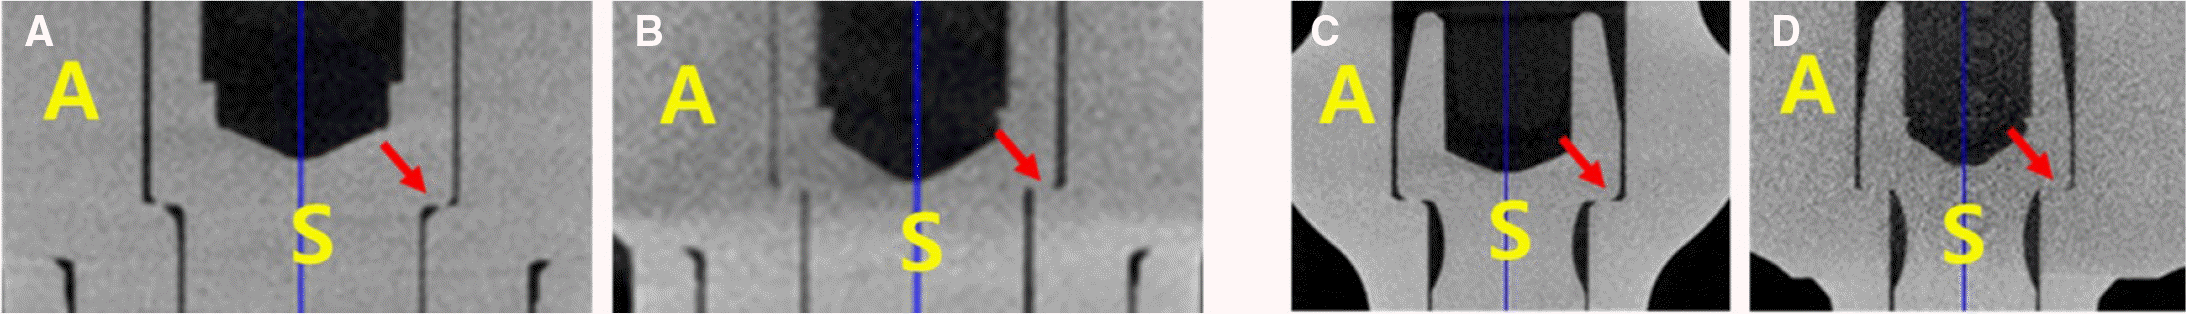 | Fig. 6.Micro-CT images of abutment-screw interface. (A) Group 1, (B) Group 2, (C) Group 3, (D) Group 4. A: abutment, S: abutment screw. Red arrow indicates contact between screw and abutment. |
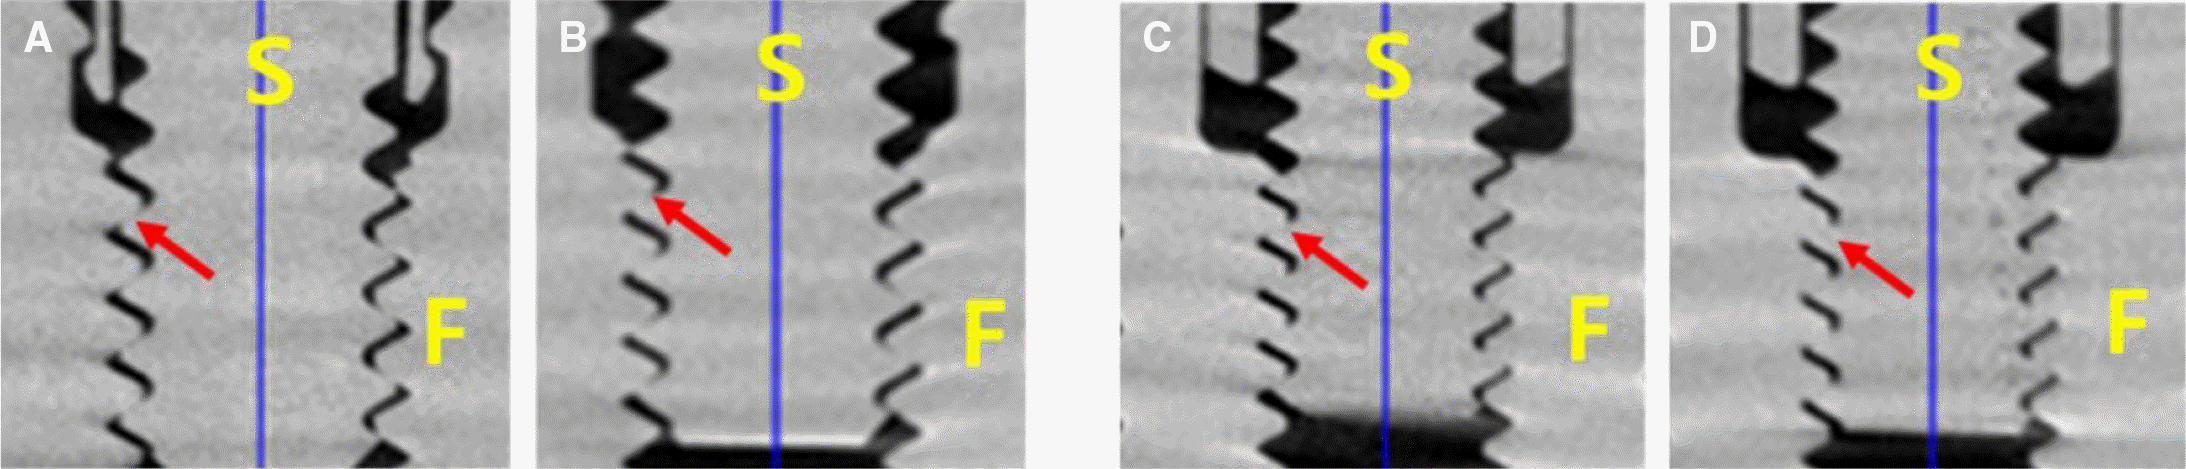 | Fig. 7.Micro-CT images of fixture-screw interface. (A) Group 1, (B) Group 2, (C) Group 3, (D) Group 4. F: fixture, S: abutment screw. Red arrow indicates contact between fixture and screw. |
Table 1.
Classification of tested groups in this study (n = Number of sample)
Table 2.
Contact length on interfaces in Group 1 and Group 2 (Biomet 3i system) and statistical analysis for contact length by Mann-Whitney test
Table 3.
Contact length on interfaces in Group 3 and Group 4 (Astra system) and statistical analysis for contact length by Mann-Whitney test
 XML Download