

 PDF
PDF ePub
ePub Citation
 Print
Print


Abstract
Purpose
This study aims to investigate if 2D analysis method is applicable to analysis of CBCT by comparing measuring points of CBCT with those of Adjusted 2D Lateral Cephalogram (Adj-Ceph) with magnification adjusted to 100% and finding out at which landmarks the difference in position appear.
Materials and methods
CBCT data and Adj-Ceph (100% magnification) data from 50 adult patients have been extracted as research objects, and the horizontal (Y axis) and vertical (Z axis) coordinates of landmarks were compared. Landmarks have been categorized into 4 groups by the position and whether they are bilaterally overlapped. Paired t-test was used to compare differences between Adj-Ceph and CBCT.
Results
Significant difference was found at 11 landmarks including Group B (S, Ar, Ba, PNS), Group C (Po, Or, Hinge axis, Go) and Group D (U1RP, U6CP, L6CP) in the horizontal (Y) axis while all the landmarks in vertical (Z) axis showed significant difference (P<.05). As a result of landmark difference analysis, a meaningful difference with more than 1 mm at 13 landmarks were indentifed in the horizontal axis. In the vertical axis, significant difference over 1 mm was detected from every landmark except Sella.
Go to : 
REFERENCES
1. Broadbent BH. A new x-ray technique and its application to or-thodontia. Angle Orthod. 1981; 51:93–114.
2. Broadbent BH. The face of the normal child. Angle Orthod. 1937; 7:183–208.
3. Brodie AG. On the growth pattern of the human head. From the third month to the eighth year of life. Am J Anat. 1941; 68:209–62.

4. Salzmann JA. The face in profile: an anthropological x-ray investigation on Swedish children and conscripts by Arne Bjo¨rk. Am J Orthod. 1948; 34:691–9.
5. Downs WB. Variations in facial relationships; their significance in treatment and prognosis. Am J Orthod. 1948; 34:812–40.
6. Steiner CC. Cephalometrics for you and me. Am J Orthod. 1953; 39:729–55.
7. Sassouni V. A roentgenographic cephalometric analysis of cephalo-facio-dental relationships. Am J Orthod. 1955; 41:735–64.
8. Tweed CH. Was the development of the diagnostic facial triangle as an accurate analysis based on fact or fancy? Am J Orthod. 1962; 48:823–40.
9. Harvold EP. The role of function in the etiology and treatment of malocclusion. Am J Orthod. 1968; 54:883–98.
10. Jacobson A. Application of the "Wits" appraisal. Am J Orthod. 1976; 70:179–89.
11. Jacobson A. The "Wits" appraisal of jaw disharmony. Am J Orthod. 1975; 67:125–38.
12. Burstone CJ, James RB, Legan H, Murphy GA, Norton LA. Cephalometrics for orthognathic surgery. J Oral Surg. 1978; 36:269–77.
13. Ricketts RM. Perspectives in the clinical application of cephalometrics. The first fifty years. Angle Orthod. 1981; 51:115–50.
14. McNamara JA Jr. A method of cephalometric evaluation. Am J Orthod. 1984; 86:449–69.
15. Yen PKJ. Identification Of Landmarks In Cephalometric Radiographs. Angle Orthod. 1960; 30:35–41.
16. Marshall D. Interpretation of the posteroanterior skull radi-ograph-assembly of disarticulated bones. Dent Radiogr Photogr. 1969; 42:27–35.
17. Baumrind S, Frantz RC. The reliability of head film measurements.1. Landmark identification. Am J Orthod. 1971; 60:111–27.
18. Midtga�rd J, Bjo¨rk G, Linder-Aronson S. Reproducibility of cephalometric landmarks and errors of measurements of cephalometric cranial distances. Angle Orthod. 1974; 44:56–61.
19. Cho HJ. A three-dimensional cephalometric analysis. J Clin Orthod. 2009; 43:235–52.
20. Grayson BH, McCarthy JG, Bookstein F. Analysis of craniofacial asymmetry by multiplane cephalometry. Am J Orthod. 1983; 84:217–24.
21. Baumrind S, Moffitt FH, Curry S. Three-dimensional x-ray stereometry from paired coplanar images: a progress report. Am J Orthod. 1983; 84:292–312.
22. Kusnoto B, Evans CA, BeGole EA, de Rijk W. Assessment of 3-dimensional computer-generated cephalometric measurements. Am J Orthod Dentofacial Orthop. 1999; 116:390–9.
23. Dale AM, Robert AD. A Clinician's Guide to Understanding Cone Beam Volumetric Imaging (CBVI). 2007. [cited 2012 December 20]. Available from:. http://www.Ineedce.com/courses/1413/PDF/A_Clin_Gde_ConeBeam.pdf.
24. Cavalcanti MG, Vannier MW. Quantitative analysis of spiral computed tomography for craniofacial clinical applications. Dentomaxillofac Radiol. 1998; 27:344–50.
25. Matteson SR, Bechtold W, Phillips C, Staab EV. A method for three-dimensional image reformation for quantitative cephalometric analysis. J Oral Maxillofac Surg. 1989; 47:1053–61.
26. Christiansen EL, Thompson JR, Kopp S. Intra- and inter-observer variability and accuracy in the determination of linear and angular measurements in computed tomography. An in vitro and in situ study of human mandibles. Acta Odontol Scand. 1986; 44:221–9.
27. Hildebolt CF, Vannier MW, Knapp RH. Validation study of skull three-dimensional computerized tomography measurements. Am J Phys Anthropol. 1990; 82:283–94.
28. Lascala CA, Panella J, Marques MM. Analysis of the accuracy of linear measurements obtained by cone beam computed tomography (CBCT-NewTom). Dentomaxillofac Radiol. 2004; 33:291–4.
29. Schlicher W, Nielsen I, Huang JC, Maki K, Hatcher DC, Miller AJ. Consistency and precision of landmark identification in three-dimensional cone beam computed tomography scans. Eur J Orthod. 2012; 34:263–75.
30. Grauer D, Cevidanes LS, Styner MA, Heulfe I, Harmon ET, Zhu H, Proffit WR. Accuracy and landmark error calculation using cone-beam computed tomography-generated cephalograms. Angle Orthod. 2010; 80:286–94.
31. Park JW, Kim NK, Chang YI. Comparison of landmark position between conventional cephalometric radiography and CT scans projected to midsagittal plane. Korean J Orthod. 2008; 38:427–36.
32. Kumar V, Ludlow JB, Mol A, Cevidanes L. Comparison of conventional and cone beam CT synthesized cephalograms. Dentomaxillofac Radiol. 2007; 36:263–9.
33. Kumar V, Ludlow J, Soares Cevidanes LH, Mol A. In vivo comparison of conventional and cone beam CT synthesized cephalograms. Angle Orthod. 2008; 78:873–9.
34. Terajima M, Yanagita N, Ozeki K, Hoshino Y, Mori N, Goto TK, Tokumori K, Aoki Y, Nakasima A. Three-dimensional analysis system for orthognathic surgery patients with jaw deformities. Am J Orthod Dentofacial Orthop. 2008; 134:100–11.
35. Terajima M, Endo M, Aoki Y, Yuuda K, Hayasaki H, Goto TK, Tokumori K, Nakasima A. Four-dimensional analysis of stom-atognathic function. Am J Orthod Dentofacial Orthop. 2008; 134:276–87.
36. Suri S, Utreja A, Khandelwal N, Mago SK. Craniofacial computerized tomography analysis of the midface of patients with re-paired complete unilateral cleft lip and palate. Am J Orthod Dentofacial Orthop. 2008; 134:418–29.
37. Kau CH, Richmond S. Three-dimensional analysis of facial morphology surface changes in untreated children from 12 to 14 years of age. Am J Orthod Dentofacial Orthop. 2008; 134:751–60.
38. Garrett BJ, Caruso JM, Rungcharassaeng K, Farrage JR, Kim JS, Taylor GD. Skeletal effects to the maxilla after rapid maxillary expansion assessed with cone-beam computed tomography. Am J Orthod Dentofacial Orthop. 2008; 134:8–9.
39. Phatouros A, Goonewardene MS. Morphologic changes of the palate after rapid maxillary expansion: a 3-dimensional computed tomography evaluation. Am J Orthod Dentofacial Orthop. 2008; 134:117–24.
40. Ballanti F, Lione R, Fanucci E, Franchi L, Baccetti T, Cozza P. Immediate and post-retention effects of rapid maxillary expansion investigated by computed tomography in growing patients. Angle Orthod. 2009; 79:24–9.
41. Kragskov J, Bosch C, Gyldensted C, Sindet-Pedersen S. Comparison of the reliability of craniofacial anatomic landmarks based on cephalometric radiographs and three-dimensional CT scans. Cleft Palate Craniofac J. 1997; 34:111–6.
42. Landis JR, Koch GG. The measurement of observer agree-ment for categorical data. Biometrics. 1977; 33:159–74.
43. Kim JY, Lee DK, Lee SH. Comparison of the observer reliability of cranial anatomic landmarks based on cephalometric radiograph and three-dimensional computed tomography scans. J Korean Assoc Oral Maxillofac Surg. 2010; 36:262–9.
44. van Vlijmen OJ, Maal TJ, Berge′ SJ, Bronkhorst EM, Katsaros C, Kuijpers-Jagtman AM. A comparison between two-dimensional and three-dimensional cephalometry on frontal radiographs and on cone beam computed tomography scans of human skulls. Eur J Oral Sci. 2009; 117:300–5.
45. Adams GL, Gansky SA, Miller AJ, Harrell WE Jr, Hatcher DC. Comparison between traditional 2-dimensional cephalometry and a 3-dimensional approach on human dry skulls. Am J Orthod Dentofacial Orthop. 2004; 126:397–409.
Go to :
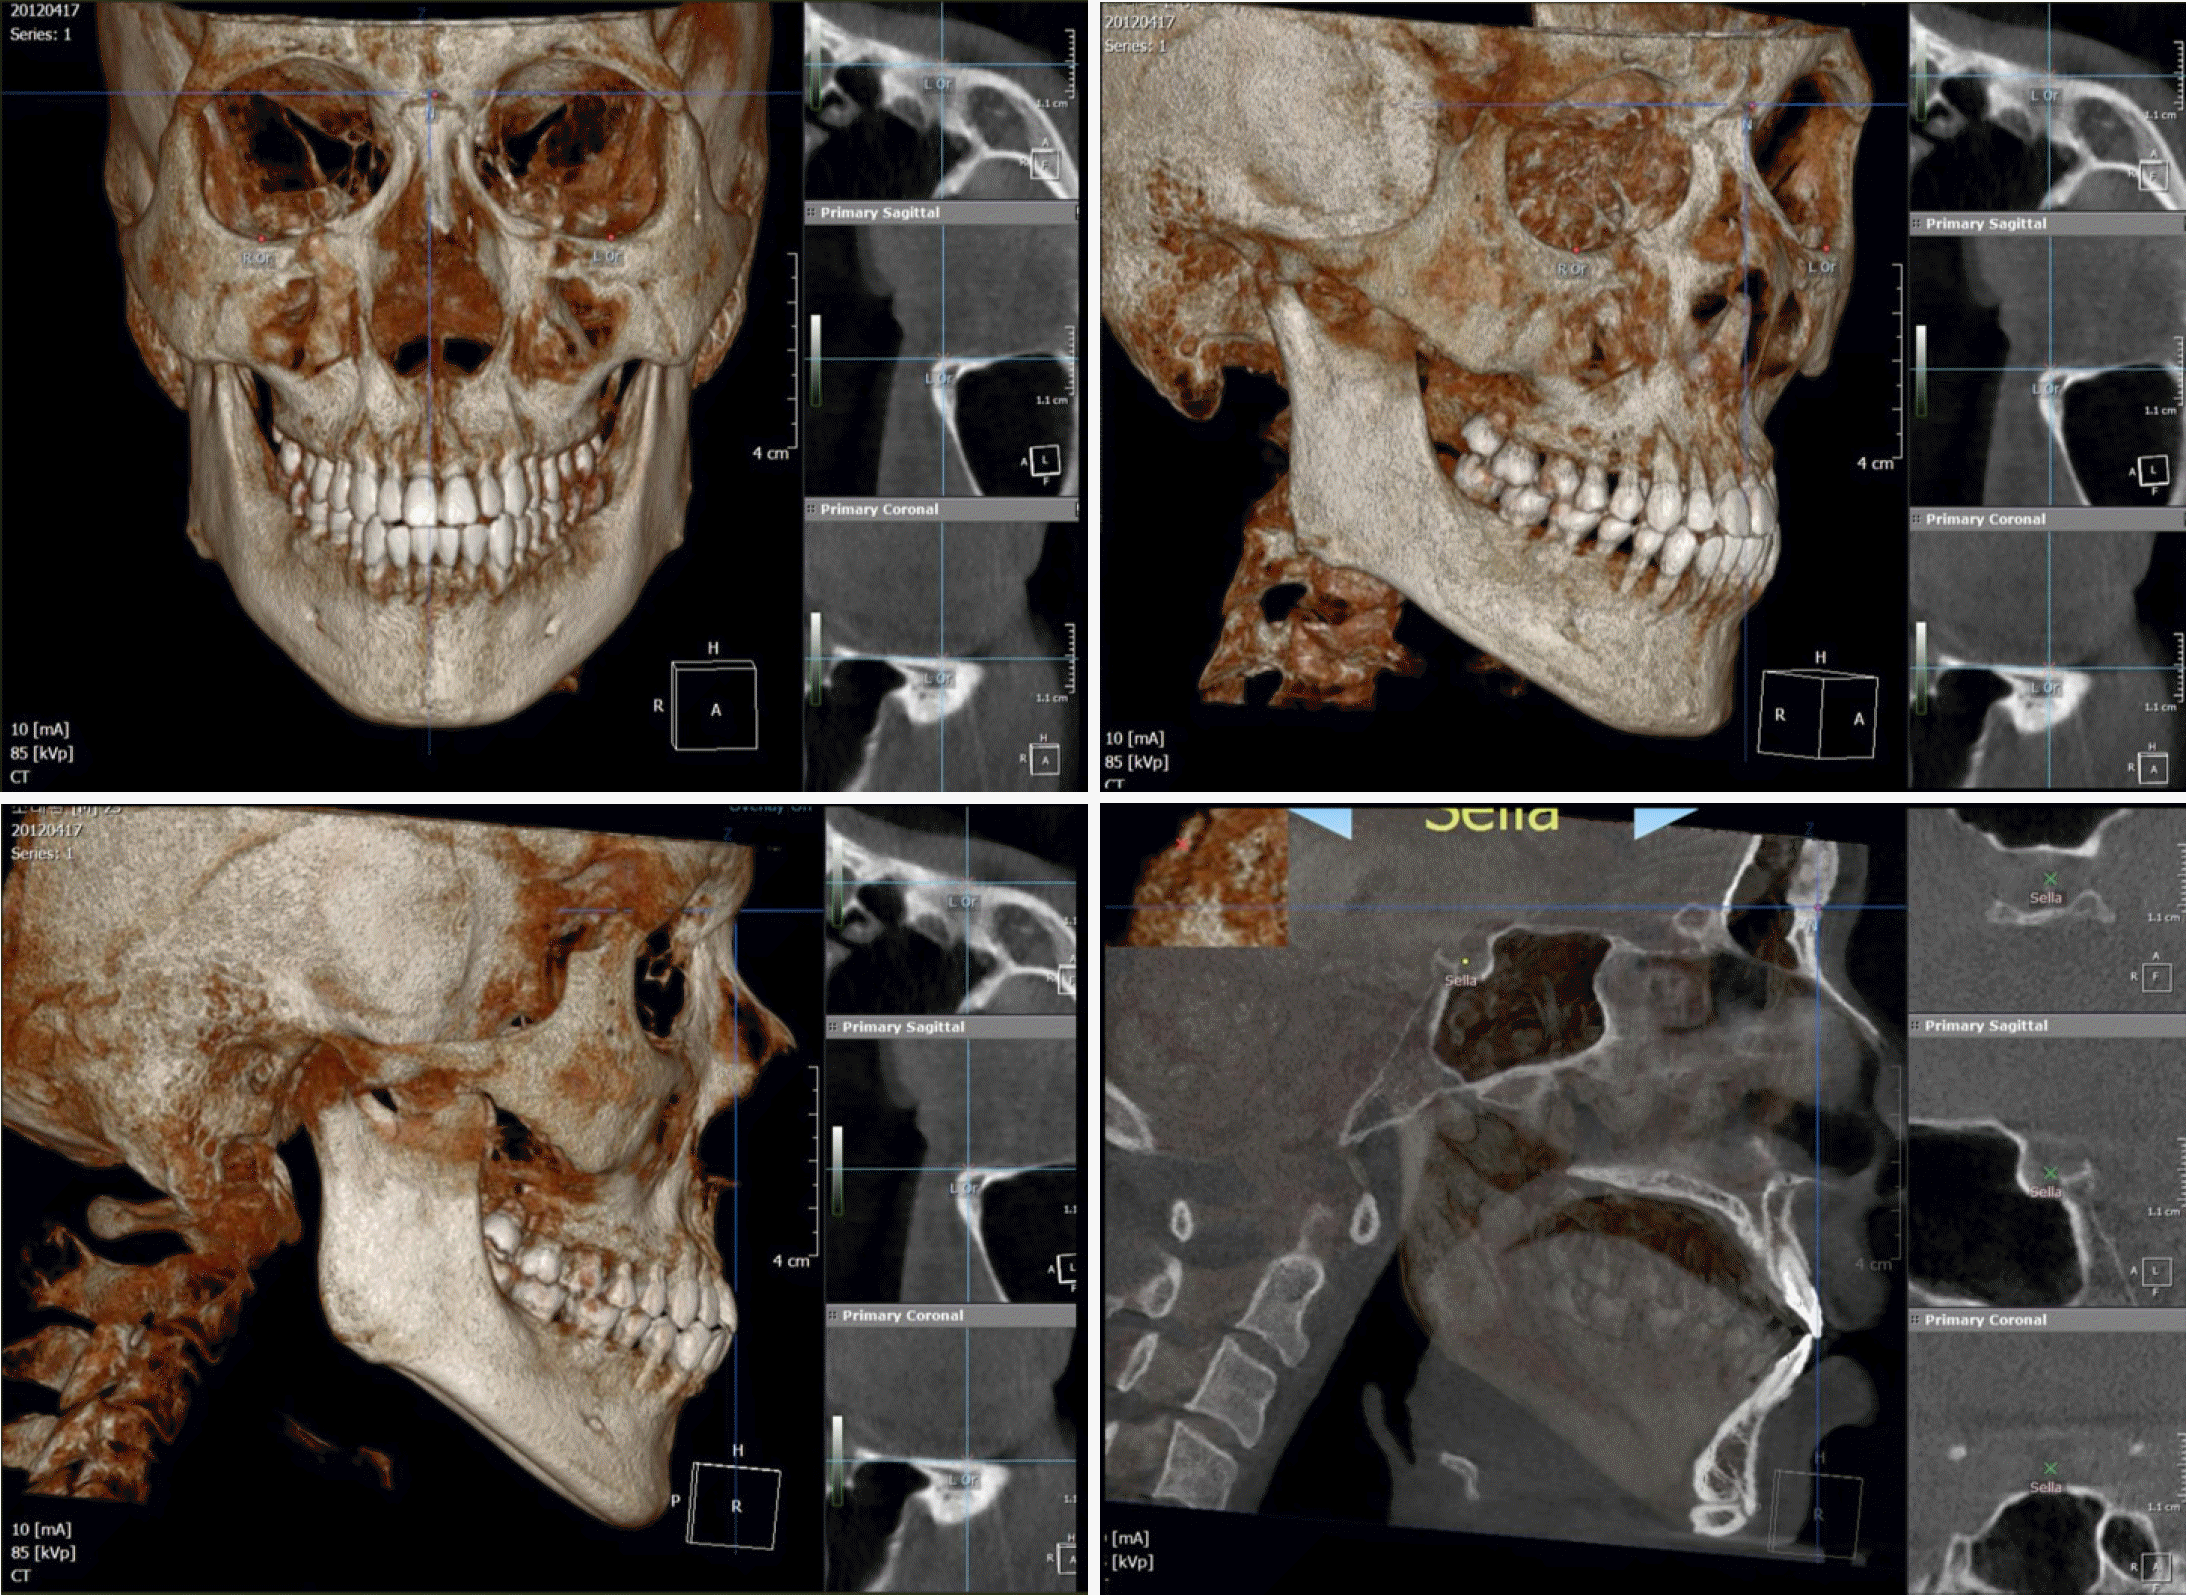 | Fig. 1.CBCT image of 3D and MPR (multiplanar projection reformat) for 3D landmark identification. |
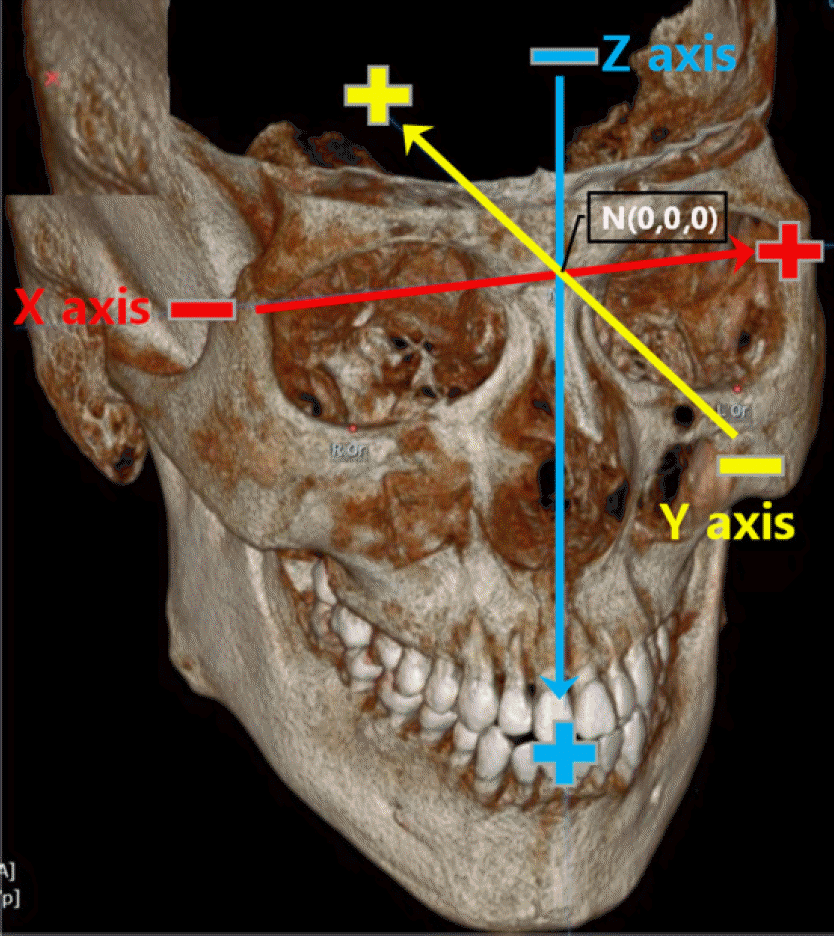 | Fig. 2.X, Y, Z axis of CBCT. N, (0,0,0); X axis, (-), right, (+), left; Y axis, (-), anterior, (+), posterior; Z axis, (-), upper, (+), lower. |
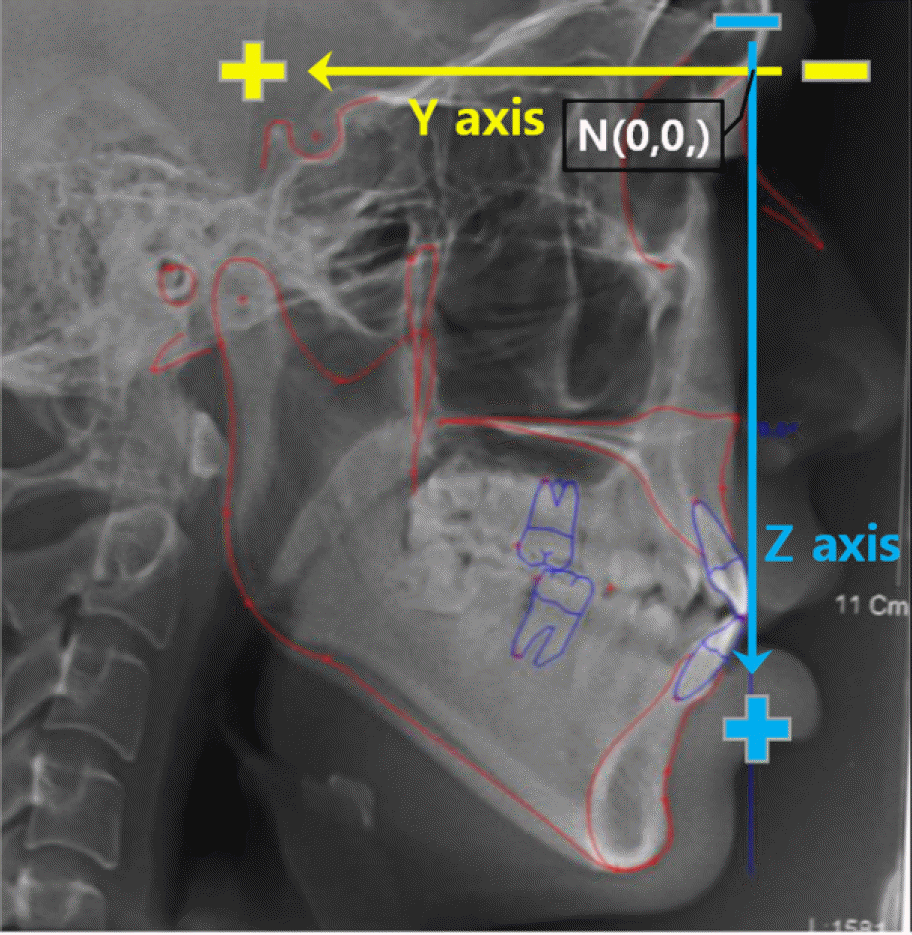 | Fig. 3.Y (Horizontal), Z (Vertical) axis of adjusted 2D lateral cephalogram. N (0,0); Y axis, (-), anterior, (+) posterior; Z axis, (-), upper, (+), lower. |
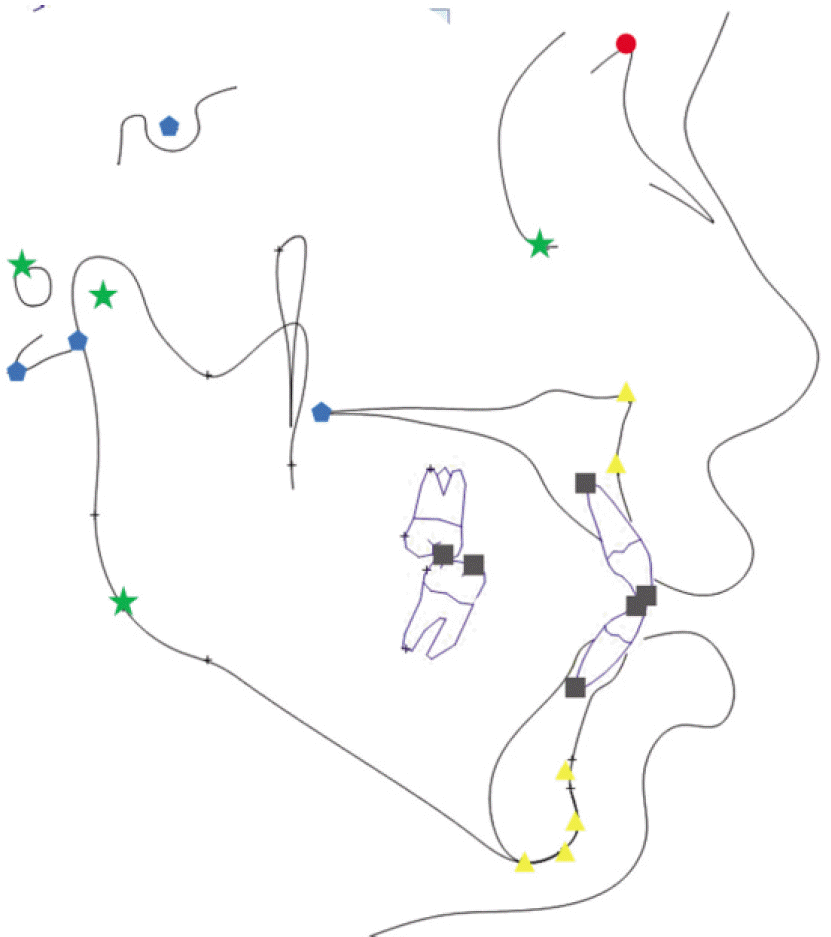 | Fig. 4.Classification of landmarks' position. Group A (Anterior landmark, marked ▲), ANS, A, B, Pog, Gn, Me; Group B (middle and posterior landmark, marked), S, Ar, Ba, PNS; Group C (R, L overlapped landmark, marked ★), Po, Or, Hinge axis, Go; Group D (Dental landmark, marked ■), U1CP, U1RP, U6CP, L1CP, L1RP, L6CP; red round, Nasion. |
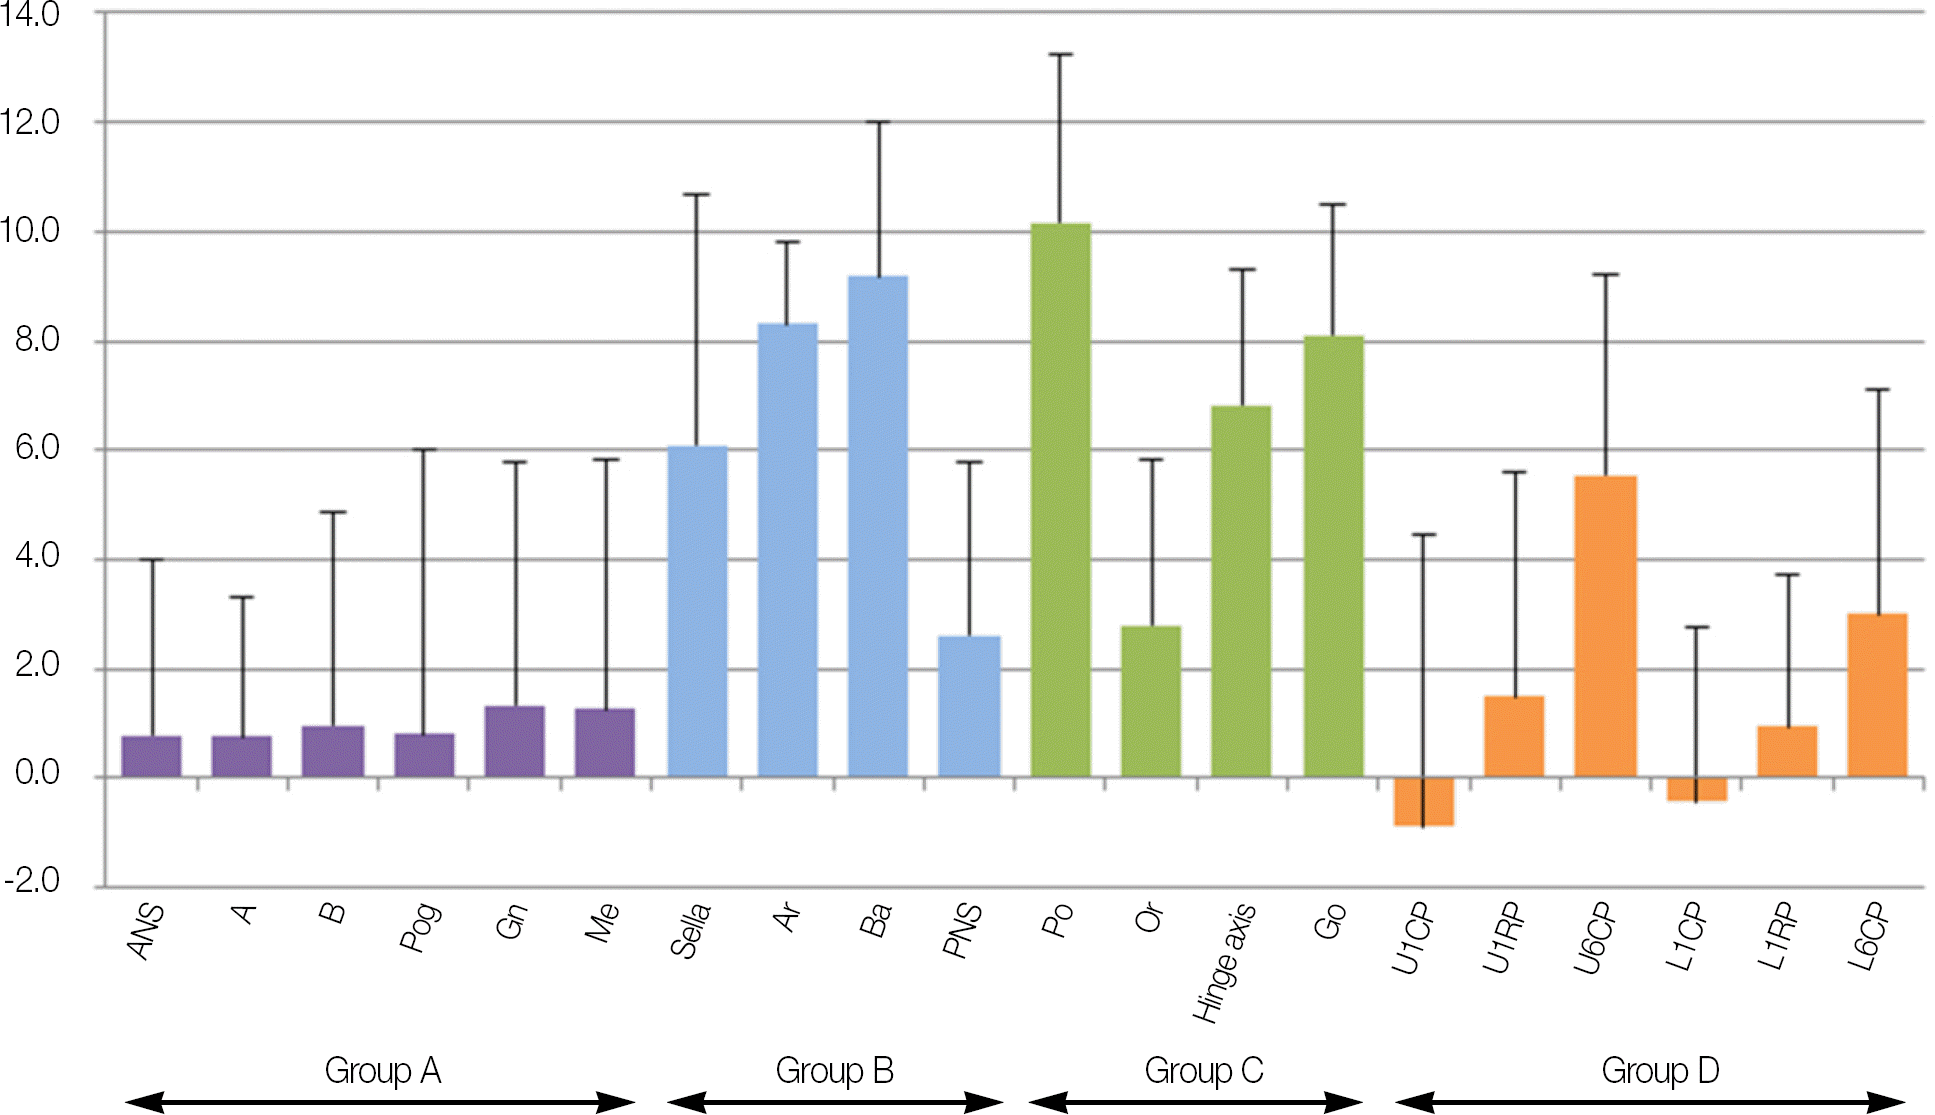 | Fig. 5.Horizontal difference between Adjusted Cephalogram and CBCT (values of Y axis) (mm). |
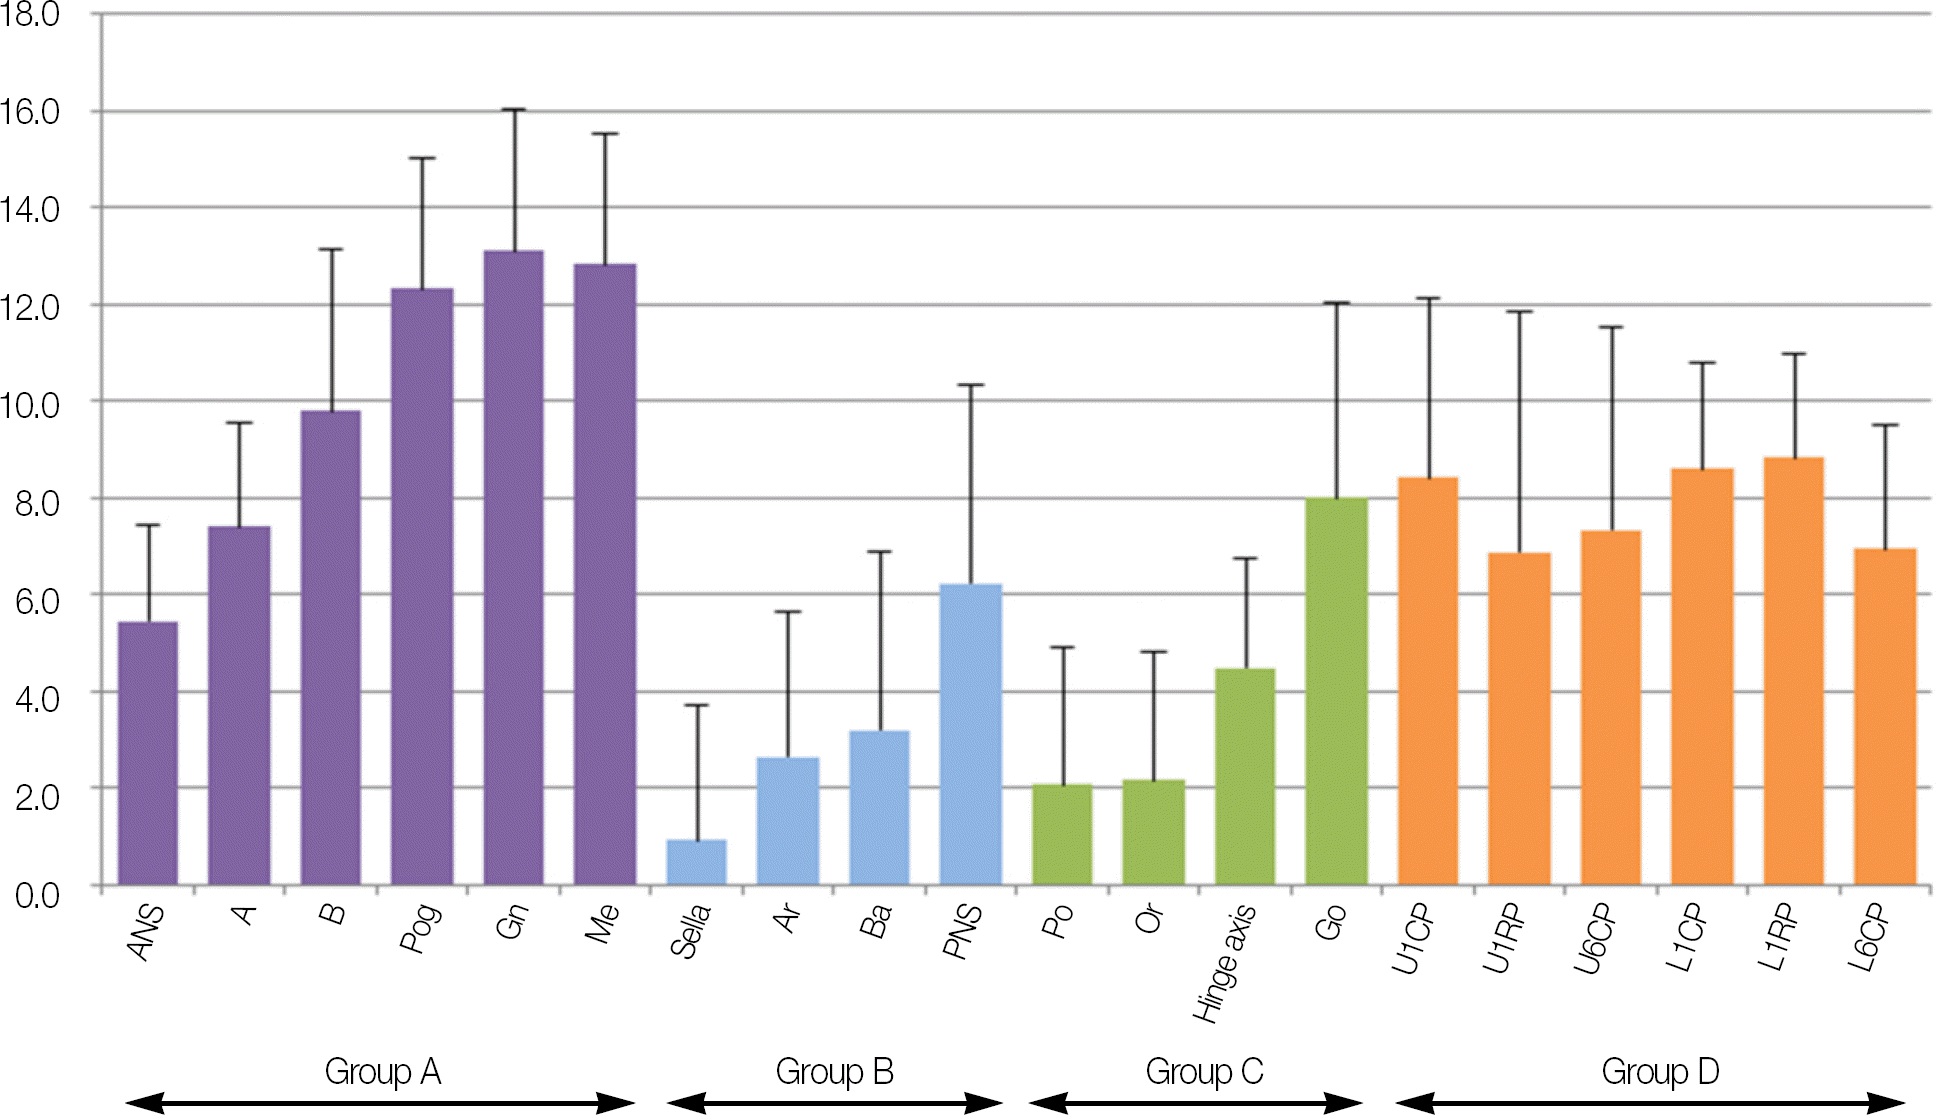
Table 1.
Definition of landmarks
Table 2.
Horizontal difference between Adjusted 2D Lateral Cephalogram and CBCT (values of Y axis)
| Landmark | Adj-Ceph (N = 50) Mean ± SD (mm) | CBCT (N = 50) Mean ± SD (mm) | Mean ± SD of the difference between Adj-Ceph and CBCT (mm) | P value | |
|---|---|---|---|---|---|
| Group A | ANS | -3.48 ± 4.50 | -4.26 ± 2.88 | 0.78 ± 3.21 | .094 |
| A | -0.12 ± 4.10 | -0.89 ± 2.93 | 0.77 ± 2.56 | .039∗ | |
| B | 1.95 ± 9.54 | 0.98 ± 8.38 | 0.97 ± 3.91 | .086 | |
| Pog | 0.61 ± 10.81 | -0.19 ± 9.30 | 0.80 ± 4.43 | .208 | |
| Gn | 3.14 ± 11.13 | 4.09 ± 9.55 | 1.34 ± 4.58 | .044∗ | |
| Me | 7.85 ± 10.73 | 6.58 ± 9.27 | 1.27 ± 4.57 | .055 | |
| Group B | S | 71.11 ± 4.10 | 65.01 ± 3.54 | 6.10 ± 1.53 | <.001∗∗ |
| Ar | 86.79 ± 5.77 | 78.49 ± 5.01 | 8.30 ± 2.83 | <.001∗∗ | |
| Ba | 97.10 ± 6.48 | 87.93 ± 5.17 | 9.18 ± 3.19 | <.001∗∗ | |
| PNS | 47.85 ± 4.60 | 45.24 ± 3.52 | 2.61 ± 3.10 | <.001∗∗ | |
| Po | 97.16 ± 6.03 | 87.00 ± 5.05 | 10.16 ± 3.06 | <.001∗∗ | |
| Group C | Or | 12.02 ± 3.07 | 9.22 ± 2.35 | 2.79 ± 2.49 | <.001∗∗ |
| Hinge Axis | 82.38 ± 5.48 | 75.55 ± 4.75 | 6.83 ± 2.39 | <.001∗∗ | |
| Go | 76.69 ± 7.54 | 68.59 ± 6.46 | 8.10 ± 3.66 | <.001∗∗ | |
| Group D | U1CP | -7.87 ± 6.05 | -6.99 ± 4.89 | -0.88 ± 3.17 | .055 |
| U1RP | 4.60 ± 4.24 | 3.24 ± 3.49 | 1.50 ± 2.78 | .001∗∗ | |
| U6CP | 27.07 ± 5.91 | 21.52 ± 4.44 | 5.55 ± 4.11 | <.001∗∗ | |
| L1CP | -6.45 ± 6.93 | -6.03 ± 6.25 | -0.42 ± 3.14 | .346 | |
| L1RP | 3.79 ± 8.98 | 2.84 ± 7.87 | 0.94 ± 9.79 | .498 | |
| L6CP | 21.24 ± 7.33 | 18.23 ± 6.72 | 3.01 ± 3.39 | <.001∗∗ | |
Table 3.
Vertical difference between Adjusted 2D Lateral Cephalogram and CBCT (values of Z axis)
| Landmark | Conventional Cephalogram (N = 50) Mean ± SD (mm) | CBCT (N = 50) Mean ± SD (mm) | Mean ± SD of the difference between Adj-Ceph and CBCT (mm) | P value | |
|---|---|---|---|---|---|
| Group A | ANS | 60.65 ± 4.56 | 55.24 ± 3.69 | 5.45 ± 1.99 | <.001∗∗ |
| A | 68.93 ± 5.08 | 61.48 ± 4.36 | 7.40 ± 2.13 | <.001∗∗ | |
| B | 116.85 ± 8.02 | 107.01 ± 6.93 | 9.80 ± 3.36 | <.001∗∗ | |
| Pog | 130.15 ± 8.72 | 117.84 ± 7.28 | 12.33 ± 2.96 | <.001∗∗ | |
| Gn | 135.52 ± 8.51 | 122.39 ± 7.43 | 13.10 ± 2.72 | <.001∗∗ | |
| Me | 137.46 ± 8.78 | 124.56 ± 7.43 | 12.83 ± 2.80 | <.001∗∗ | |
| Group B | S | 13.82 ± 3.64 | 11.75 ± 2.74 | 0.90 ± 2.99 | <.001∗∗ |
| Ar | 48.89 ± 5.56 | 44.85 ± 3.78 | 2.63 ± 3.71 | <.001∗∗ | |
| Ba | 56.19 ± 6.50 | 51.41 ± 4.10 | 3.19 ± 4.10 | <.001∗∗ | |
| PNS | 61.80 ± 5.24 | 54.77 ± 3.90 | 6.23 ± 2.83 | <.001∗∗ | |
| Group C | Po | 31.66 ± 2.79 | 29.32 ± 2.15 | 2.06 ± 2.67 | <.001∗∗ |
| Or | 31.66 ± 2.79 | 29.24 ± 2.05 | 2.15 ± 2.25 | <.001∗∗ | |
| Hinge Axis | 42.71 ± 4.74 | 36.19 ± 2.81 | 4.48 ± 4.04 | <.001∗∗ | |
| Go | 100.42 ± 9.65 | 91.54 ± 7.84 | 8.00 ± 4.19 | <.001∗∗ | |
| Group D | U1CP | 92.88 ± 5.99 | 84.55 ± 5.12 | 8.42 ± 2.19 | <.001∗∗ |
| U1RP | 71.29 ± 5.11 | 64.21 ± 4.54 | 6.87 ± 2.16 | <.001∗∗ | |
| U6CP | 87.61 ± 6.02 | 79.87 ± 4.83 | 7.33 ± 2.57 | <.001∗∗ | |
| L1CP | 92.04 ± 6.01 | 83.56 ± 5.54 | 8.59 ± 1.96 | <.001∗∗ | |
| L1RP | 109.58 ± 6.99 | 100.84 ± 6.09 | 8.83 ± 2.51 | <.001∗∗ | |
| L6CP | 88.65 ± 6.20 | 81.41 ± 5.23 | 6.94 ± 2.38 | <.001∗∗ | |
Table 4.
The difference between conventional cephalogram and CBCT data of duplicated skull model
 XML Download