Journal List > J Korean Acad Prosthodont > v.52(3) > 1034784

Kim, Kim, and Dong: Application of PERT/CPM in dental practice

Abstract

Purpose

Process management is the activity which manages all procedure of construction by representing visually interrelation of operation or sequence setting. The purpose of this study was for reducing treatment period and higher efficiency of treatment through application of PERT/CPM (Program Evaluation & Review Technique/Critical Path Method) in dental clinic.

Materials and methods

The patients were selected for study who needed more than 2 departments' cooperation for prosthodontic treatment in Wonkwang Dental University Hospital. Control group is composed of the patient's whole treatment plan, treatment period, numbers of hospital visit, treatment costs, treatment results. On the other hand, experiment group contains the patient's virtual treatment data based on PERT/CPM technique. We applied PERT/CPM in operation analysis.

Results

Treatment period, numbers of hospital visit was decreased as 18.1% and 15.3% when we applied operation analysis based on charts. Also treatment cost in experiment group was 0.9% economized compared with control group's treatment cost.

Conclusion

Application of PERT/CPM in dental clinic can achieve reliable treatment and reduced treatment period and establish plan of minimum treatment cost.

REFERENCES

1. Johnston JF, Dykema RW, Goodacre CJ, Phillips RW, Johnston JF. Johnston's Modern practice in fixed prosthodontics. 4th ed.Philadelphia; PA: Saunders;1986.
2. Vanhoucke M. Project Management with Dynamic Scheduling: Baseline Scheduling, Risk Analysis and Project Control. 2 nd ed. Dordrecht;. Springer;2013. p. 45–50.
3. Vanhoucke M, Demeulemeester E. The application of project sched-uling techniques in a real-life environment. Proj Manage J. 2003; 34:30–42.
crossref
4. Vanhoucke M. On the dynamic use of project performance and schedule risk information during projecttracking. Omega. 2011; 39:416–26.
crossref
5. Kelley JE Jr. Critical-Path Planning and Scheduling: Mathematical Basis. Oper Res. 1961; 9:296–320.
crossref
6. Zarb GA, Bolender CL, Eckert SE. Prosthodontic treatment for edentulous patients: Complete dentures and implant-supported prostheses. 12th ed.St. Louis: Mosby;2004.
7. Kruger GO. Textbook of oral and maxillofacial surgery. 6th ed.C.V. Mosby;1980.
8. Albrektsson T, Bra�nemark PI, Hansson HA, Lindstro¨m J. Osseointegrated titanium implants. Requirements for ensuring a long-lasting, direct bone-to-implant anchorage in man. Acta Orthop Scand. 1981; 52:155–70.
9. Bryant SR, Zarb GA. Osseointegration of oral implants in old-er and younger adults. Int J Oral Maxillofac Implants. 1998; 13:492–9.
10. Lytle JD. Clinician's index of occlusal disease: definition, recognition, and management. Int J Periodontics Restorative Dent. 1990; 10:102–23.

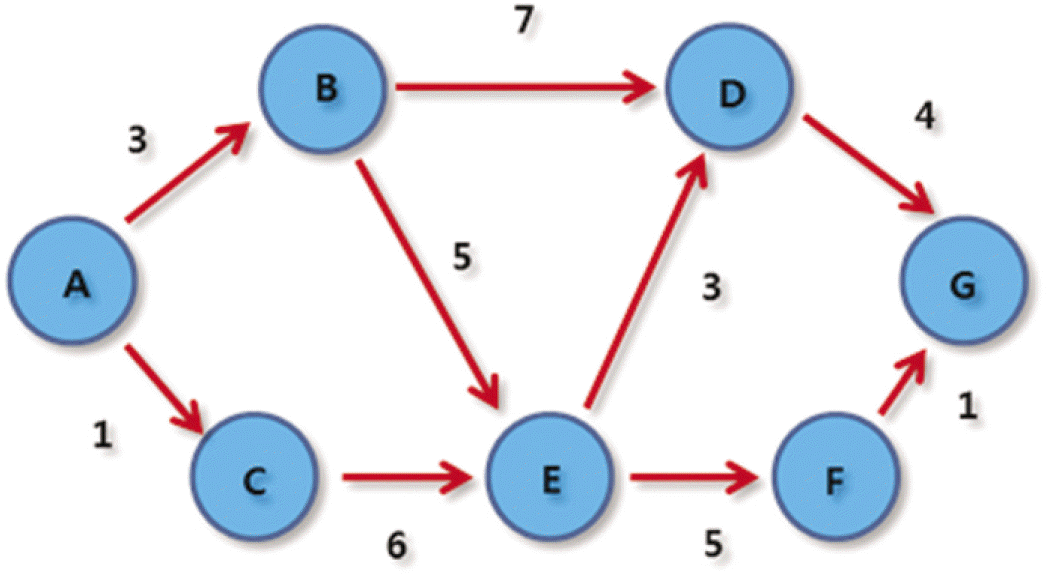
Fig. 1.
Flow chart of PERT/CPM. In the flow chart A to G is indicated as the event of project, arrows as activity of project, and numbers as period between events.
jkap-52-186f1.tif
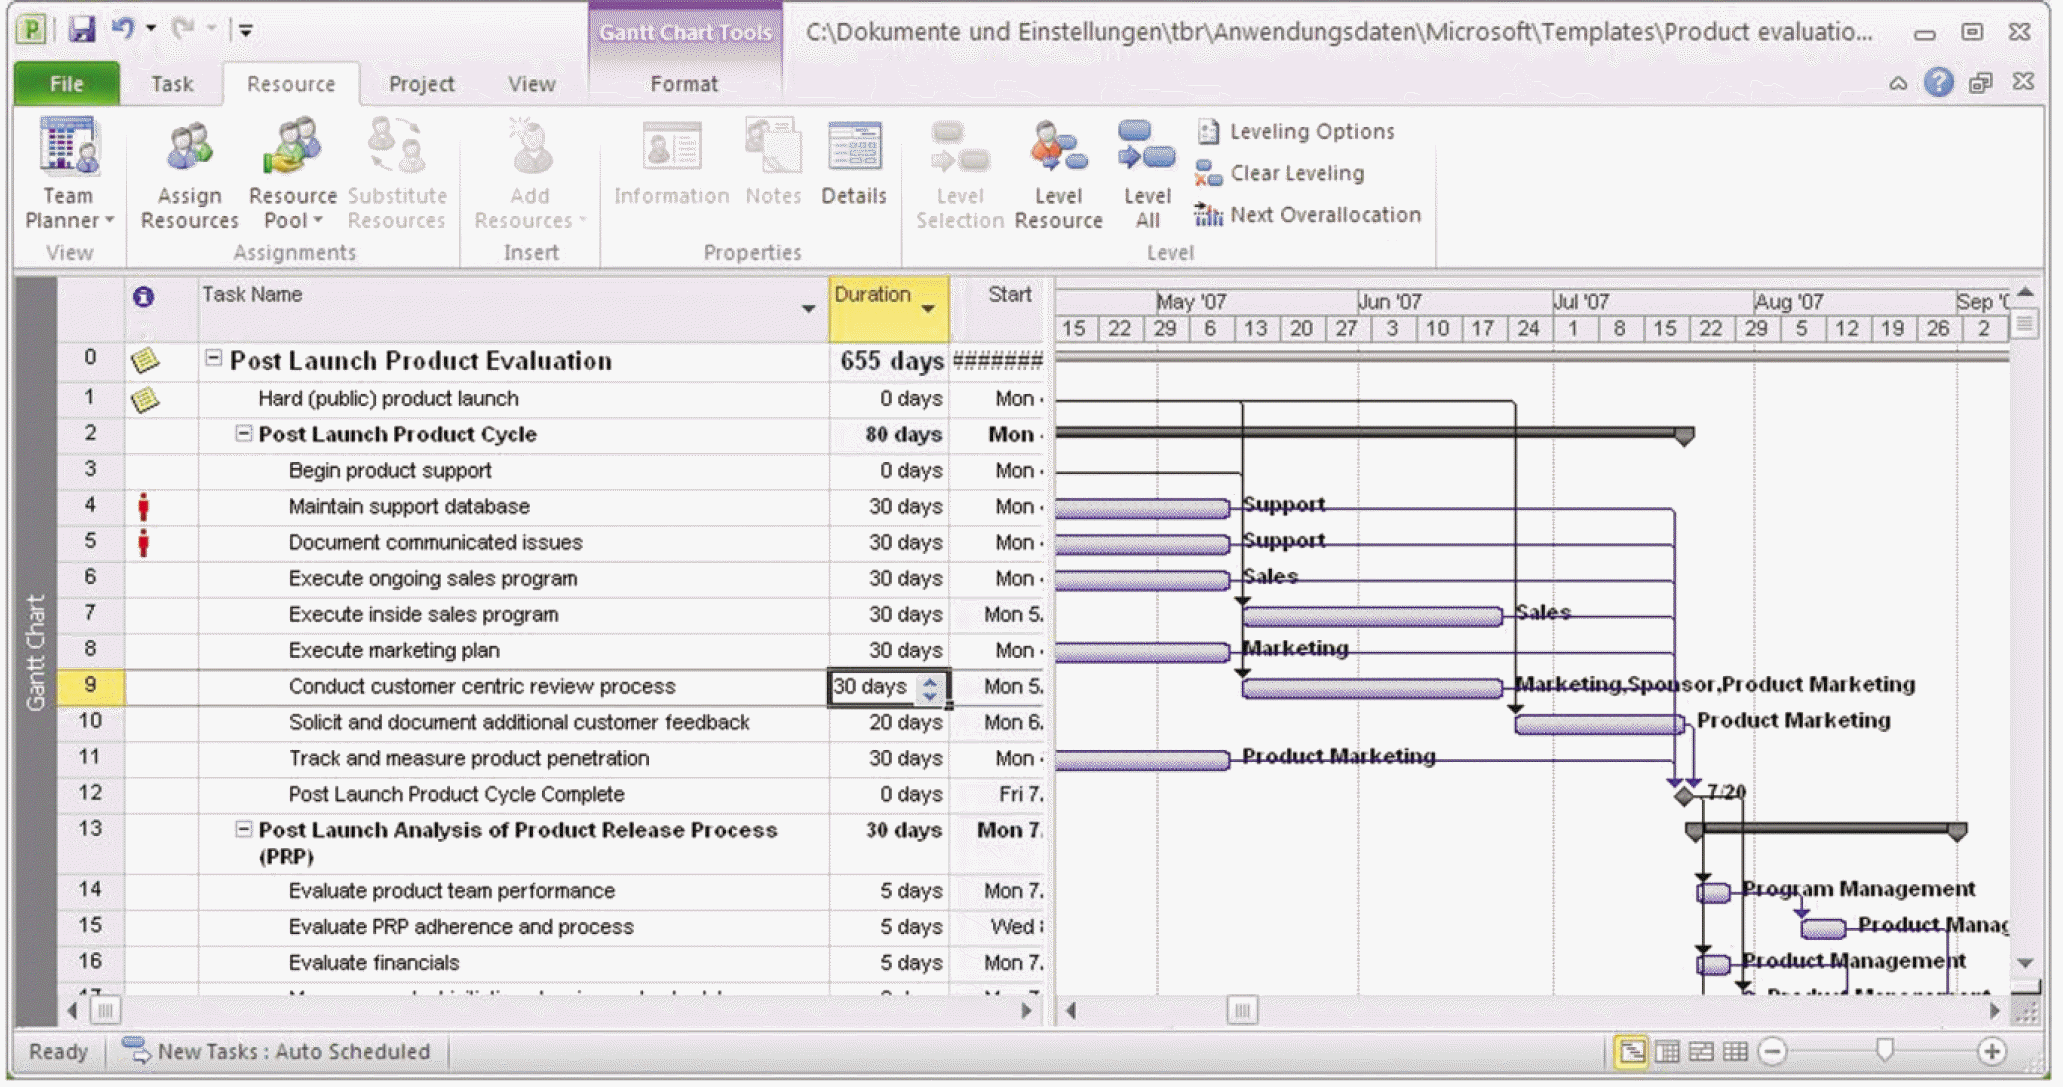
Fig. 2.
Microsoft Office Project Professional 2010 (Microsoft, Seattle, Washington, USA).
jkap-52-186f2.tif
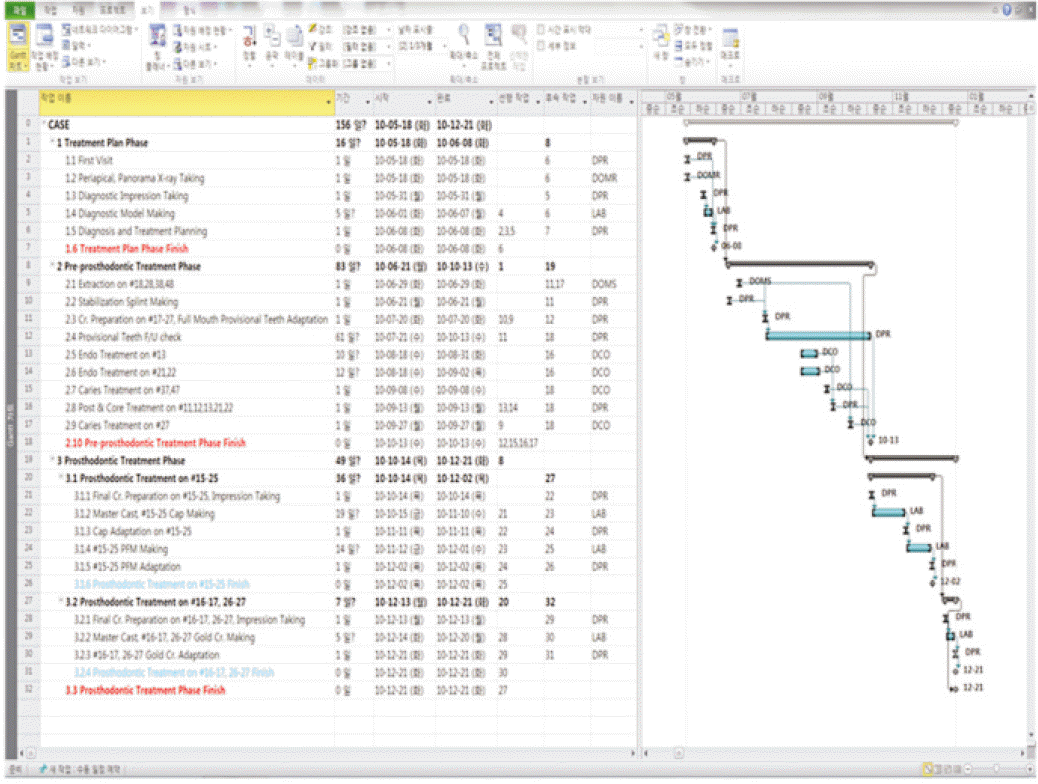
Fig. 3.
Example of patient's actual treatment process.
jkap-52-186f3.tif
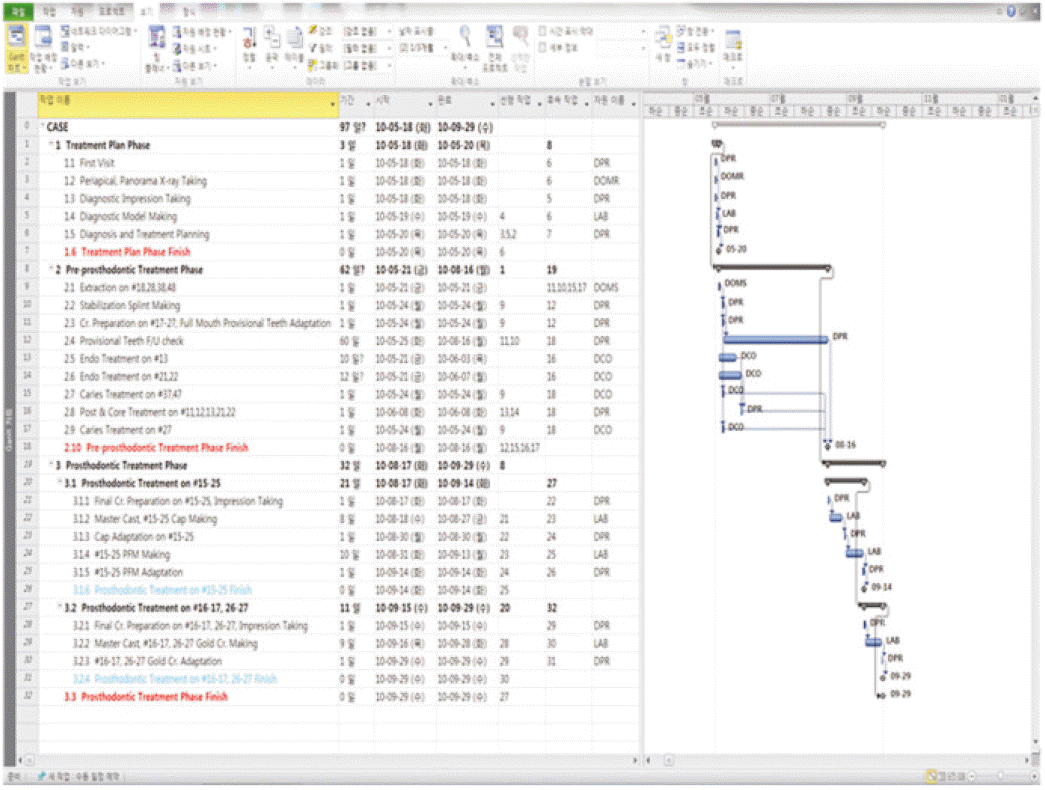
Fig. 4.
Example of patient's virtual treatment process.
jkap-52-186f4.tif
Fig. 5.
Comparison of control group and experimental group in treatment period.
jkap-52-186f5.tif
Fig. 6.
Comparison of control group and experimental group in the numbers of hospital visit.
jkap-52-186f6.tif
Fig. 7.
Comparison of control group and experimental group in treatment cost.
jkap-52-186f7.tif
Table 1.
Cooperated departments for each patient
No. Age Sex Departments
1 70 M DPR, DOMR, DOMS, LAB
2 58 F DPR, DOMR, DCO, DOMS, LAB
3 80 M DPR, DOMR, DOMS, LAB
4 89 F DPR, DOMR, LAB
5 58 M DPR, DOMR, DOMS, LAB
6 47 M DPR, DOMR, DCO, DOMS, LAB
7 68 M DPR, DOMR, DCO, DOMS, LAB
8 60 M DPR, DOMR, DOMS, LAB
9 74 M DPR, DOMR, DPE, DCO, DOMS, LAB
10 63 F DPR, DOMR, DPE, DOMS, LAB
11 80 M DPR, DOMR, DOMS, LAB
12 80 M DPR, DOMR, DOMS, LAB
13 84 F DPR, DOMR, DOMS, LAB
14 81 F DPR, DOMR, DPE, DCO, LAB
15 82 F DPR, DOMR, DPE, DCO, LAB

DCO: Department of Conservative, DOMR: Department of Oral & Maxillofacial Radiology, DOMS: Department of Oral & Maxillofacial Surgery, DPE: Department of Periodontics, DPR: Department of Prosthodontics, LAB: Dental Laboratories.

Table 2.
Mean treatment period of procedure in other studies
Treatment procedure Mean treatment period Author
Immediate denture 3 months Zarb et al.6
Tooth extraction 5 - 7 days Kruger7
Implant placement 3 - 6 months Albrektsson et al.8
2 - 3 months Bryant and Zarb9
Vertical dimension establishment 3 months Lytle10
Table 3.
Mean manufacturing period of dental laboratory in Wonkwang Dental Hospital (2012.1.1 - 2012.12.31)
Work list Manufacturing period (days)
Record base, occlusal rim 6.04
RPD framework 7.51
Wax denture 7.64
Ceramic metal framework 8.75
Denture polymerization 8.81
Gold crown, bridge 9.13
Ceramic crown, bridge 10.08
Implant temporary crown 8.24
Immediate denture (TPD) 5.67
Cast post 5.92
Table 4.
Treatment plan for each patient
No. Treatment plan
1 Treatment planning
Extraction on #15,17,21,25,31,32,36,41,42,45
Mx. & Mn. TPD, F/U check
Mx. & Mn. Removable partial denture
2 Treatment planning
Extraction on #17,26,27,37,44,47, Mx. & Mn. TPD, F/U check
#11,12,22,23,24 Caries Tx., #33 RCT
Mx. & Mn. Removable partial denture
3 Treatment planning
Mn. alveoloplasty, Mx. & Mn. TPD, F/U check
Mx. & Mn. Complete denture
4 Treatment planning
None
Mx. & Mn. Complete denture
5 Treatment planning
Extraction on #11,12,21,32,34,36,37,42,44,45,46,47
Mx. & Mn. TPD, F/U check
Mx. & Mn. Implant fixed prosthesis, Mn. fixed partial denture
6 Treatment planning
Extraction on #18,28,38,48, Bite rasing, F/U check
#13,21,22 RCT, #27,37,47 Caries Tx., #11,12,13,21,22 post&core
Mx. fixed partial denture
7 Treatment planning
Extraction on #22,34,35,41,42, #12,13,43 RCT
Mx. & Mn. TPD, F/U check
Mx. & Mn. Removable partial denture
8 Treatment planning
Extraction on #11,12,21,22,24,25,44,45,48, Implant immediate loading
Mx. & Mn. Implant fixed prosthesis
9 Treatment planning
Extraction on #13,18,23,24,27,36,38,48, Mx. & Mn. TPD, F/U check
#33,34,43,44 RCT, CLP, post&core
Mx. Removable partial denture, Mn. fixed partial denture
10 Treatment planning
Extraction on #11,12,15,16,26,31,34,41,42, Mx. & Mn. TPD, F/U check
Mx. & Mn. Removable partial denture
11 Treatment planning
Extraction on #21,22,32,33,42
Mx. & Mn. TPD, F/U check
Mx. & Mn. Complete denture
12 Treatment planning
Extraction on #21,23,31,32,35,41,42,43,45,46
Mx. & Mn. TPD, F/U check
Mx. Complete denture, Mn Removable partial denture
13 Treatment planning
Extraction on #11,12,13,14,15,16,17,21,22,23,24,31,32,33,41,42,43
Mx. & Mn. TPD, F/U check
Mx. & Mn. Complete denture
14 Treatment planning
Extraction on #16,18,26,31,32,36,41,42,46,47
Mx. & Mn. TPD, F/U check
Mx. & Mn. Removable partial denture
15 Treatment planning
Extraction on #11,16,21,22,25,26,31,32,38,41,42,43
Mx. & Mn. TPD, F/U check
Mx. & Mn. Removable partial denture
Table 5.
Each patient's actual treatment period, numbers of hospital visit, treatment cost in our study
No. Treatment period (days) Hospital visit (numbers) Treatment cost (won)
1 189 26 7,115,486
2 166 24 3,436,282
3 63 13 2,553,213
4 27 7 2,223,947
5 302 47 37,539,531
6 156 20 7,935,805
7 117 25 6,370,396
8 263 42 416,789,321
9 168 31 12,565,284
10 131 22 11,180,424
11 65 9 2,510,430
12 80 18 4,701,877
13 120 17 3,656,572
14 301 28 5,251,530
15 240 30 7,122,147
Table 6.
Each patient's virtual treatment period, numbers of hospital visit, treatment cost in our study
No. Treatment period (days) Hospital visit (numbers) Treatment cost (won)
1 162 21 6,895,886
2 147 19 3,392,931
3 66 12 2,508,573
4 29 7 2,223,947
5 276 36 37,411,191
6 97 16 7,882,085
7 87 21 6,207,692
8 168 36 41,250,764
9 129 27 12,457,580
10 84 19 11,173,939
11 62 9 2,510,430
12 82 16 4,665,037
13 98 15 3,627,292
14 256 22 5,163,690
15 212 25 7,048,947
Table 7.
Mean value and statistical significance of treatment period
Object Mean SD t P
Treatment period Control 159.20 85.526 4.243 .001
Experiment 130.33 72.691
Table 8.
Mean value and statistical significance of the numvers of hospital visit
Object Mean SD t P
Hospital visits Control 23.93 11.026 6.122 .000
Experiment 20.27 8.900
Table 9.
Mean value and statistical significance of treatment cost
Object Mean SD t P
Treatment cost Control 10,389,457 12,269,799 3.299 .005
Experiment 10,294,666 12,189,308
TOOLS
Similar articles