Abstract
Purpose
The purpose of this study was to compare the fracture strength of traditional metal-ceramic crowns and full zirconia crowns according to the occlusal thickness.
Materials and methods
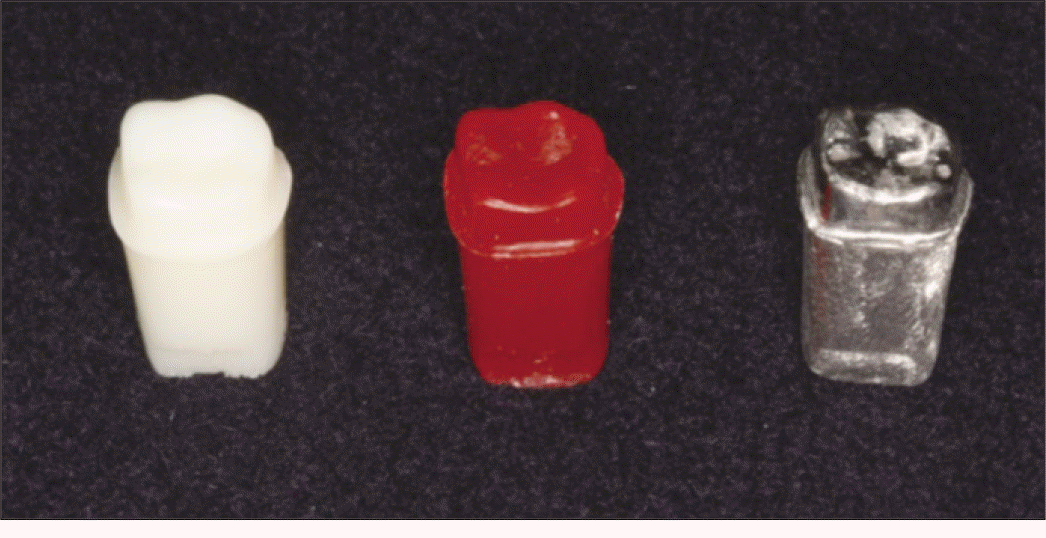
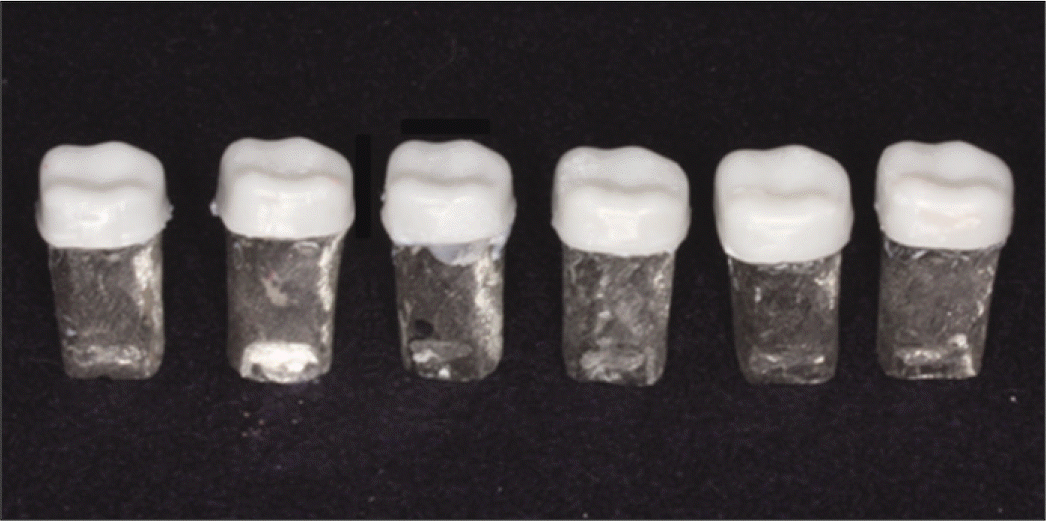
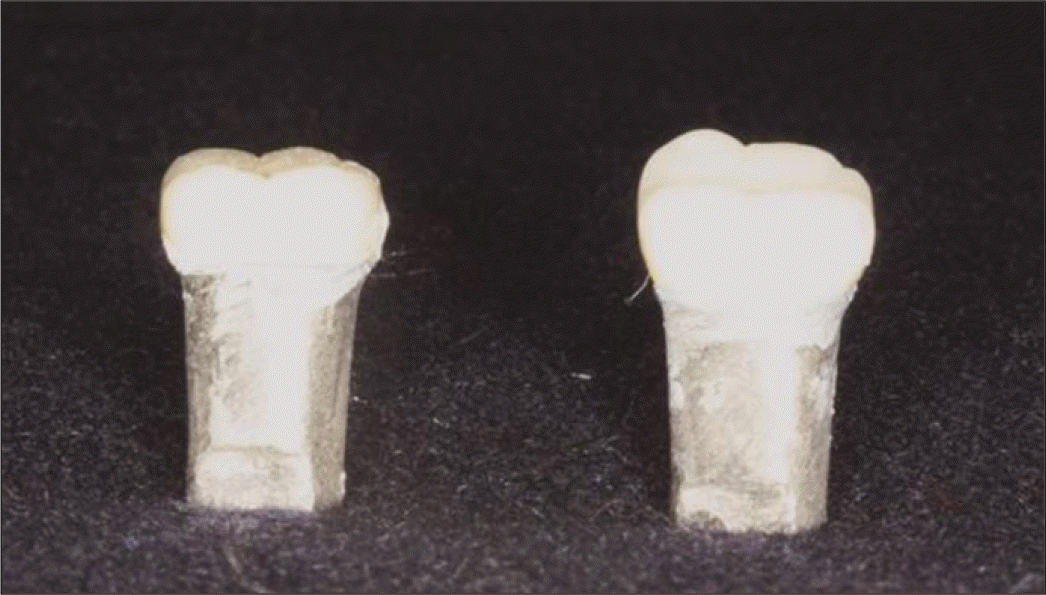
A mandibular first molar resin tooth was prepared with 1.5 mm occlusal reduction, 1.0 mm rounded shoulder margin and 6° taperness in the axial wall. Duplicating the resin tooth, 64 metal dies were fabricated. 48 full zirconia crowns were fabricated using Prettau zirconia blanks by ZIRKONZAHN CAD/CAM and classified into six groups according to the occlusal thickness (0.5 mm, 0.6 mm, 0.7 mm, 0.8 mm, 0.9 mm, 1.0 mm). 16 metal-ceramic crowns were fabricated and classified into two groups according to the occlusal porcelain thickness (1.0 mm, 1.5 mm). All crowns were cemented on each metal die and mounted in a universal testing machine. The load was directed at the functional cusp of each specimen until catastrophic failure occurred. One-way ANOVA, Tukey multiple comparison test (α =.05) and t-test (α =.05) were used.
Results
The results were as follows. 1. The test 1 group (646.48 N) showed the lowest fracture strength (P<.05), and the value of the test 2.3.4.5 groups (866.40 N, 978.82 N, 1196.82 N, 1222.41 N) increased as thickness increased, but no significant difference were found with the groups (P>.05). The value of test 6 group (1781.24 N) was significantly higher than those of the other groups (P<.05). 2. There were no significant differences of the fracture strength of metal ceramic crowns according to occlusal porcelain thickness 1.0 mm (2515.71 N) and 1.5 mm (3473.31 N) (P<.05).
Go to : 
REFERENCES
1.Ernsmere JB. Porcelain dental work. Br J Dent Sci. 1900. 43:547–50.
2.Weinstein M., Katz S., Weinstein AB. Fused porcelain-to-metal teeth. 1962. US patent 3052, 982.
3.Johnston JF. Porcelain veneers bonded to gold castings-A progress report. J Prosthet Dent. 1958. 8:120–2.

5.Adair PJ., Grossman DG. The castable ceramic crown. Int J Periodontics Restorative Dent. 1984. 4:32–46.
6.Optec HSP laboratory technique manual. Jeneric/Pentro Inc;Wallingford, Conn: 1988.
7.Sadoun M. All ceramic bridges with the slip casting technique. Presented at the 7tb International Symposium on Ceramics. Paris, September,. 1988.
8.Beham G. IPS-Empress: a new ceramic technology. ZWR. 1991. 100:404–8.
10.Filser F., Kocher P., Gauckler LJ. Net-shaping of ceramic components by direct ceramic machining. Assembly Autom. 2003. 23:382–90.

11.Heintze SD., Rousson V. Survival of zirconia- and metal-supported fixed dental prostheses: a systematic review. Int J Prosthodont. 2010. 23:493–502.
12.Bachhav VC., Aras MA. Zirconia-based fixed partial dentures: a clinical review. Quintessence Int. 2011. 42:173–82.
13.Ozkurt Z., Kazazoğlu E. Clinical success of zirconia in dental applications. J Prosthodont. 2010. 19:64–8.
14.Sailer I., Fehe′r A., Filser F., Lu¨thy H., Gauckler LJ., Scha¨rer P., Franz Ha¨mmerle CH. Prospective clinical study of zirconia posterior fixed partial dentures: 3-year follow-up. Quintessence Int. 2006. 37:685–93.
15.Molin MK., Karlsson SL. Five-year clinical prospective evaluation of zirconia-based Denzir 3-unit FPDs. Int J Prosthodont. 2008. 21:223–7.
16.Craig RG., Powers JM. Restorative dental materials. 8th ed.St Louis, Mo: The CV Mosby Co;1989.
17.Waltimo A., Ko¨no¨nen M. Maximal bite force and its association with signs and symptoms of craniomandibular disorders in young Finnish non-patients. Acta Odontol Scand. 1995. 53:254–8.

18.Waltimo A., Nystro¨m M., Ko¨no¨nen M. Bite force and dentofacial morphology in men with severe dental attrition. Scand J Dent Res. 1994. 102:92–6.

19.Ferrario VF., Sforza C., Zanotti G., Tartaglia GM. Maximal bite forces in healthy young adults as predicted by surface electromyography. J Dent. 2004. 32:451–7.

20.Brukl CE., Ocampo RR. Compressive strengths of a new foil and porcelain-fused-to-metal crowns. J Prosthet Dent. 1987. 57:404–10.

21.Lee SM., Jeong HC., Jeon YC. Fracture strength of zirconia monolithic crowns and metal-ceramic crowns after cyclic loading and thermocycling. J Korean Acad Prosthodont. 2007. 45:12–20.
Go to : 
 | Fig. 4.A: Schematic illustration of the universal test machine experimental setup, B: Secured crown for testing in custom jig on universal testing machine, C: Fractured specimen after loading. |
Table 1.
Fracture strength of full zirconia crown (unit: N)
Table 2.
Results of one-way ANOVA
| Source | Sum of squares | df | Mean square | F value | P value |
|---|---|---|---|---|---|
| Between groups | 6095736.74 | 5 | 1219147.35 | 10.931 | <.001 |
| Within groups | 4684134.40 | 42 | 111527.01 | ||
| Total | 10779871.14 |


 PDF
PDF ePub
ePub Citation
 Print
Print


 XML Download