Abstract
Materials and methods
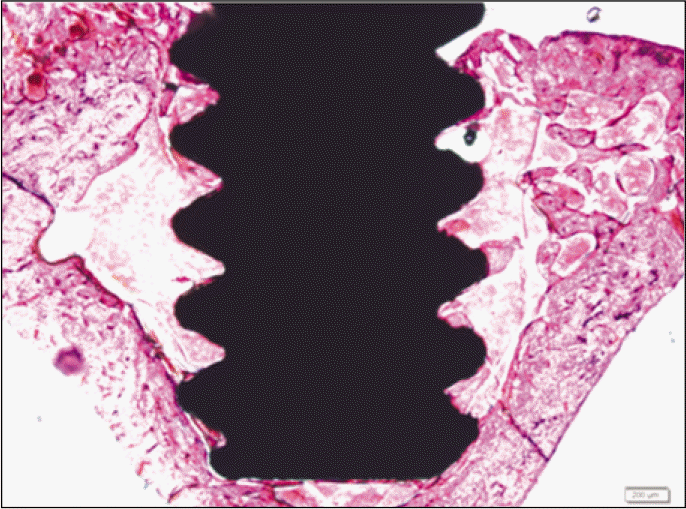
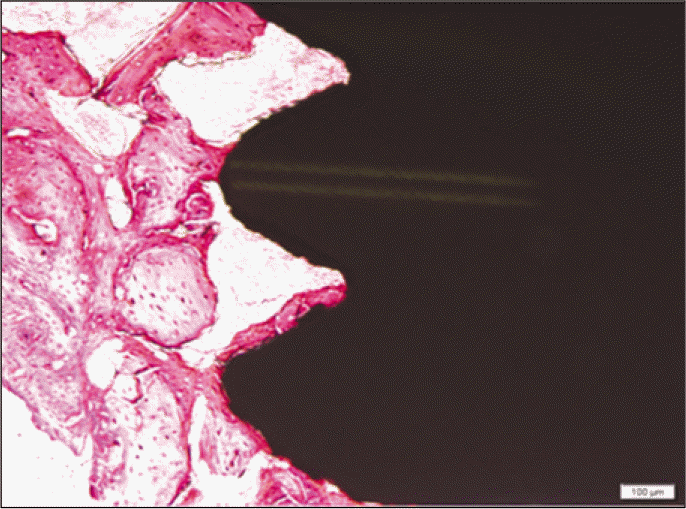
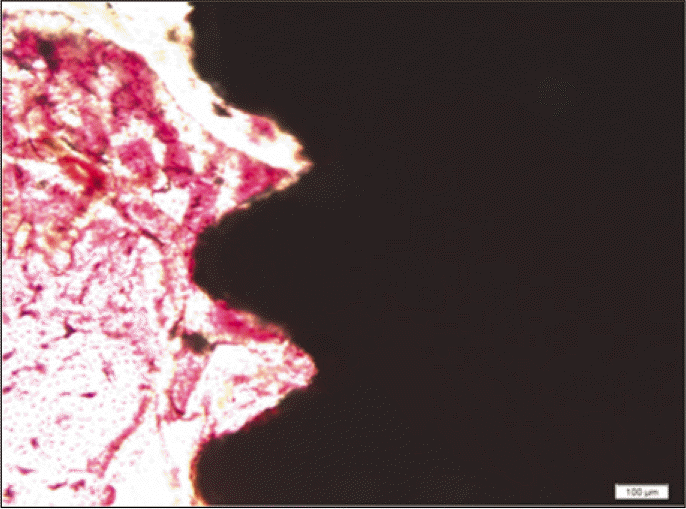
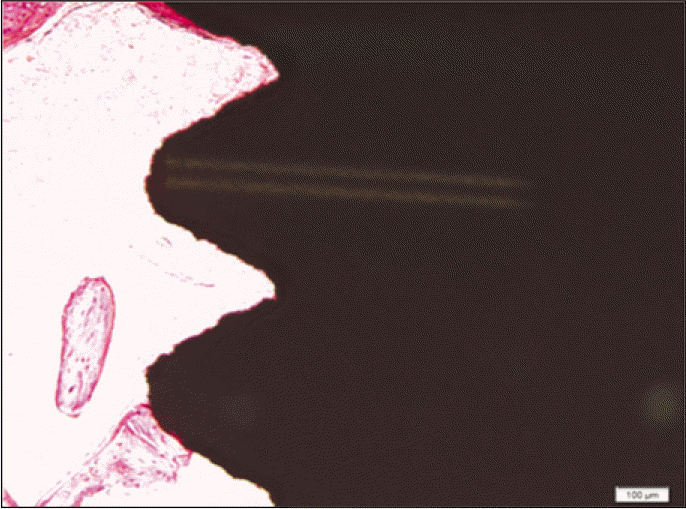
Forty eight implants were installed at the tibia of ovariectomized rats. The group administrated with PostGraftTM was the experimental group, and the control group was not administrated. Implant stability was evaluated at the 2nd, 4th and 6th week by Periotest value, bone mineral density, bone-to-implant contact. These values were analyzed statistically with Mann-Whitney U test (P<.05). Histological analysis was evaluated at the 2nd, 4th and 6th week.
Results
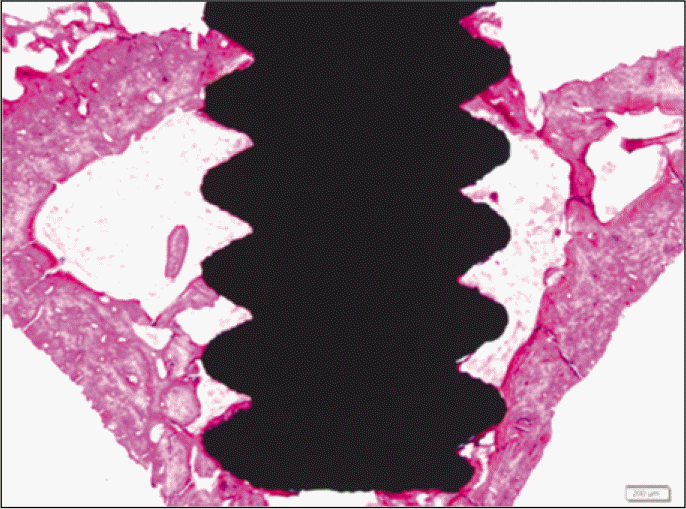
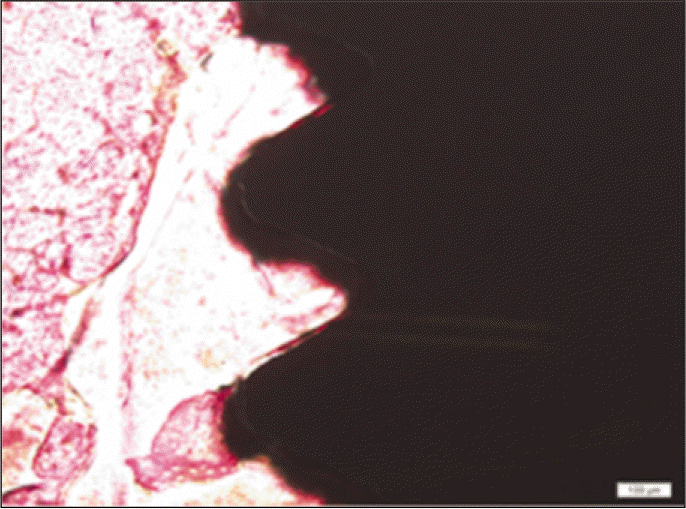
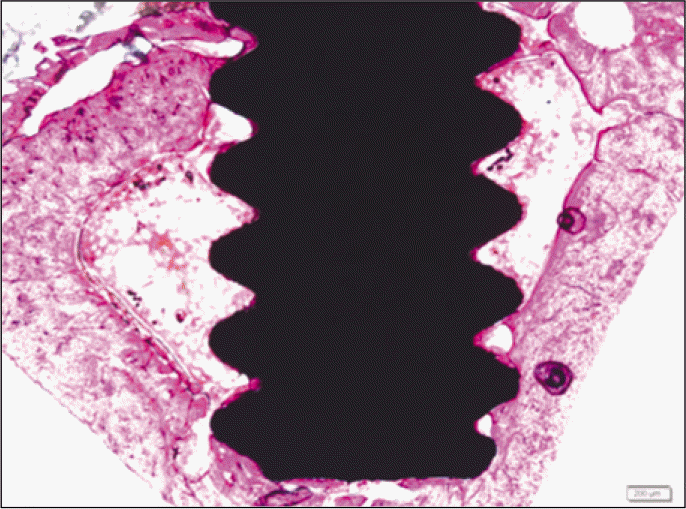
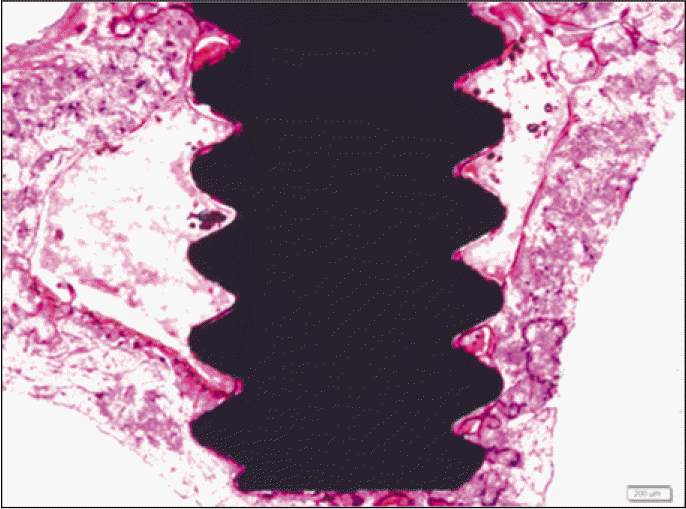
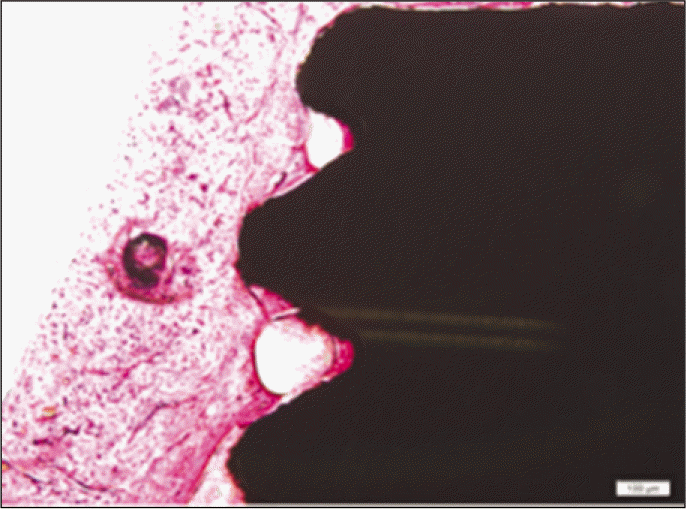
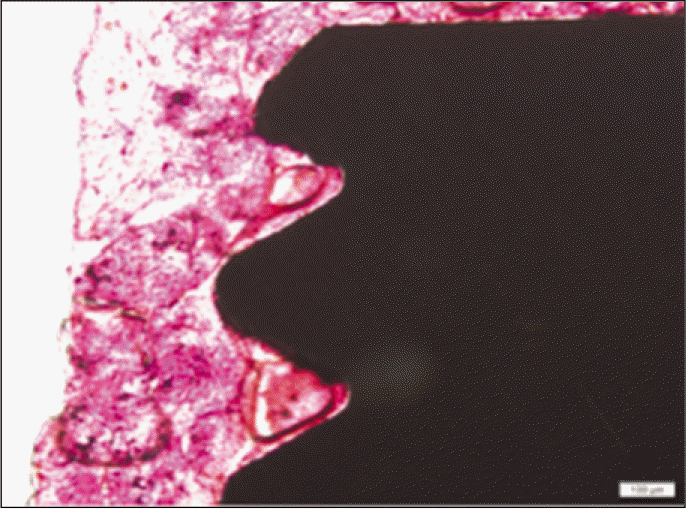
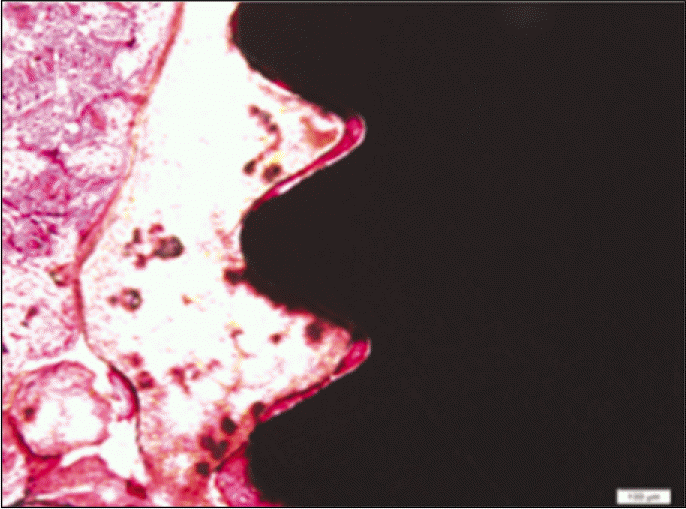
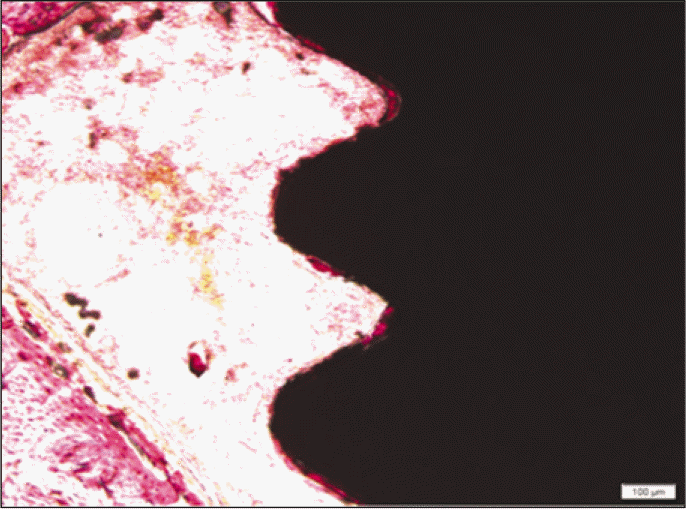
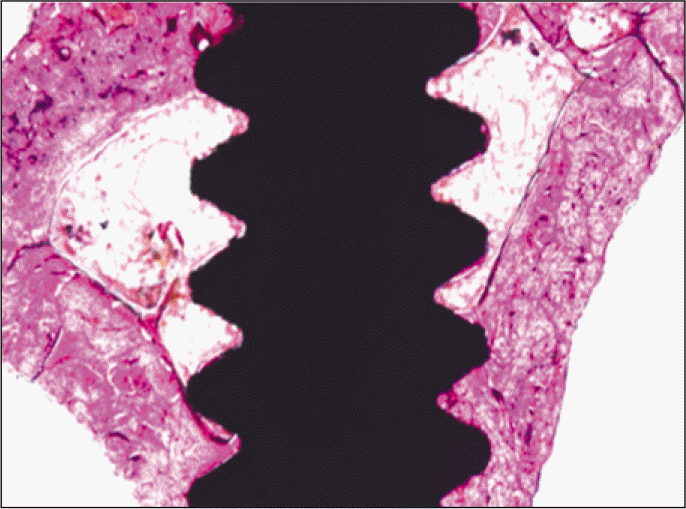
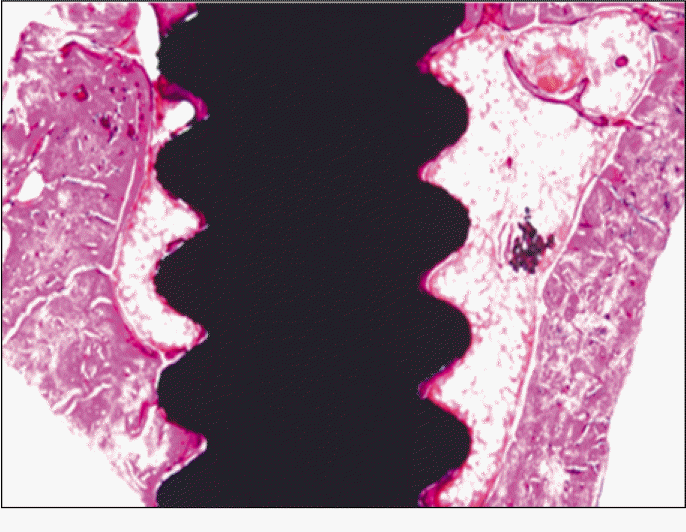
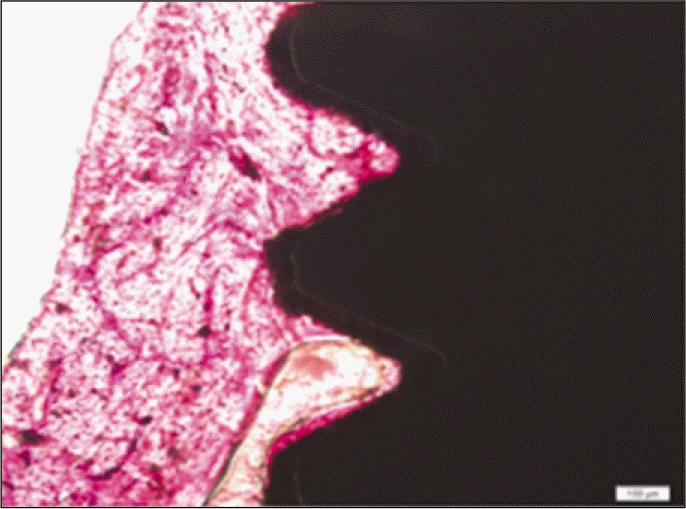
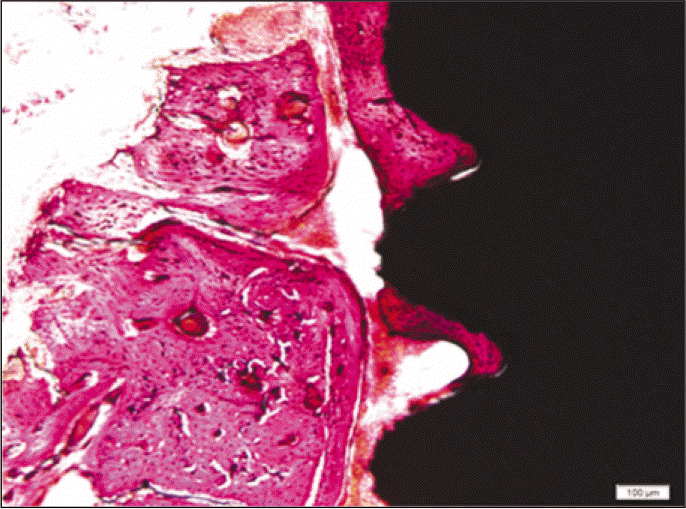
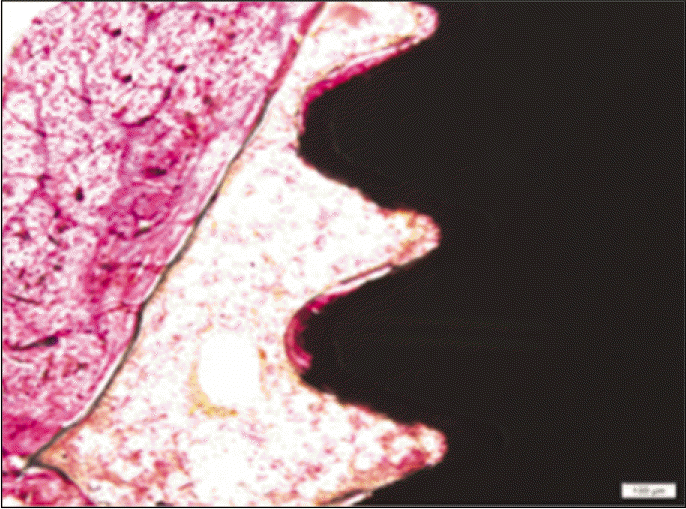
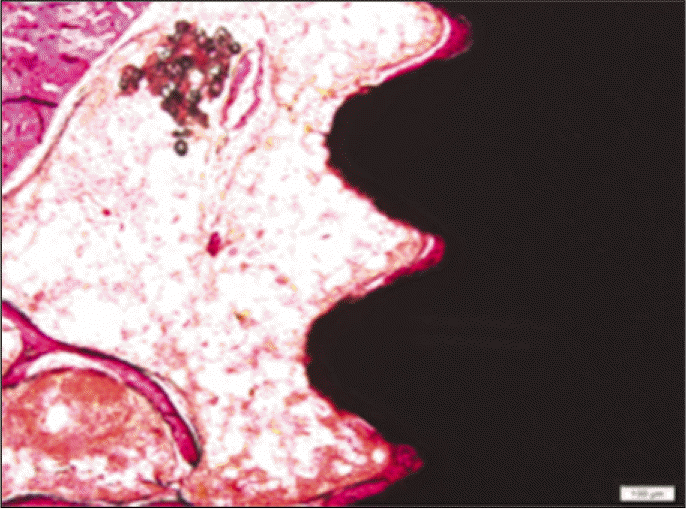
According to the Periotest® measurement, both experimental and control groups showed decrease in values as time elapsed. Greater decrease was observed in the experimental group but there was no significant difference. By examining the radiographic images, both experimental and control groups showed tendency of increase in bone density. Greater increase was seen in the experimental group but there was no significant difference. According to the bone-to-implant contact measurement, both experimental and control groups showed increase in values as time elapsed. Greater increase was seen in the experimental group. At the 2nd and 4th week, there was no significant difference. But at the 6th week, there was significant difference (P<.05). By histological analysis, both experimental and control groups showed increase in bone formation as time elapsed. In addition, greater increase was seen in the experimental group.
Go to : 
REFERENCES
1.Sykaras N., Iacopino AM., Marker VA., Triplett RG., Woody RD. Implant materials, designs, and surface topographies: their effect on osseointegration. A literature review. Int J Oral Maxillofac Implants. 2000. 15:675–90.
2.Le Gue′hennec L., Soueidan A., Layrolle P., Amouriq Y. Surface treatments of titanium dental implants for rapid osseointegration. Dent Mater. 2007. 23:844–54.
4.Albrektsson T., Braemark PI., Hansson HA., Lindstro¨m J. Osseointegrated titanium implants. Requirements for ensuring a long-lasting, direct bone-to-implant anchorage in man. Acta Orthop Scand. 1981. 52:155–70.
5.Kim JK., Kim SW., Kim JY., Ko SY., Kim HM., Baek JH., Ryoo HM., Oh KO. Effect of Rehmannia glutinosa Libosch and Acanthopanax senticosus extracts on osteoblastic activity and proliferation and osteoclastic bone resorption. Korean J Bone Metab. 2002. 9:133–43.
6.Zhang RX., Li MX., Jia ZP. Rehmannia glutinosa: review of botany, chemistry and pharmacology. J Ethnopharmacol. 2008. 117:199–214.

7.Amano S., Hanazawa S., Hirose K., Ohmori Y., Kitano S. Stimulatory effect on bone resorption of interleukin-1-like cytokine produced by an osteoblast-rich population of mouse calvarial cells. Calcif Tissue Int. 1988. 43:88–91.

8.Ritchlin CT., Haas-Smith SA., Li P., Hicks DG., Schwarz EM. Mechanisms of TNF-alpha- and RANKL-mediated osteoclas-togenesis and bone resorption in psoriatic arthritis. J Clin Invest. 2003. 111:821–31.
9.Park SW., Cho IH. The effect of PRF on the osseointegration and stability of implant. MS thesis. In: Korea, Department of Prosthodontics, Graduate School Dankook University. 2005.
10.Kang SJ., Cho IH., Shin SY. The effect of OPB-Kon the os-seointegration and stability of implant. J Korean Acad Prosthodont. 2008. 46:31–41.
11.Choi YS., Kim EK., Kim SW., Cho IH. The efficacy evaluation of PostPlantTM Calcium in dental implant placement. J Korean Acad Prosthodont. 2010. 48:128–34.
12.Anderson JJ., Garner SC., Mar MH., Boass A., Toverud SU., Parikh I. The ovariectomized, lactating rat as an experimental model for osteopenia: calcium metabolism and bone changes. Bone Miner. 1990. 11:43–53.

13.Bagi CM., Mecham M., Weiss J., Miller SC. Comparative morphometric changes in rat cortical bone following ovariectomy and/or immobilization. Bone. 1993. 14:877–83.

14.Thompson DD., Simmons HA., Pirie CM., Ke HZ. FDA Guidelines and animal models for osteoporosis. Bone. 1995. 17:125S–133S.

15.Ohta H., Suda Y., Makita K., Nozawa S., Nemoto K. Influences of menopause and oophorectomy on bone metabolism and spinal bone mineral content. Nihon Sanka Fujinka Gakkai Zasshi. 1991. 43:422–8.
16.Sennerby L., Thomsen P., Ericson LE. Early tissue response to titanium implants inserted in rabbit cortical bone. Part I. Light microscope observation. J Mater Sci Mater Med. 1993. 4:240–50.
17.Masuda T., Salvi GE., Offenbacher S., Felton DA., Cooper LF. Cell and matrix reactions at titanium implants in surgically prepared rat tibiae. Int J Oral Maxillofac Implants. 1997. 12:472–85.
Go to : 
 | Fig. 1.Schematic diagram of experimented implant blasted with resorbable blasting media (A: Lateral view, B: Occlusal view). |
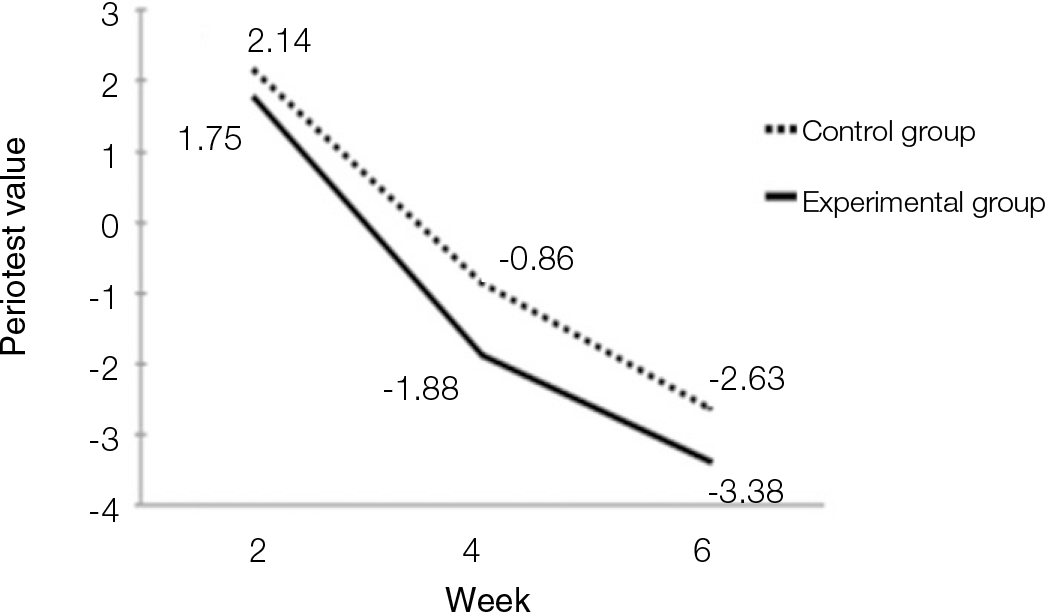 | Fig. 2.Diagram of Periotest values. Values decreased in both experimental and control groups. There was no siginificant difference (P<.05). |
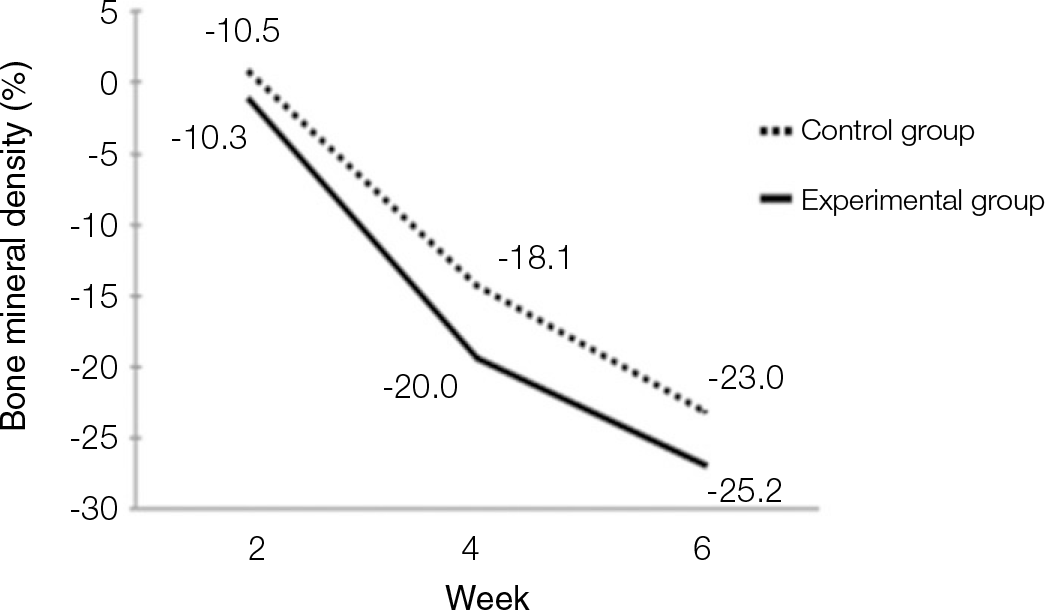 | Fig. 3.Diagram of bone mineral density values measured with bone mineral densitometer. Values decreased in both experimental and control groups. There was no siginificant difference (P<.05). |
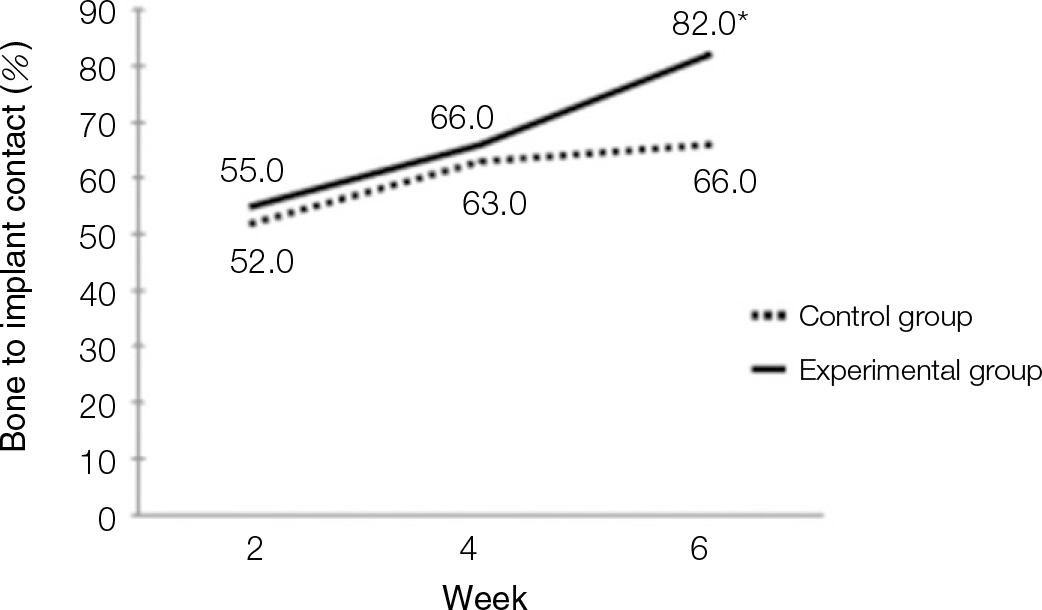 | Fig. 4.Diagram of bone to implant contact (BIC) values. Values increased in both experimental and control groups. ∗At 6th weeks, there was siginificant difference (P<.05). |
Table 1.
Number of specimens of classified groups (N: unit)
| Group | week | N | ||
|---|---|---|---|---|
| 2 | 4 | 6 | ||
| Experimental group | 8 | 8 | 8 | |
| Control group | 8 | 8 | 8 | |
| Total | 16 | 16 | 16 | 48 |
Table 2.
Results of Mann-Whitney U test for Periotest® values
| Week | Control group (Mean ± SD) | Experimental group (Mean ± SD) | P value |
|---|---|---|---|
| 2 | 2.14 ± 2.27 | 1.75 ± 2.25 | .48 |
| 4 | -0.86 ± 1.77 | -1.88 ± 2.03 | .24 |
| 6 | -2.63 ± 0.74 | -3.38 ± 0.91 | .09 |


 PDF
PDF ePub
ePub Citation
 Print
Print


 XML Download