Abstract
Statement of problem
Restoring and replacing teeth with fixed prostheses commonly used in dental practice. Because of improper oral hygiene care and inaccurate laboratory procedure, complications of fixed prostheses were found in the mouth of patients. Although many efforts have been continually made to obtain the data of long term prognosis of fixed prostheses, it was difficult to do it.
Material and methods
In order to assess the clinical status of fixed prostheses, a total of 161 individuals (aged 17-85, 99 women and 62 men with 1596 unit of fixed prostheses, and 1169 abutments) who first visited the Department of Prosthodontics, Pusan National University Hospital, between April to September, in 2007 were examined.
Results and conclusion
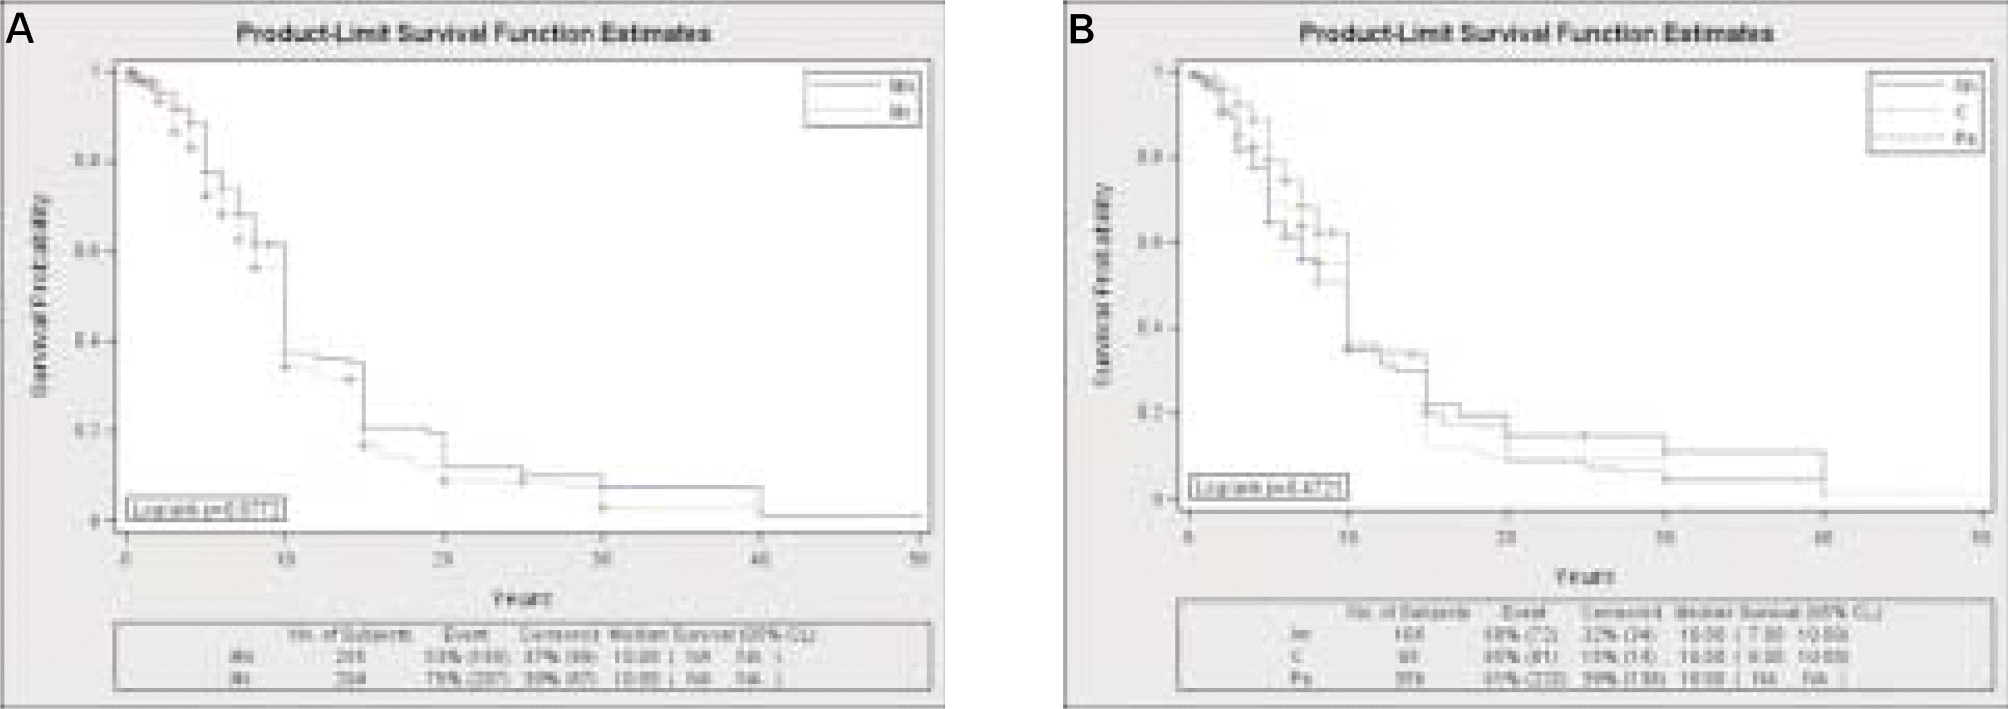
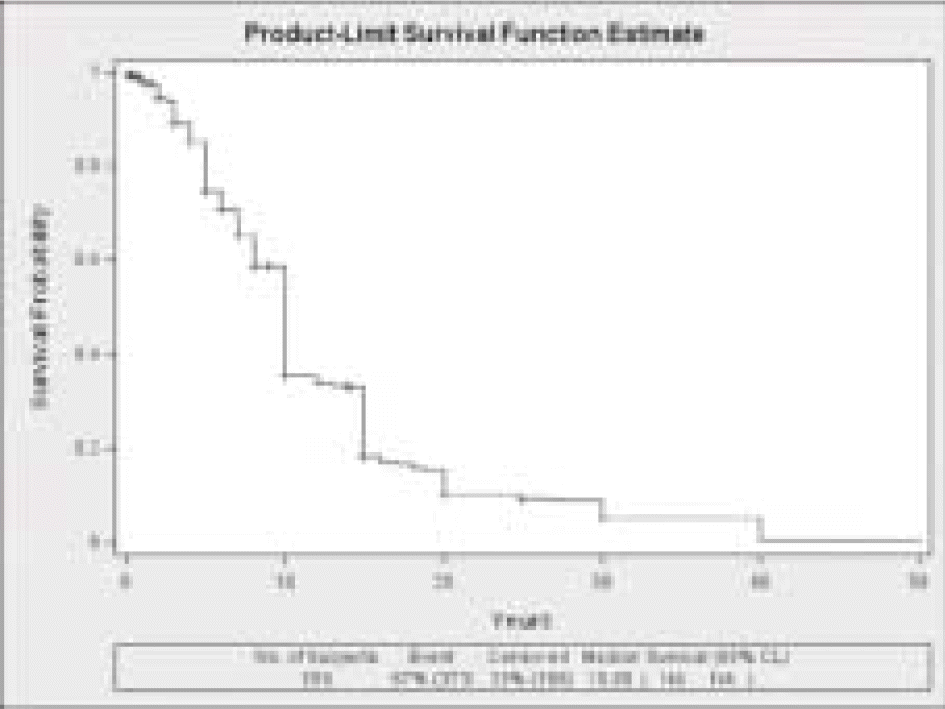
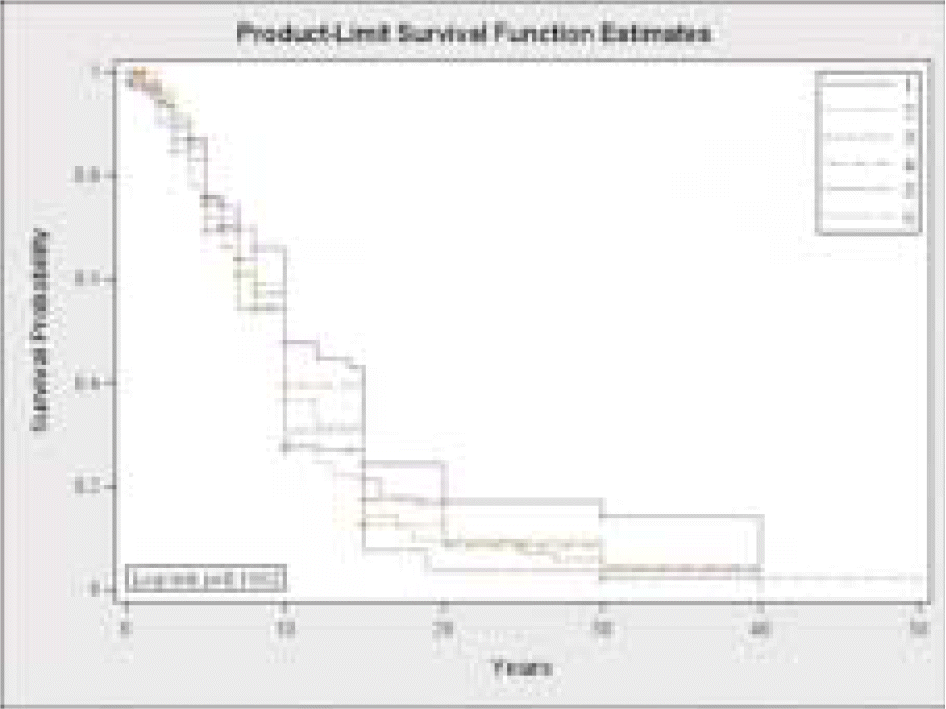
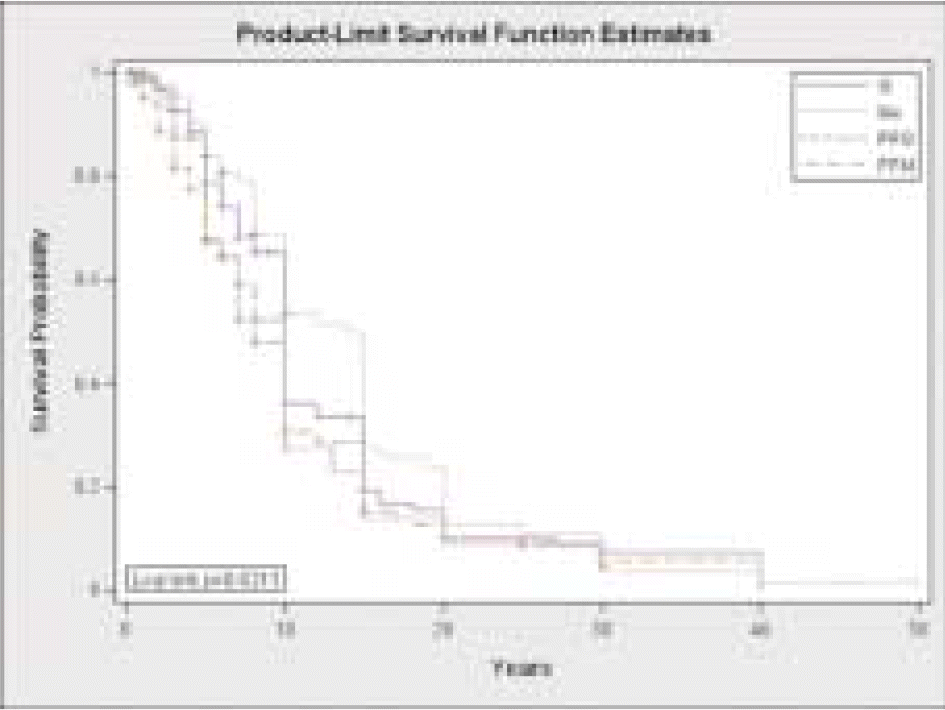
The results of this study were as follows: 1. Length of service of fixed prostheses was 8.6±0.6 years (mean), 10.0 years (median). 2. Location of fixed prostheses was found to have no statistically significant influence on longevity of fixed prostheses (P > .05). But, the success rate was high in posterior region and in mandible where the failure rate was high in combination (P < .05). 3. Longevity of fixed prostheses made of metal was longest (mean: 13.0 ± 9.3, median: 14.0), gold, precious ceramic, non-precious ceramic trailing behind (P < .05). 4. Number of units in fixed prostheses was found to have no statistically significant influence on longevity of fixed prostheses (P > .05). But, the success rate was high in Single-unit and the failure rate was high in over 3-unit (P < .05). 5. Condition of opposing dentition was found to have no statistically significant influence on longevity of fixed prostheses (P > .05). But, the success rate was high in natural dentition (P < .05). 6. Defective margin (28.2%), dental caries (23.0%), periodontal disease (19.3%), periapical disease (16.9%) were frequent complications. In 30.1% of the cases, abutment state after removing fixed prostheses was needed to be extracted.
Go to : 
REFERENCES
1.Schwartz NL., Whitsett LD., Berry TG., Stewart JL. Unserviceable crowns and fixed partial dentures: life-span and causes for loss of serviceability. J Am Dent Assoc. 1970. 81:1395–401.

2.Walton JN., Gardner FM., Agar JR. A survey of crown and fixed partial denture failures: length of service and reasons for replacement. J Prosthet Dent. 1986. 56:416–21.

3.Valderhaug J. A 15-year clinical evaluation of fixed prosthodontics. Acta Odontol Scand. 1991. 49:35–40.

4.Palmqvist S., Swartz B. Artificial crowns and fixed partial dentures 18 to 23 years after placement. Int J Prosthodont. 1993. 6:279–85.
5.Karlsson S. A clinical evaluation of fixed bridges, 10 years following insertion. J Oral Rehabil. 1986. 13:423–32.

6.Glantz PO., Ryge G., Jendresen MD., Nilner K. Quality of extensive fixed prosthodontics after five years. J Prosthet Dent. 1984. 52:475–9.

7.Glantz PO., Nilner K., Jendresen MD., Sundberg H. Quality of fixed prosthodontics after 15 years. Acta Odontol Scand. 1993. 51:247–52.

8.Glantz PO., Nilner K., Jendresen MD., Sundberg H. Quality of fixed prosthodontics after twenty-two years. Acta Odontol Scand. 2002. 60:213–8.

9.Moon HY. A study on the life expectation of dental restorations. Korean Acad Oral Health. 1985. 9:51–74.
10.Shin WJ., Jeon YS., Lee KW., Lee HY., Han DH. Longevity and failure analysis of fixed restorations serviced in Korea. J Korean Acad Prosthodont. 2005. 43:158–75.
11.Foster LV. The relationship between failure and design in conventional bridgework from general dental practice. J Oral Rehabil. 1991. 18:491–5.

12.Foster LV. Failed conventional bridge work from general dental practice: clinical aspects and treatment needs of 142 cases. Br Dent J. 1990. 168:199–201.

13.Roberts DH. The relationship between age and the failure rate of bridge prostheses. Br Dent J. 1970. 128:175–7.

14.Libby G., Arcuri MR., LaVelle WE., Hebl L. Longevity of fixed partial dentures. J Prosthet Dent. 1997. 78:127–31.

15.Holm C., Tidehag P., Tillberg A., Molin M. Longevity and quality of FPDs: a retrospective study of restorations 30, 20, and 10 years after insertion. Int J Prosthodont. 2003. 16:283–9.
16.Drake CW., Maryniuk GA., Bentley C. Reasons for restoration replacement: differences in practice patterns. Quintessence Int. 1990. 21:125–30.
17.Ryge G., Snyder M. Evaluating the clinical quality of restorations. J Am Dent Assoc. 1973. 87:369–77.

18.Leempoel PJ., Van't Hof MA., de Haan AF. Survival studies of dental restorations: criteria, methods and analyses. J Oral Rehabil. 1989. 16:387–94.

20.Randow K., Glantz PO., Zo ¨ger B. Technical failures and some related clinical complications in extensive fixed prosthodontics. An epidemiological study of long-term clinical quality. Acta Odontol Scand. 1986. 44:241–55.

Go to : 
 | Fig. 2.Kaplan-Meier survival curve of fixed prostheses in location. A, in the maxilla and the mandible; B, in the anterior region, in the posterior region, and the combination. |
Table I.
Distribution of age group and gender
Table II.
Examination method and list and evaluation of fixed prostheses
Table III.
Distribution of fixed prostheses in success and failure according to location
Table IV.
Distribution of fixed prostheses in success and failure according to material
Table V.
Distribution of fixed prostheses in success and failure according to unit
Table VI.
Distribution of fixed prostheses in success and failure according to condition of opposing dentition
Identical superscripted small letters denote no significant differences among condition of opposing dentition of fixed prostheses in each success and failure (P > .05). Number less than 5 was excluded from significant test. FPD, fixed partial denture; RPD, removable partial denture; CD, complete denture.
Table VII.
Complication of fixed prostheses


 PDF
PDF ePub
ePub Citation
 Print
Print


 XML Download