Abstract
Statement of problem
Porcelain veneers have become a popular treatment modality for aesthetic anterior prosthesis. Fitting porcelain veneers in the mouth usually involve a try-in appointment, which frequently results in salivary contamination of fitting surfaces.
Purpose
An in vitro study was carried out to investigate the effect of silane treatment timing and saliva contamination on the resin bond strength to porcelain veneer surface.
Material and methods
Cylindrical test specimens (n = 360) and rectangular test specimens (n = 5) were prepared for shear bond test and contact angle analysis. Whole cylindrical specimens divided into 20 groups, each of which received a different surface treatment and/or storage condition. The composite resin cement stubs were light-polymerized onto porcelain adherends. The shear bond strengths of cemented stubs were measured after dry storage and thermocycling (3,000 cycles) between 5 and 55℃. The silane and their reactions were chemically monitored by using Fourier Transform Infrared Spectroscopy analysis (FTIR) and contact angle analysis. One-way analysis of variance (ANOVA) and Dunnett's multiple comparison were used to analyze the data.
Results
FT-IR analysis showed that salivary contamination and silane treatment timing did not affect the surface interactions of silane. Observed water contact angles were lower on the saliva contaminated porcelain surface and the addition of 37% phosphoric acid for 20 seconds on saliva contaminated porcelain increased the degree of contact angle. Silane applied to the porcelain, a few days before cementation, resulted in increasing the bond strength after thermocycling.
Go to : 
REFERENCES
1.Groten M., Pro ¨ bster L. The influence of different cementation modes on the fracture resistance of feldspathic ceramic crowns. Int J Prosthodont. 1997. 10:169–77.
2.Pisani-Proenca J., Erhardt MC., Valandro LF., Gutierrez-Aceves G., Bolanos-Carmona MV., Del Castillo-Salmeron R., Bottino MA. Influence of ceramic surface conditioning and resin cements on microtensile bond strength to a glass ceramic. J Prosthet Dent. 2006. 96:412–7.

3.Koenig JL., Emadipour H. Mechanical characterization of the interfacial strength of glass-reinforced composites. Polymer Composites. 1985. 6:142–50.

4.Hayakawa T., Horie K., Aida M., Kanaya H., Kobayashi T., Murata Y. The influence of surface conditions and silane agents on the bond of resin to dental porcelain. Dent Mater. 1992. 8:238–40.

5.Della Bona A., Anusavice KJ., Mecholsky JJ Jr. Failure analysis of resin composite bonded to ceramic. Dent Mater. 2003. 19:693–9.

7.Quaas AC., Yang B., Kern M. Panavia F 2.0 bonding to contaminated zirconia ceramic after different cleaning procedures. Dent Mater. 2007. 23:506–12.

8.Silverstone LM., Hicks MJ., Featherstone MJ. Oral fluid contamination of etched enamel surfaces: an SEM study. J Am Dent Assoc. 1985. 110:329–32.

9.Aboush YE. Removing saliva contamination from porcelain veneers before bonding. J Prosthet Dent. 1998. 80:649–53.

10.Matinlinna JP., Lassila LV., Vallittu PK. Evaluation of five dental silanes on bonding a luting cement onto silica-coated titanium. J Dent. 2006. 34:721–6.

11.Anagnostopoulos T., Eliades G., Palaghias G. Composition, reactivity and surface interactions of three dental silane primers. Dent Mater. 1993. 9:182–90.

12.Hooshmand T., van Noort R., Keshvad A. Storage effect of a pre-activated silane on the resin to ceramic bond. Dent Mater. 2004. 20:635–42.

13.Kato H., Matsumura H., Tanaka T., Atsuta M. Bond strength and durability of porcelain bonding systems. J Prosthet Dent. 1996. 75:163–8.

14.Nakamura S., Yoshida K., Kamada K., Atsuta M. Bonding between resin luting cement and glass infiltrated alumina-reinforced ceramics with silane coupling agent. J Oral Rehabil. 2004. 31:785–9.

15.Kerr C., Walker P. Some aspects of silane technology of surface coatings and adhesives. Allen KA, editor. Adhesion 12,. London: Elsevier Applied Science Publishers;1987. p. 17–38.
16.Plueddeman EP. Catalytic effects in bonding thermosetting resins to silane treated fillers. Deanin RD, Shott NR, editors. Fillers and reinforcements for plastics. Advances in Chemistry Series 134. Washington DC: Am Chem Soc;1974. p. 86–94.
17.Ishida H. Structural gradient In the silane coupling agent layers and its influence on the mechanical and physical properties of composites. Ishida H, Kumar G, editors. Molecular characterization of composite interface. New York: Plenum Press;1985. p. 25–50.

18.Ishida H., Koenig JL. A Fourier-transform infrared spectroscopic study of the hydrolytic stability of silane coupling agents on E-glass fibers. J Polymer Sci: Polymer Physics. 1980. 18:1931–43.

19.Calamia JR. Etched porcelain veneers: the current state of the art. Quintessence Int. 1985. 16:5–12.
Go to : 
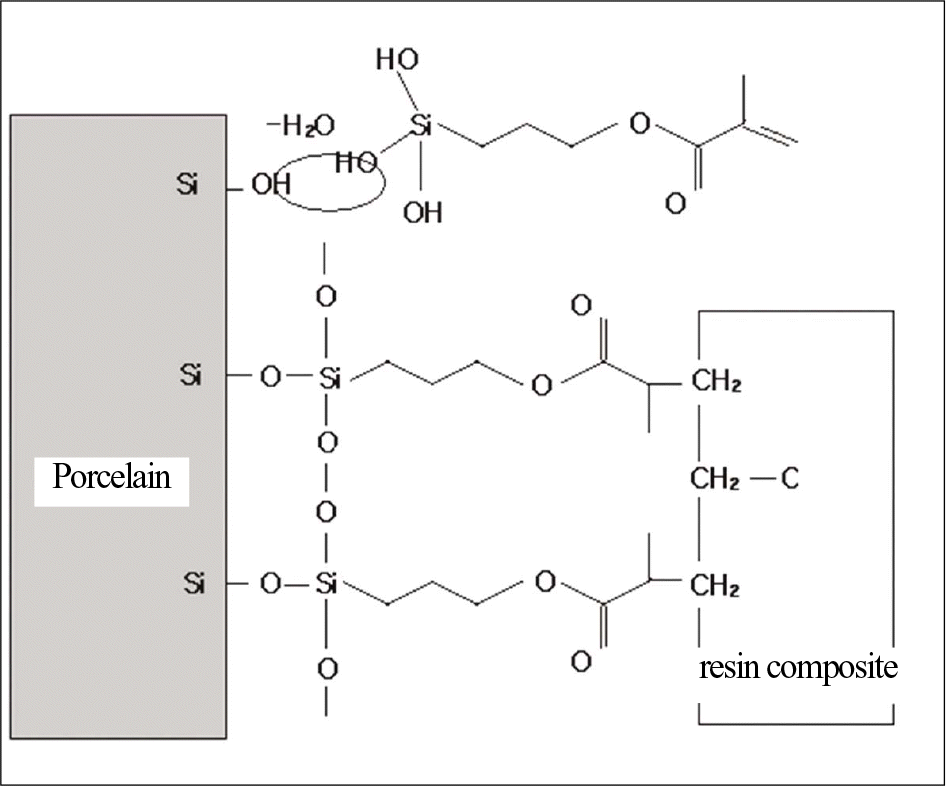 | Fig. 1.Schematic representation of a strong chemical bond between the dental porcelain and resin composite can be achieved by treatment with a silane coupling agent. |
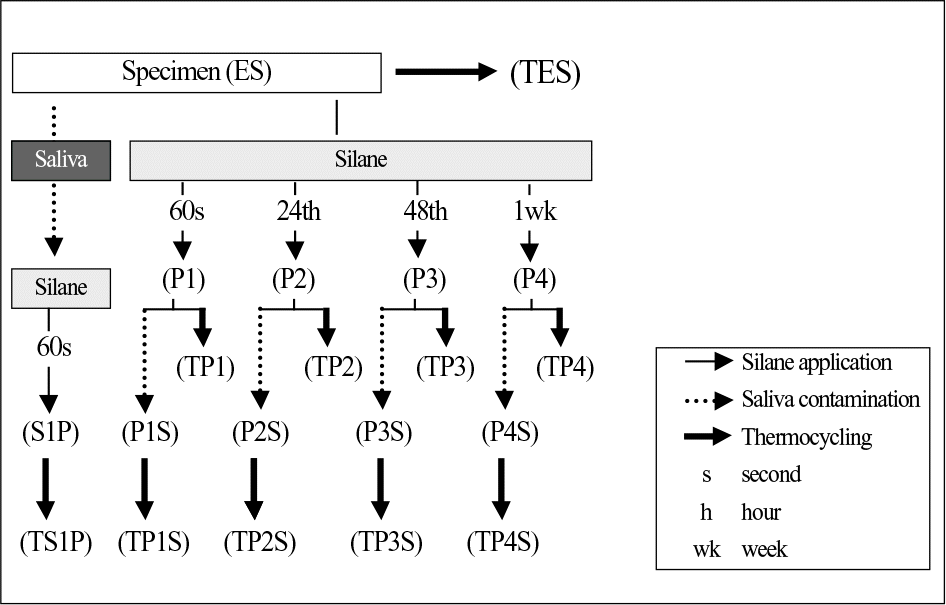 | Fig. 2.Schematic diagram of the specimens with different surface treatment. Specimen; Sandblasting + Hydrofluoric acid etching. |
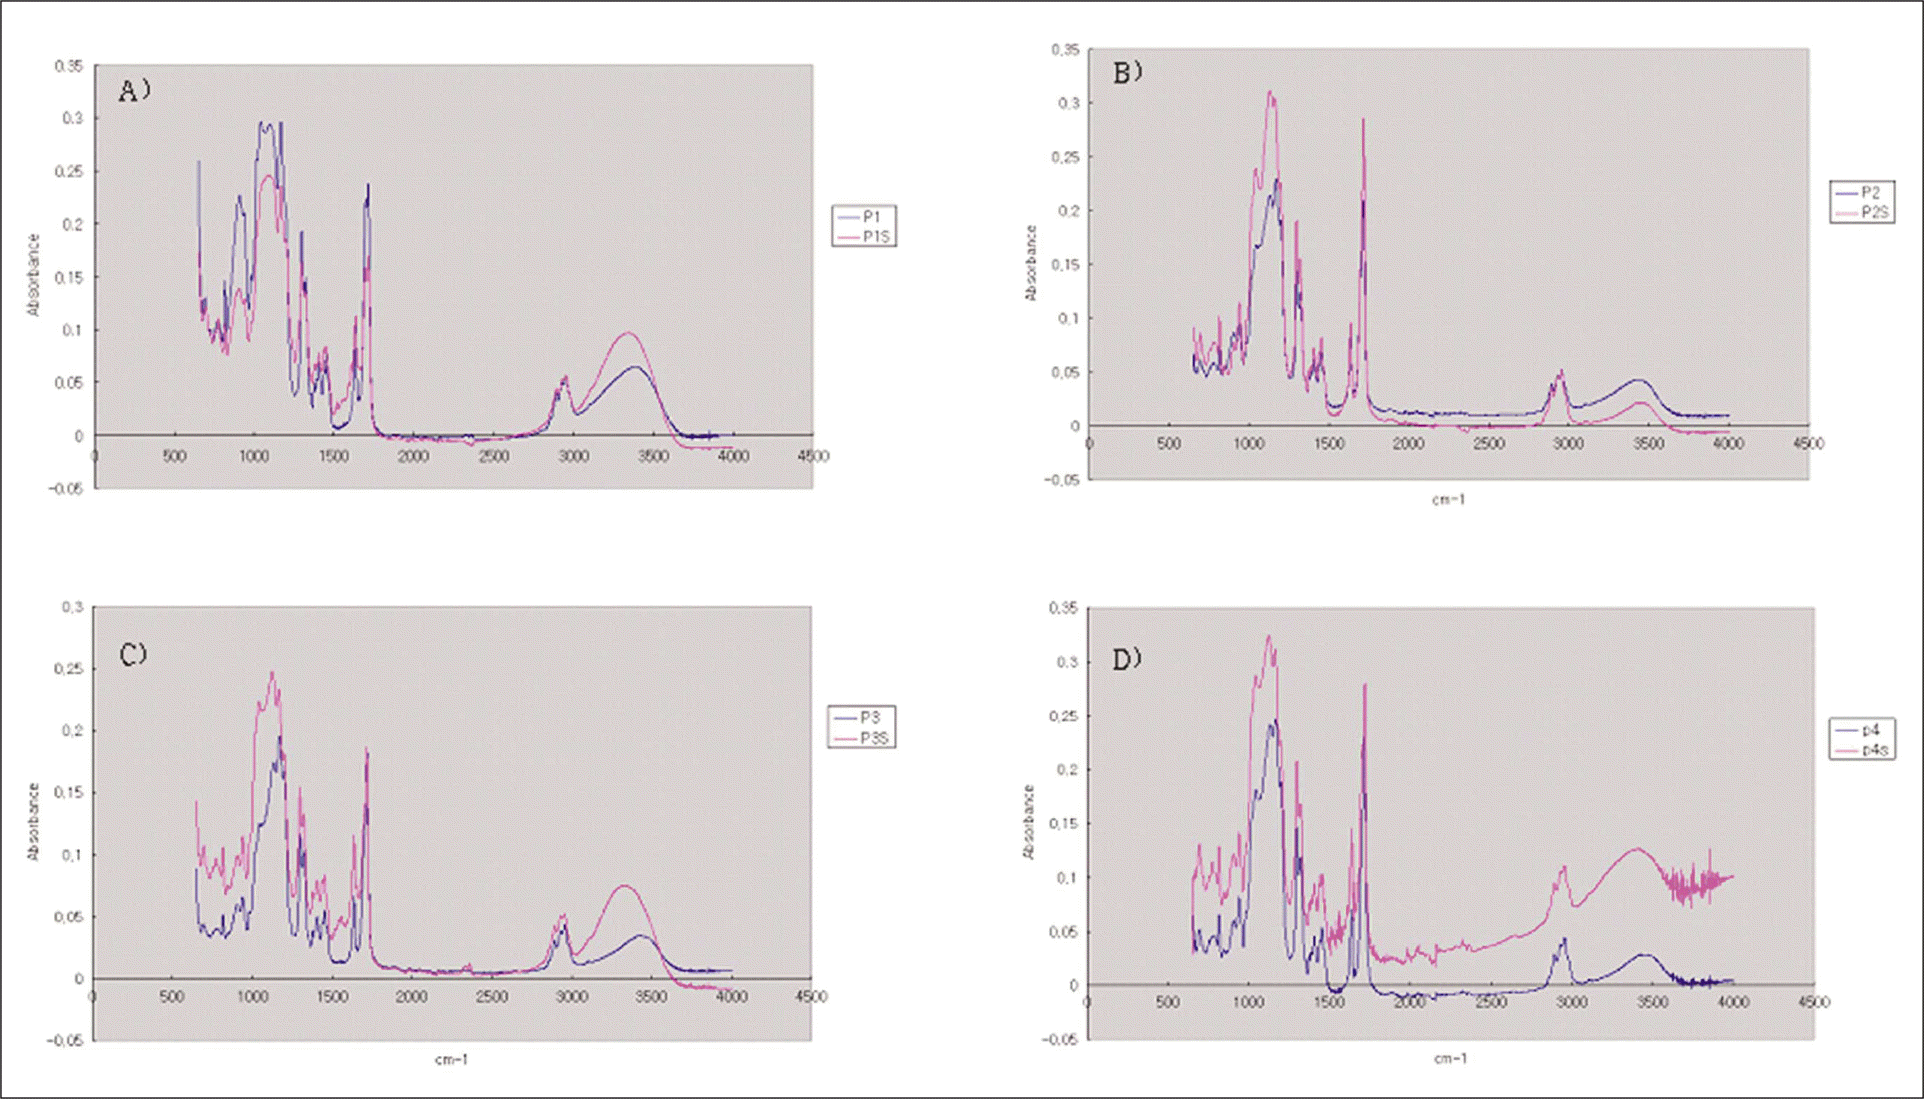 | Fig. 3.The FTIR - ATR spectra of the silane with and without saliva contamination. A, 60 seconds after contamination; B, after 24 hour storage in drying condition; C, after 48 hour storage in drying condition; D, after 1 week storage in drying condition. |
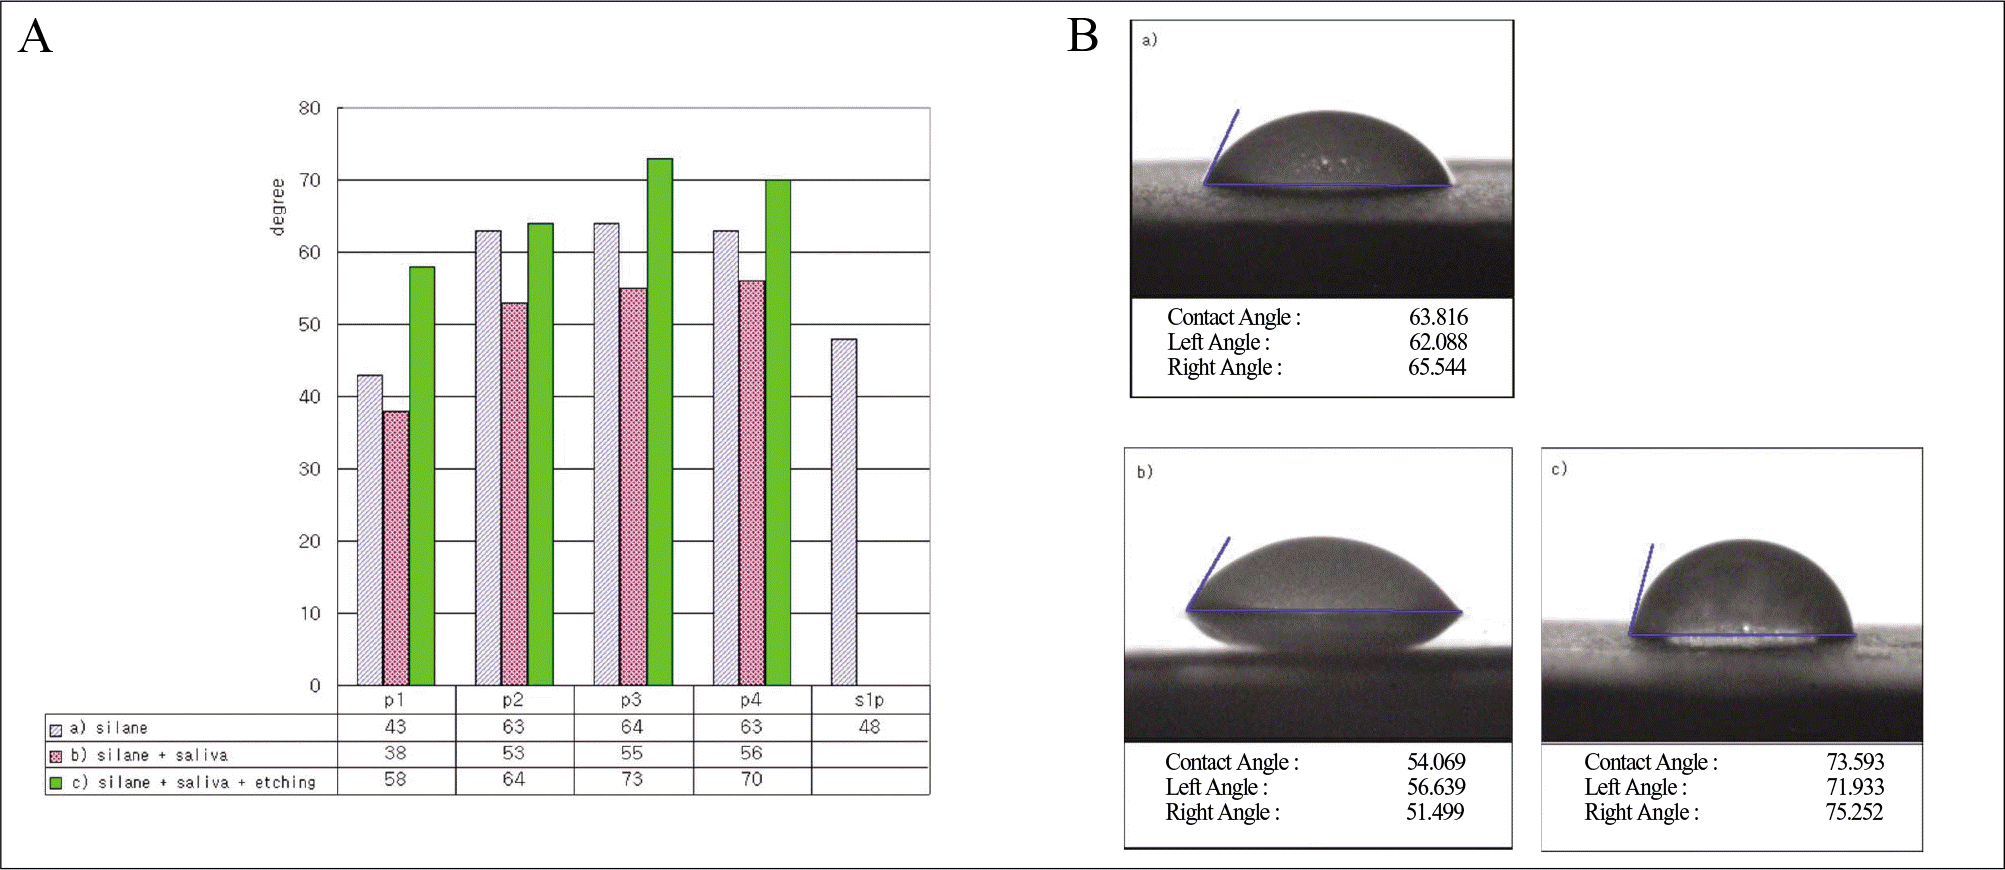 | Fig. 4.A, Contact angle data for different surface treatment. B, Contact angle photograph of P3 group. a) silane application, b) saliva contamination after silane application, c) phosphoric acid etching after silane application and saliva contamination. |
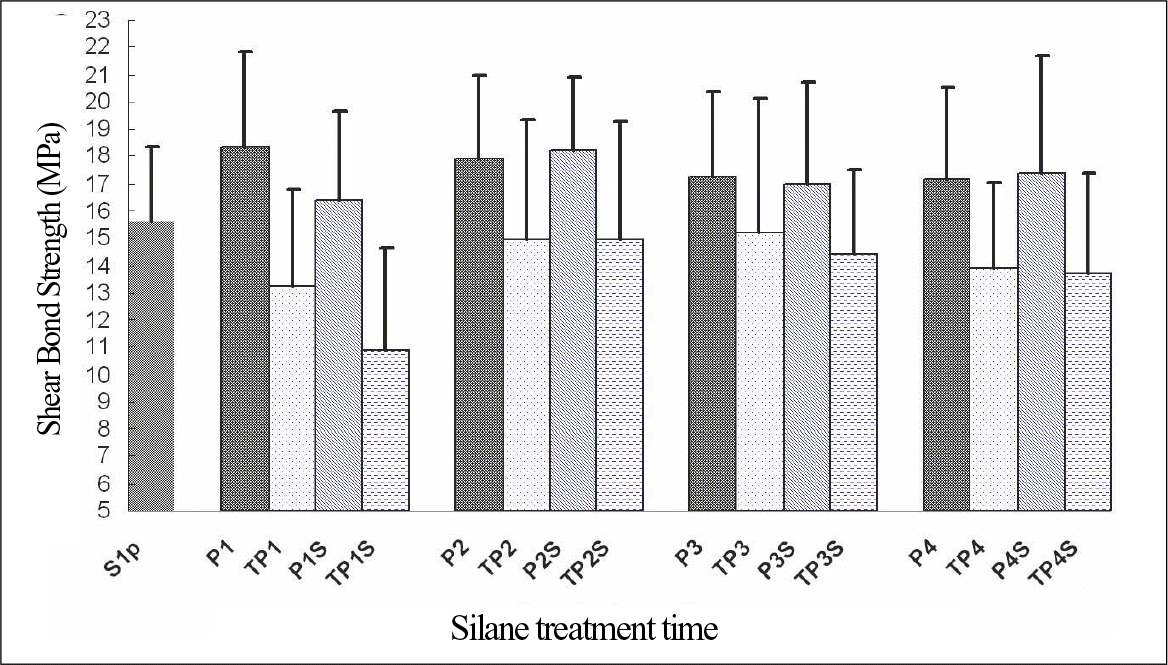 | Fig. 5.Shear bond strength data for porcelain after different surface treatment (bar represent standard deviations; n = 18 for each set of data). |
Table I.
Statistical analysis of shear bond strengths and failure mode for porcelain after different surface treatment
| Group | N | MPa∗ | F - value | P - value† | Failure Mode | |
|---|---|---|---|---|---|---|
| Adhesive failure | Cohesive failure | |||||
| S1P (control) | 18 | 15.60 ± 2.77 | 10.32 | <.0001 | 0 | 18 |
| P1S | 18 | 16.39 ± 3.25 | 0 | 18 | ||
| P2S | 18 | 18.23 ± 2.67 | 1 | 17 | ||
| P3S | 18 | 16.96 ± 3.74 | 0 | 18 | ||
| P4S | 18 | 17.35 ± 4.35 | 0 | 18 | ||
| ES | 18 | 11.03 ± 2.41a | 0 | 18 | ||
| P1 | 18 | 18.34 ± 3.52 | 0 | 18 | ||
| P2 | 18 | 17.89 ± 3.10 | 0 | 18 | ||
| P3 | 18 | 17.27 ± 3.13 | 0 | 18 | ||
| P4 | 18 | 17.21 ± 3.29 | 0 | 18 | ||
| TES | 18 | 10.12 ± 2.31a | 0 | 18 | ||
| TP1 | 18 | 13.23 ± 3.56 | 4 | 14 | ||
| TP2 | 18 | 14.95 ± 4.39 | 4 | 14 | ||
| TP3 | 18 | 15.21 ± 4.92 | 4 | 14 | ||
| TP4 | 18 | 13.90 ± 3.13 | 2 | 16 | ||
| TP1S | 18 | 10.90 ± 3.75a | 10 | 8 | ||
| TP2S | 18 | 14.92 ± 4.32 | 5 | 13 | ||
| TP3S | 18 | 14.42 ± 3.09 | 4 | 14 | ||
| TP4S | 18 | 13.72 ± 3.64 | 5 | 13 | ||
| TS1P | 18 | 10.89 ± 2.74a | 11 | 7 | ||
Table II.
The effect of saliva contamination on shear bond strengths of porcelain stored various periods before thermocycling
| a) | Group | N | MPa∗ | F value | P - value† |
| S1P | 18 | 15.60 ± 2.77 | 1.52 | 0.2033 | |
| 1S | 18 | 16.39 ± 3.25 | |||
| P2S | 18 | 18.23 ± 2.67 | |||
| P3S | 18 | 16.96 ± 3.74 | |||
| P4S | 18 | 17.35 ± 4.35 | |||
| b) | Group | N | MPa∗ | F value | P - value† |
| S1P | 18 | 15.60 ± 2.77 | 1.93 | 0.1122 | |
| P1 | 18 | 18.34 ± 3.52a | |||
| P2 | 18 | 17.89 ± 3.10 | |||
| P3 | 18 | 17.27 ± 3.13 | |||
| P4 | 18 | 17.21 ± 3.29 |
Table III.
The effect of saliva contamination on shear bond strengths of porcelain stored various periods after thermocycling
| a) | Group | N | MPa∗ | F value | P - value† |
| TS1P | 18 | 10.89 ± 2.74 | 5.38 | 0.0007 | |
| TP1S | 18 | 10.90 ± 3.75 | |||
| TP2S | 18 | 14.92 ± 4.32a | |||
| TP3S | 18 | 14.42 ± 3.09a | |||
| TP4S | 18 | 13.72 ± 3.64 | |||
| b) | Group | N | MPa∗ | F value | P - value† |
| TS1P | 18 | 10.89 ± 2.74 | 3.67 | 0.0083 | |
| TP1 | 18 | 13.23 ± 3.56 | |||
| TP2 | 18 | 14.95 ± 4.39a | |||
| TP3 | 18 | 15.21 ± 4.92a | |||
| TP4 | 18 | 13.90 ± 3.13 |


 PDF
PDF ePub
ePub Citation
 Print
Print


 XML Download