Abstract
Purpose
The purpose of this study was to compare the marginal fitness and fracture load of the zirconia copings according to the design with different thickness and coloration.
Material and methods
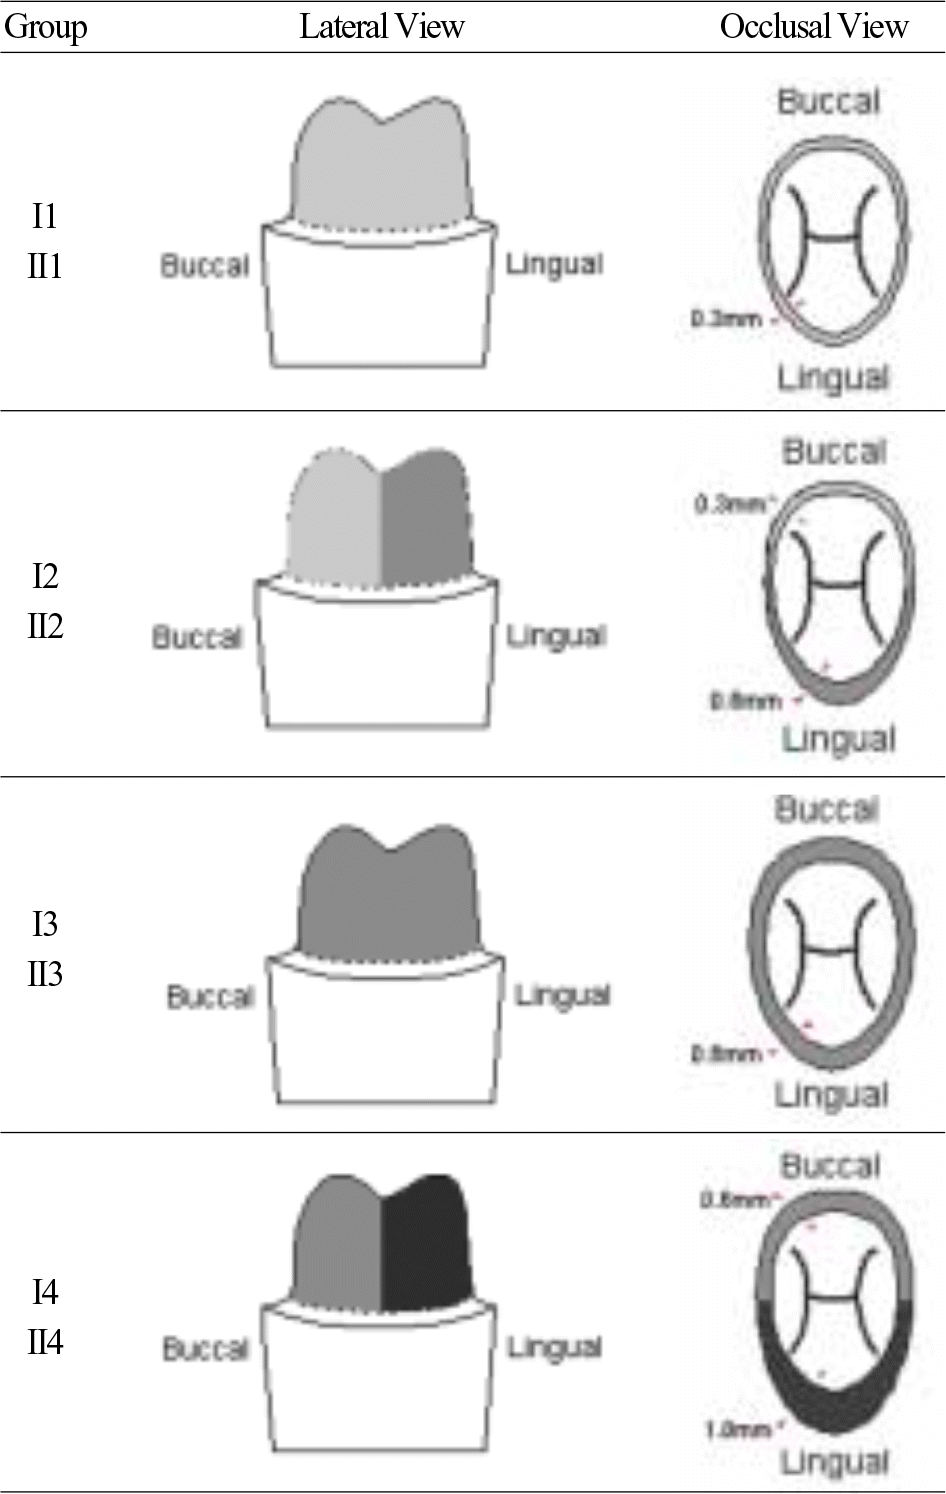
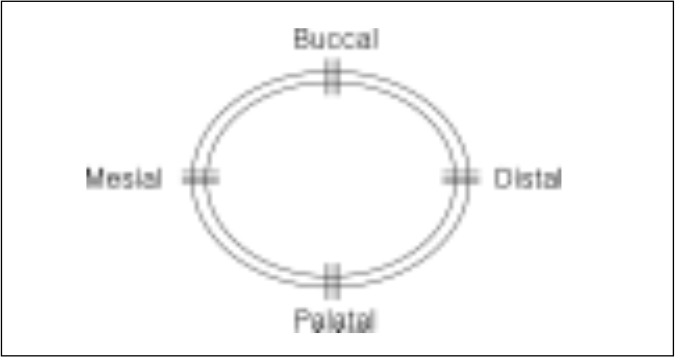
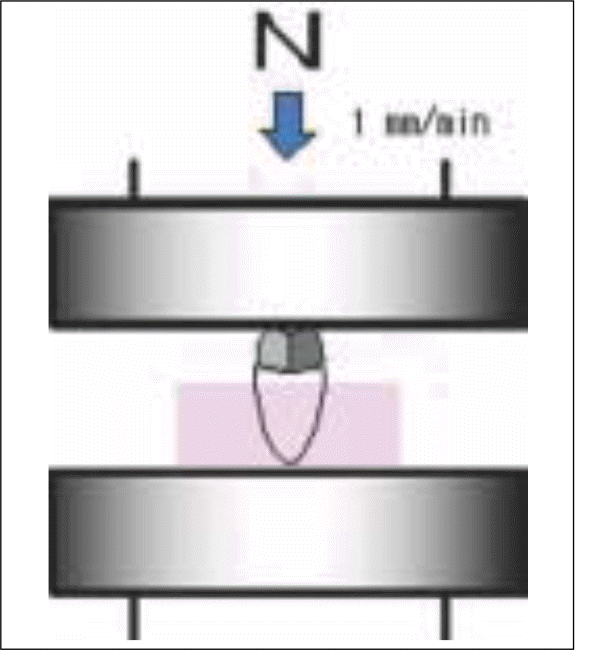
The evaluation was based on 80 zirconia copings. Zirconia copings were fabricated in design with different thicknesses using CAD/CAM system (Everset, KAVO dental GmbH, Biberach, Germany). The designs of copings were divided into four groups. The first group consisted of copings with uniform thickness of 0.3 mm. The thickness in the second group was 0.3 mm on the buccal surface and 0.6 mm on the lingual surface. The third group consisted of coping with uniform thickness of 0.6 mm. The thickness in the fourth group was 0.6 mm on the buccal surface and 1mm on the lingual surface. Each group consisted of 10 colored and 10 uncolored copings. Half of the copings (40) processed with a milling system according to the specific design were sent to be given a color (A3) through saturation in special dye by a manufacturing company. Just after sintering, the marginal discrepancies of copings were measured on the buccal, lingual, mesial and distal surfaces of metal die, under a Video Microscope System (sv-35, Sometech, Seoul, Korea) at a magnification of × 100. It was remeasured after the adjusting of the inner surface. Next, all copings were luted to the metal dies using reinforced cement {GC FujiCEM (GC Corp. Tokyo, Japan)} and mounted on the testing jig in a Universal Testing Machine (Instron 4467, Norwood, MA, USA). The results were analyzed statistically using the one-way ANOVA test.
Results
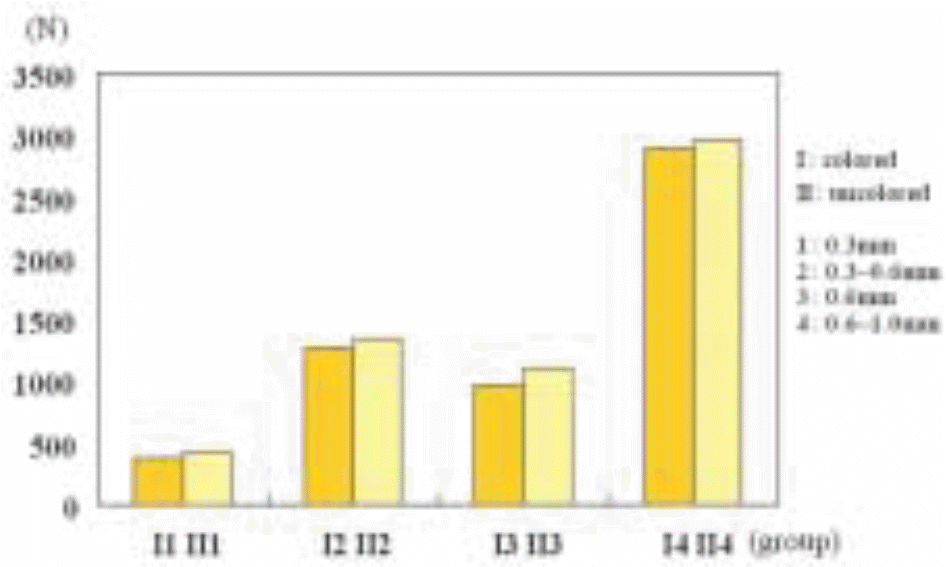
The obtained results were as follow: 1. The measured value of marginal discrepancy right after sintering was the greatest in the contraction of the buccal area in all groups, except for group I2. 2. There was no significant difference of marginal fitness among the groups in the colored zirconia group (P < .05). 3. When the marginal fitness among the groups in the uncolored zirconia group was considered, group II2 had the smallest marginal discrepancy. 4. When the colored and uncolored groups with the same design were compared, there was a significant difference between I1 and II1 groups. In group 2, 3, and 4, the uncolored zirconia had the greatest marginal fitness (P < .05). 5. After adjustment of inner surface, there was no significant difference in the marginal fitness in all groups when color and design of the zirconia coping were compared. 6. The fracture load of CAD/CAM zirconia copings showed significant difference in group 1, 2, 3, and 4. I4 and II4 had the strongest fracture load. 7. When groups with different color and same design were compared, all colored groups showed greater fracture load (P > .05), with no significance.
Conclusion
There was difference in the marginal fitness according to the design and coloration of zirconia copings right after sintering, but it was decided that the copings may well be used clinically if the inner surface are adjusted. The copings should be thick enough for the reinforcement of fracture strength. But considering the esthetics of the visible surfaces (labial and buccal surface), the thickness of copings may be a little thin, without giving any significant effect on the fracture strength. This type of design may be considered when giving priority to preservation of tooth or esthetics. (J Korean Acad Prosthodont 2009;47:406-15)
Go to : 
REFERENCES
1.Shin ES., Lee YS., Park WH. Comparative study in fracture strength of zirconia cores fabricated with three different CAD/CAM systems. J Korean Acad Prosthodont. 2008. 46:22–30.
2.Jeong HC. Fracture strength of zirconia monolithic crowns. J Korean Acad Prosthodont. 2006. 44:157–64.
3.Giordano R. All-ceramic restorative systems: alumina-based core systems. J Mass Dent Soc. 2002. 51:30–5.
4.White SN., Caputo AA., Li ZC., Zhao XY. Modulus of rupture of the Procera All-Ceramic System. J Esthet Dent. 1996. 8:120–6.

5.Wagner WC., Chu TM. Biaxial flexural strength and indentation fracture toughness of three new dental core ceramics. J Prosthet Dent. 1996. 76:140–4.

6.Kelly JR., Tesk JA., Sorensen JA. Failure of all-ceramic fixed partial dentures in vitro and in vivo: analysis and modeling. J Dent Res. 1995. 74:1253–8.
7.Fischer H., Weber M., Marx R. Lifetime prediction of all-ceramic bridges by computational methods. J Dent Res. 2003. 82:238–42.

8.Kupiec KA., Wuertz KM., Barkmeier WW., Wilwerding TM. Evaluation of porcelain surface treatments and agents for composite-to-porcelain repair. J Prosthet Dent. 1996. 76:119–24.

9.May KB., Russell MM., Razzoog ME., Lang BR. Precision of fit: the Procera AllCeram crown. J Prosthet Dent. 1998. 80:394–404.

10.Kim DK., Cho IH., Lim JH., Lim HS. On the Marginal fidelity of All-ceramic core using CAD/CAM system. J Korean Acad Prosthodont. 2003. 41:20–33.
11.Tinschert J., Natt G., Mautsch W., Spiekermann H., Anusavice KJ. Marginal fit of alumina-and zirconia-based fixed partial dentures produced by a CAD/CAM system. Oper Dent. 2001. 26:367–74.
12.Valderrama S., Van Roekel N., Andersson M., Goodacre CJ., Munoz CA. A comparison of the marginal and internal adaptation of titanium and gold-platinum-palladium metal ceramic crowns. Int J Prosthodont. 1995. 8:29–37.
13.Kelly JR., Nishimura I., Campbell SD. Ceramics in dentistry: historical roots and current perspectives. J Prosthet Dent. 1996. 75:18–32.

14.Heffernan MJ., Aquilino SA., Diaz-Arnold AM., Haselton DR., Stanford CM., Vargas MA. Relative translucency of six all-ceramic systems. Part I: core materials. J Prosthet Dent. 2002. 88:4–9.

15.Heffernan MJ., Aquilino SA., Diaz-Arnold AM., Haselton DR., Stanford CM., Vargas MA. Relative translucency of six all-ceramic systems. Part II: core and veneer materials. J Prosthet Dent. 2002. 88:10–5.

16.Antonson SA., Anusavice KJ. Contrast ratio of veneering and core ceramics as a function of thickness. Int J Prosthodont. 2001. 14:316–20.
17.Johnston WM., Ma T., Kienle BH. Translucency parameter of colorants for maxillofacial prostheses. Int J Prosthodont. 1995. 8:79–86.
18.Zhang Y., Griggs JA., Benham AW. Influence of powder/liquid mixing ratio on porosity and translucency of dental porcelains. J Prosthet Dent. 2004. 91:128–35.

19.Devigus A., Lombardi G. Shading Vita YZ substructures: influence on value and chroma, part I. Int J Comput Dent. 2004. 7:293–301.
20.Devigus A., Lombardi G. Shading Vita In-ceram YZ substructures: influence on value and chroma, part II. Int J Comput Dent. 2004. 7:379–88.
21.Koutayas SO., Kakaboura A., Hussein A., Strub JR. Colorimetric evaluation of the influence of five different restorative materials on the color of veneered densely sintered alumina. J Esthet Restor Dent. 2003. 15:353–60. discussion 361.

22.Beuer F., Erdelt KJ., Schweiger J., Eichberger M., and Gernet W. Flexural strength and coloured and aged zirconia. 2004. IADR: abstract no 0113.
23.OH SC., Lee HH., Shin MR., Park KS. Translucency and Color Stability of various core Ceramics for All-Ceramic Restoration. J Korean Acad Stomato Func Occ. 2007. 23:156–70.
24.Koo JY., Lim JH., Cho IH. Marginal fidelity according to the margin types of all ceramic crowns. J Korean Acad Prosthodont. 1997. 35:445–57.
25.Sorensen JA. A standardized method for determination of crown margin fidelity. J Prosthet Dent. 1990. 64:18–24.

26.Kay GW., Jablonski DA., Dogon IL. Factors affecting the seating and fit of complete crowns: a computer simulation study. J Prosthet Dent. 1986. 55:13–8.

27.Kim IS., Kang DW. Marginal adaptation of the conical inner crown fabrication with CAD/CAM. J Korean Acad Prosthodont. 2002. 40:30–41.
28.Boening KW., Wolf BH., Schmidt AE., Ka ¨ stner K., Walter MH. Clinical fit of Procera AllCeram crowns. J Prosthet Dent. 2000. 84:419–24.

29.Wang CJ., Millstein PL., Nathanson D. Effects of cement, cement space, marginal design, seating aid materials, and seating force on crown cementation. J Prosthet Dent. 1992. 67:786–90.

30.Oh SC., Lee HH., Lee IK., Shin MR. Flexure strength of various colored and uncolored zirconia ceramics for allceramic restoration. J Korean Acad Stomato Func Occ. 2007. 23:119–30.
31.Beuer F., Erdelt KJ., Schweiger J., Eichberger M., Gernet W. Flexural strength and coloured and aged zirconia. 2004. IADR;abstract no 1775.
32.Huang H., Zhang FQ., Sun J., Gao L. Effect of three kinds of rare earth oxides on chromaticity and mechanical properties of zirconia ceramic. Zhonghua Kou Qiang Yi Xue Za Zhi. 2006. 41:327–30.
33.Hwang JW., Yang JH. A study on the fracture strength of conventional and copy-milled In-ceram crown. J Korean Acad Prosthodont. 1997. 35:417–29.
34.Seghi RR., Daher T., Caputo A. Relative flexural strength of dental restorative ceramics. Dent Mater. 1990. 6:181–4.

35.Lee SK., Wilson PR. Fracture strength of all-ceramic crowns with varying core elastic moduli. Aust Dent J. 2000. 45:103–7.
36.Seo JY., Park IN., Lee KW. Fracture strength between different connector designs of zirconia core for posterior fixed partial dentures manufactured with CAD/CAM system. J Korean Acad Prosthodont. 2006. 44:29–39.
Go to : 
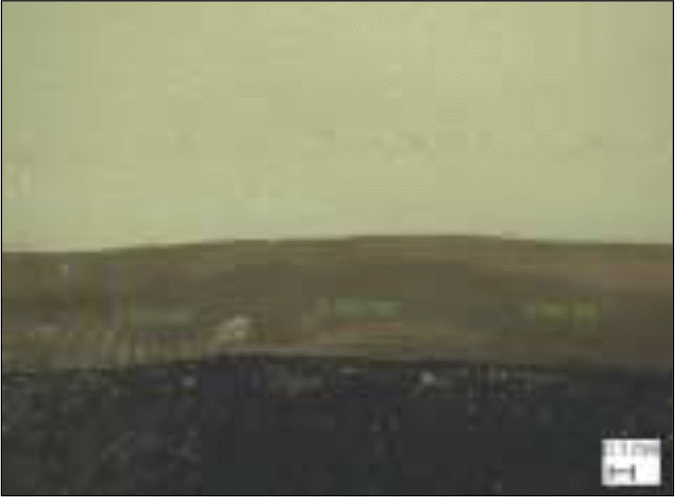 | Fig. 4.Measurement of the marginal discrepancy using the video microscope system just after sintering (× 100). |
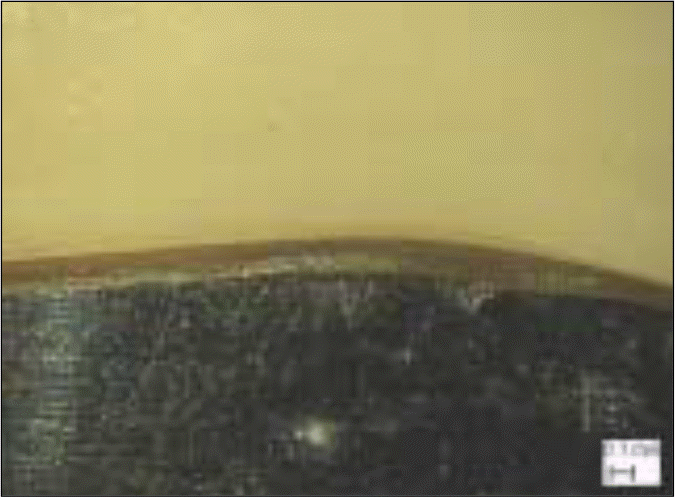 | Fig. 5.Measurement of the marginal discrepancy using the video microscope system after internal adjusting and sintering (× 100). |
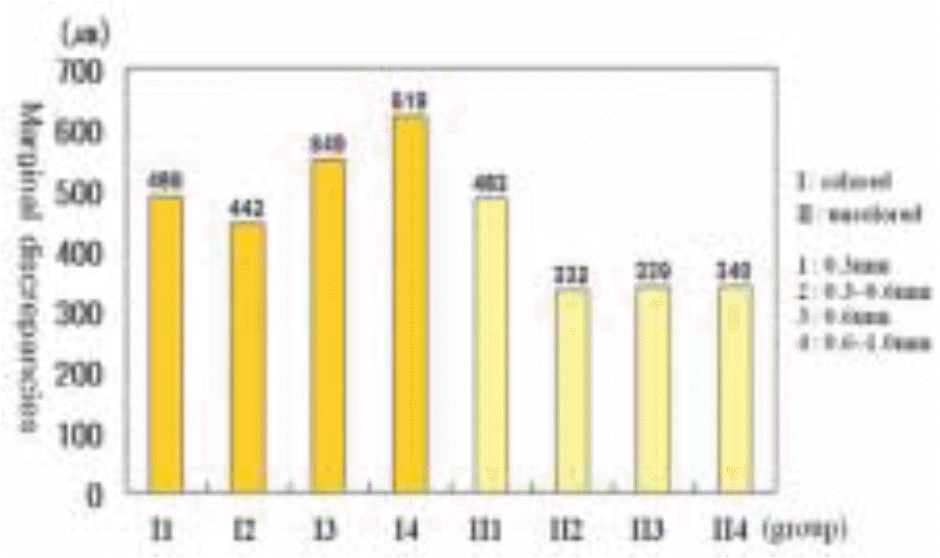 | Fig. 8.Comparison of marginal discrepancy of zirconia core with different designs just after sintering without any adjustment. |
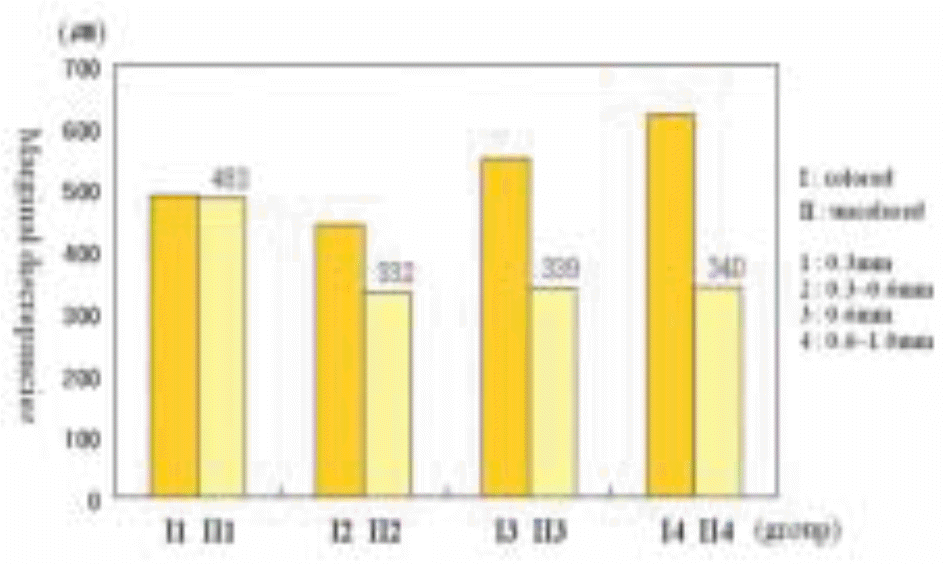 | Fig. 9.Comparison of marginal discrepancy of zirconia coping with different color just after sintering. |
Table I.
Group naming of zirconia coping by design
Table II.
Mean of fracture strength (N) and standard deviation of all Groups
| I1 | I2 | I3 | I4 | II1 | II2 | II3 | II4 | |
|---|---|---|---|---|---|---|---|---|
| mean | 373.4 | 1278 | 968.3 | 2892.8 | 435.1 | 1352.1 | 1116.6 | 2962.4 |
| SD | 83.9 | 515.9 | 112.3 | 569.1 | 105.6 | 480.3 | 89.6 | 462.9 |
Table III.
Result of one-way ANOVA for fracture load of Group I
| Sum of squares | df | Mean square | F | Sig. | |
|---|---|---|---|---|---|
| Between groups | 384867.056 | 3 | 128289.019 | 98.522 | .000 |
| Within groups | 46876.982 | 36 | 1302.138 | ||
| Total | 431744.038 | 39 |
Table IV.
Result of one-way ANOVA for fracture load of Group II
| Sum of squares | df | Mean square | F | Sig. | |
|---|---|---|---|---|---|
| Between groups | 336560.301 | 3 | 112186.767 | 75.136 | .000 |
| Within groups | 53752.122 | 36 | 1493.114 | ||
| Total | 390312.423 | 39 |
Table V.
Result of independent t test of zirconia coping groups with different color and same design
Table VI.
Mean of total marginal discrepancies (μ m) of each CAD/CAM zirconia coping groups just after sintering
Table VII.
Result of one-way ANOVA for marginal discrepancy of Group I
| Sum of squares | df | Mean Square | F | Sig. | |
|---|---|---|---|---|---|
| Between groups | 170946.713 | 3 | 56982.238 | 2.606 | 0.067 |
| Within groups | 787158.188 | 36 | 21865.505 | ||
| Total | 958104.900 | 39 |
Table VIII.
Result of one-way ANOVA for marginal fitness of Group II
| Sum of squares | df | Mean Square | F | Sig. | |
|---|---|---|---|---|---|
| Between groups | 449658.042 | 3 | 149886.014 | 5.802 | 0.002 |
| Within groups | 930007.206 | 36 | 25833.534 | ||
| Total | 1379665.248 | 39 |
Table IX.
Result of independent t-test of zirconia coping groups with different color and same design just after sintering without any adjustment


 PDF
PDF ePub
ePub Citation
 Print
Print


 XML Download